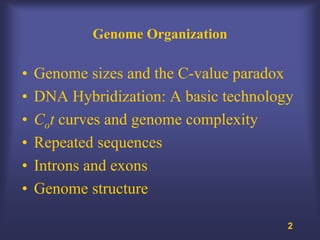
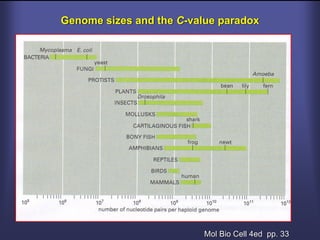
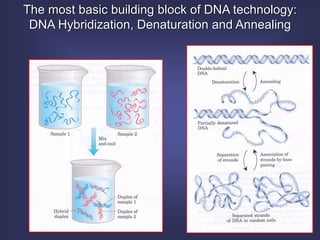
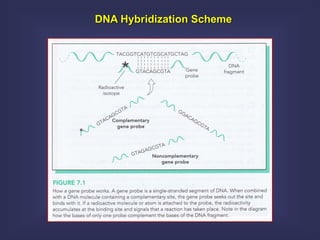
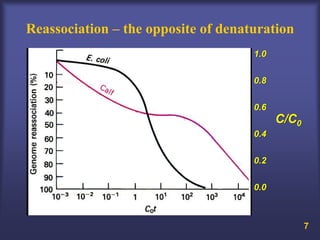
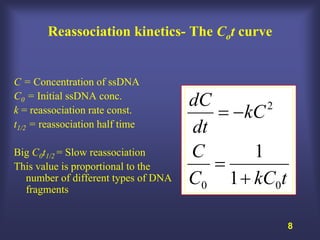
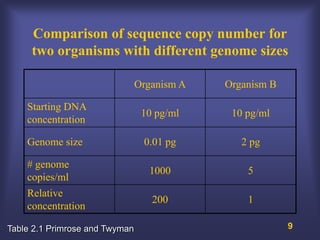
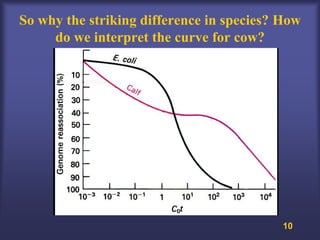
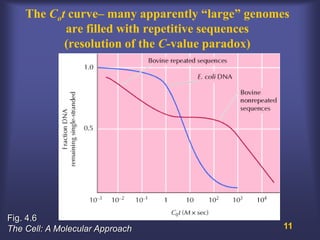
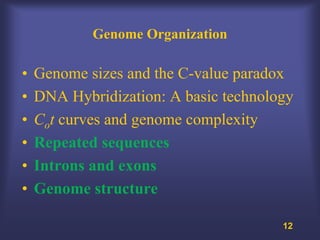
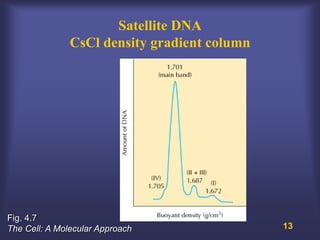
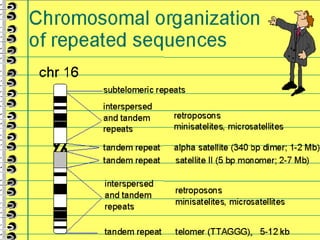
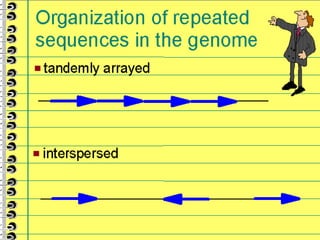
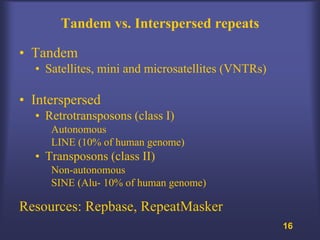
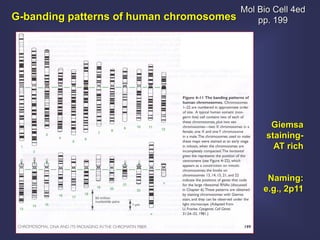
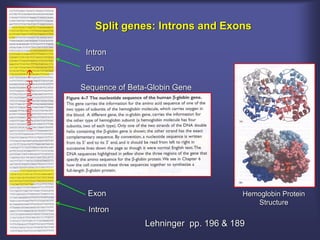
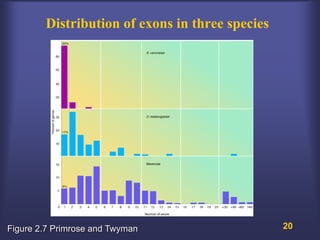
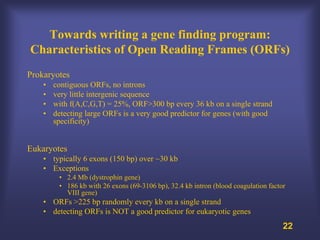
BE 183 Applied Genomic Technologies


                   Lecture 2
 Genome Organization and Structure


                  Trey Ideker

    Departments of Bioengineering and Medicine
         University of California San Diego
Genome Organization

•   Genome sizes and the C-value paradox
•   DNA Hybridization: A basic technology
•   Cot curves and genome complexity
•   Repeated sequences
•   Introns and exons
•   Genome structure

                                        2
Genome sizes and the C-value paradox


                          Mol Bio Cell 4ed pp. 33
The most basic building block of DNA technology:
 DNA Hybridization, Denaturation and Annealing
DNA Hybridization Scheme
Hybridization - Heat denaturation, melting temperature (tm), other factors


                                  Temperature, pH, size (# bp’s),
                                  G/C to A/T ratio, ionic strength,
                                  chem denaturants, detergents, chaotropics
                                  Stringency (high and low)
Reassociation – the opposite of denaturation
                                     1.0


                                     0.8


                                     0.6
                                           C/C0
                                     0.4


                                     0.2


                                     0.0


                                                  7
Reassociation kinetics- The Cot curve


C = Concentration of ssDNA
C0 = Initial ssDNA conc.
                                     dC
k = reassociation rate const.           = −kC 2
t1/2 = reassociation half time       dt
Big C0t1/2 = Slow reassociation      C      1
This value is proportional to the       =
  number of different types of DNA
  fragments
                                     C0 1 + kC0t

                                                   8
Comparison of sequence copy number for
     two organisms with different genome sizes

                                Organism A   Organism B

    Starting DNA
                                 10 pg/ml     10 pg/ml
    concentration

    Genome size                  0.01 pg        2 pg

    # genome
                                  1000           5
    copies/ml
    Relative
                                   200           1
    concentration

Table 2.1 Primrose and Twyman                             9
So why the striking difference in species? How
     do we interpret the curve for cow?


                                           10
The Cot curve– many apparently “large” genomes
           are filled with repetitive sequences
           (resolution of the C-value paradox)


Fig. 4.6
The Cell: A Molecular Approach                  11
Genome Organization

•   Genome sizes and the C-value paradox
•   DNA Hybridization: A basic technology
•   Cot curves and genome complexity
•   Repeated sequences
•   Introns and exons
•   Genome structure

                                       12
Satellite DNA
               CsCl density gradient column


Fig. 4.7
The Cell: A Molecular Approach                13
14
15
Tandem vs. Interspersed repeats

• Tandem
  • Satellites, mini and microsatellites (VNTRs)

• Interspersed
  • Retrotransposons (class I)
     Autonomous
     LINE (10% of human genome)
  • Transposons (class II)
     Non-autonomous
     SINE (Alu- 10% of human genome)

Resources: Repbase, RepeatMasker
                                                   16
Genome Structure


•   Linear/Circular/Segmented
•   Centromere/Telomere (TTAGGG)
•   Origin of replication
•   Heterochromatin/Euchromatin
•   GC content, GC isochores
•   CpG islands
•   Exons/Introns
                                   17
Mol Bio Cell 4ed
G-banding patterns of human chromosomes       pp. 199


                                                 Giemsa
                                                staining-
                                                  AT rich


                                                Naming:
                                               e.g., 2p11
Split genes: Introns and Exons

                      Intron

                      Exon
- Point Mutation !


                     Sequence of Beta-Globin Gene


                      Exon                                 Hemoglobin Protein
                                                              Structure
                       Intron
                                     Lehninger pp. 196 & 189
Distribution of exons in three species


Figure 2.7 Primrose and Twyman                   20
Given these features, how might one write a
                gene finder?


                                         21
                      21
Towards writing a gene finding program:
Characteristics of Open Reading Frames (ORFs)
Prokaryotes
    •   contiguous ORFs, no introns
    •   very little intergenic sequence
    •   with f(A,C,G,T) = 25%, ORF>300 bp every 36 kb on a single strand
    •   detecting large ORFs is a very good predictor for genes (with good
        specificity)


Eukaryotes
    • typically 6 exons (150 bp) over ~30 kb
    • Exceptions
         • 2.4 Mb (dystrophin gene)
         • 186 kb with 26 exons (69-3106 bp), 32.4 kb intron (blood coagulation factor
           VIII gene)
    • ORFs >225 bp randomly every kb on a single strand
    • detecting ORFs is NOT a good predictor for eukaryotic genes
                                                                                     22

Biotech 2011-07-finding-orf-etc

  • 1.
    BE 183 AppliedGenomic Technologies Lecture 2 Genome Organization and Structure Trey Ideker Departments of Bioengineering and Medicine University of California San Diego
  • 2.
    Genome Organization • Genome sizes and the C-value paradox • DNA Hybridization: A basic technology • Cot curves and genome complexity • Repeated sequences • Introns and exons • Genome structure 2
  • 3.
    Genome sizes andthe C-value paradox Mol Bio Cell 4ed pp. 33
  • 4.
    The most basicbuilding block of DNA technology: DNA Hybridization, Denaturation and Annealing
  • 5.
  • 6.
    Hybridization - Heatdenaturation, melting temperature (tm), other factors Temperature, pH, size (# bp’s), G/C to A/T ratio, ionic strength, chem denaturants, detergents, chaotropics Stringency (high and low)
  • 7.
    Reassociation – theopposite of denaturation 1.0 0.8 0.6 C/C0 0.4 0.2 0.0 7
  • 8.
    Reassociation kinetics- TheCot curve C = Concentration of ssDNA C0 = Initial ssDNA conc. dC k = reassociation rate const. = −kC 2 t1/2 = reassociation half time dt Big C0t1/2 = Slow reassociation C 1 This value is proportional to the = number of different types of DNA fragments C0 1 + kC0t 8
  • 9.
    Comparison of sequencecopy number for two organisms with different genome sizes Organism A Organism B Starting DNA 10 pg/ml 10 pg/ml concentration Genome size 0.01 pg 2 pg # genome 1000 5 copies/ml Relative 200 1 concentration Table 2.1 Primrose and Twyman 9
  • 10.
    So why thestriking difference in species? How do we interpret the curve for cow? 10
  • 11.
    The Cot curve–many apparently “large” genomes are filled with repetitive sequences (resolution of the C-value paradox) Fig. 4.6 The Cell: A Molecular Approach 11
  • 12.
    Genome Organization • Genome sizes and the C-value paradox • DNA Hybridization: A basic technology • Cot curves and genome complexity • Repeated sequences • Introns and exons • Genome structure 12
  • 13.
    Satellite DNA CsCl density gradient column Fig. 4.7 The Cell: A Molecular Approach 13
  • 14.
  • 15.
  • 16.
    Tandem vs. Interspersedrepeats • Tandem • Satellites, mini and microsatellites (VNTRs) • Interspersed • Retrotransposons (class I) Autonomous LINE (10% of human genome) • Transposons (class II) Non-autonomous SINE (Alu- 10% of human genome) Resources: Repbase, RepeatMasker 16
  • 17.
    Genome Structure • Linear/Circular/Segmented • Centromere/Telomere (TTAGGG) • Origin of replication • Heterochromatin/Euchromatin • GC content, GC isochores • CpG islands • Exons/Introns 17
  • 18.
    Mol Bio Cell4ed G-banding patterns of human chromosomes pp. 199 Giemsa staining- AT rich Naming: e.g., 2p11
  • 19.
    Split genes: Intronsand Exons Intron Exon - Point Mutation ! Sequence of Beta-Globin Gene Exon Hemoglobin Protein Structure Intron Lehninger pp. 196 & 189
  • 20.
    Distribution of exonsin three species Figure 2.7 Primrose and Twyman 20
  • 21.
    Given these features,how might one write a gene finder? 21 21
  • 22.
    Towards writing agene finding program: Characteristics of Open Reading Frames (ORFs) Prokaryotes • contiguous ORFs, no introns • very little intergenic sequence • with f(A,C,G,T) = 25%, ORF>300 bp every 36 kb on a single strand • detecting large ORFs is a very good predictor for genes (with good specificity) Eukaryotes • typically 6 exons (150 bp) over ~30 kb • Exceptions • 2.4 Mb (dystrophin gene) • 186 kb with 26 exons (69-3106 bp), 32.4 kb intron (blood coagulation factor VIII gene) • ORFs >225 bp randomly every kb on a single strand • detecting ORFs is NOT a good predictor for eukaryotic genes 22