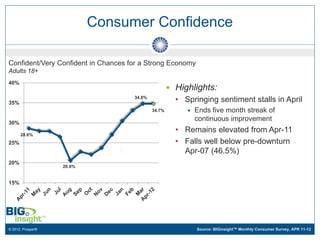
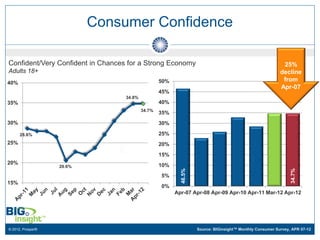
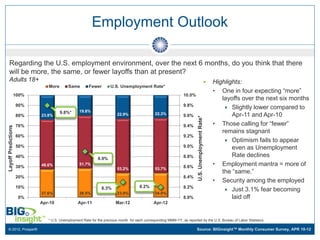
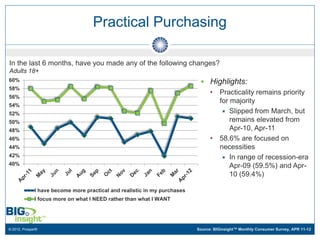
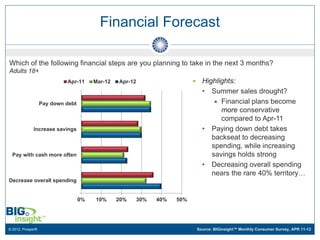
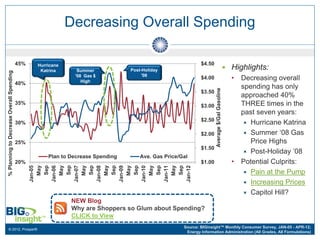
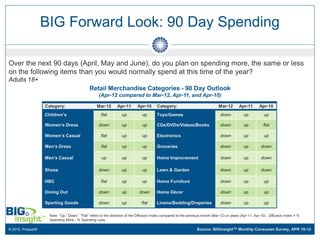
The BIG Call
                    April 2012
          PA M E L A G O O D F E L L O W
CONSUMER INSIGHTS DIRECTOR, BIGINSIGHT™

             S TA C I E S E V E R S
 CLIENT SERVICES MANAGER, BIGINSIGHT™


400 W. Wilson Bridge Road, Suite 200, Worthington, OH, 43085   614-846-0146   info@BIGinsight.com
April 2012 Consumer Survey

  April 2012 Results
   • Consumer Confidence
   • Employment Outlook
   • Practical Purchasing
   • Financial Forecast
                  Decreasing Overall Spending
      • 90 Day Outlook: Future Purchase Plans
  Pain at the Pump
                    This report is derived from the following studies:
                    • BIGinsight™ Monthly Consumer Survey, April 2012 (N = 8724, respondents surveyed 4/3 – 4/10/12)
                    • BIGinsight™ Monthly Consumer Survey Trends, April 2007 – April 2012

                    Disclaimer: BIGinsight™ is a trademark of Prosper Business Development Corp. Services are delivered by Prosper and/or a Prosper affiliated company (“Prosper”).
                    Prosper makes no warranties, either expressed or implied, concerning: data gathered or obtained from any source; the present or future methodology employed in
                    producing the statistics; or the data and estimates represent only the opinion of Prosper and reliance thereon and use thereof shall be at the user’s own risk.

© 2012, Prosper®
Consumer Confidence

Confident/Very Confident in Chances for a Strong Economy
Adults 18+
40%
                                                      Highlights:
                                     34.8%
35%                                                    • Springing sentiment stalls in April
                                             34.7%           Ends five month streak of
                                                              continuous improvement
30%
                                                       • Remains elevated from Apr-11
      28.6%
25%                                                    • Falls well below pre-downturn
                                                         Apr-07 (46.5%)
20%
                   20.6%


15%


© 2012, Prosper®                                              Source: BIGinsight™ Monthly Consumer Survey, APR 11-12
Consumer Confidence

Confident/Very Confident in Chances for a Strong Economy                                                   25%
Adults 18+                                                                                                decline
40%                                                50%                                                     from
                                                                                                          Apr-07
                                                   45%
                                   34.8%
35%                                                40%
                                           34.7%
                                                   35%
30%                                                30%

      28.6%                                        25%
25%                                                20%
                                                   15%
20%                                                10%
                   20.6%


                                                           46.5%


                                                                                                               34.7%
                                                   5%
15%
                                                   0%
                                                         Apr-07 Apr-08 Apr-09 Apr-10 Apr-11 Mar-12 Apr-12


© 2012, Prosper®                                                   Source: BIGinsight™ Monthly Consumer Survey, APR 07-12
Employment Outlook

   Regarding the U.S. employment environment, over the next 6 months, do you think that there
   will be more, the same, or fewer layoffs than at present?
   Adults 18+                                                                                                                                        Highlights:
                              More       Same         Fewer        U.S. Unemployment Rate*
                                                                                                                                                      • One in four expecting “more”
                 100%                                                                                          10.0%
                                                                                                                                                         layoffs over the next six months
                     90%                                                                                       9.8%
                                                                                                                                                           Slightly lower compared to
                                     9.8%*      19.8%
                     80%   23.8%                                       22.9%                  22.3%            9.6%                                          Apr-11 and Apr-10


                                                                                                                        U.S. Unemployment Rate*
                     70%                                                                                       9.4%                                   • Those calling for “fewer”
Layoff Predictions


                                                                                                                                                         remains stagnant
                     60%                                                                                       9.2%
                                                                                                                                                           Optimism fails to appear
                     50%                                                                                       9.0%                                          even as Unemployment
                     40%                                   8.9%                                                8.8%                                          Rate declines
                     30%   48.6%                51.7%
                                                                                                               8.6%                                   • Employment mantra = more of
                                                                       53.2%                  53.7%
                                                                                                                                                         the “same.”
                     20%                                                                                       8.4%
                                                                                                                                                      • Security among the employed
                     10%                                     8.3%                   8.2%                       8.2%
                                                                                                                                                           Just 3.1% fear becoming
                           27.6%                28.5%                  23.9%                  24.0%
                     0%                                                                                        8.0%                                          laid off
                           Apr-10              Apr-11                 Mar-12                 Apr-12


                              * U.S. Unemployment Rate for the previous month for each corresponding MMM-YY, as reported by the U.S. Bureau of Labor Statistics.

© 2012, Prosper®                                                                                                       Source: BIGinsight™ Monthly Consumer Survey, APR 10-12
Practical Purchasing

In the last 6 months, have you made any of the following changes?
Adults 18+
60%                                                                          Highlights:
58%
                                                                                 •   Practicality remains priority
56%
                                                                                     for majority
54%
52%                                                                                    Slipped from March, but
50%                                                                                      remains elevated from
48%                                                                                      Apr-10, Apr-11
46%                                                                              •   58.6% are focused on
44%                                                                                  necessities
42%                                                                                    In range of recession-era
40%                                                                                      Apr-09 (59.5%) and Apr-
                                                                                         10 (59.4%)

              I have become more practical and realistic in my purchases
              I focus more on what I NEED rather than what I WANT


© 2012, Prosper®                                                           Source: BIGinsight™ Monthly Consumer Survey, APR 11-12
Financial Forecast

Which of the following financial steps are you planning to take in the next 3 months?
Adults 18+
                            Apr-11      Mar-12   Apr-12                          Highlights:
                                                                                  • Summer sales drought?
                   Pay down debt                                                      Financial plans become
                                                                                        more conservative
                                                                                        compared to Apr-11
             Increase savings                                                     • Paying down debt takes
                                                                                     backseat to decreasing
                                                                                     spending, while increasing
  Pay with cash more often                                                           savings holds strong
                                                                                  • Decreasing overall spending
                                                                                     nears the rare 40% territory…
Decrease overall spending


                                   0%   10%      20%      30%   40%   50%


© 2012, Prosper®                                                                Source: BIGinsight™ Monthly Consumer Survey, APR 11-12
Decreasing Overall Spending

                                          45%   Hurricane                                                   $4.50
                                                 Katrina      Summer            Post-Holiday                                                  Highlights:
% Planning to Decrease Overall Spending


                                                             '08 Gas $               '08
                                                                High
                                                                                                            $4.00                              •   Decreasing overall
                                          40%
                                                                                                                                                   spending has only


                                                                                                                    Average $/Gal Gasoline
                                                                                                            $3.50
                                                                                                                                                   approached 40%
                                          35%
                                                                                                            $3.00                                  THREE times in the
                                                                                                                                                   past seven years:
                                                                                                            $2.50
                                          30%                                                                                                       Hurricane Katrina

                                                                                                            $2.00                                   Summer ‘08 Gas
                                          25%                                                                                                         Price Highs
                                                                                                            $1.50
                                                                                                                                                    Post-Holiday ’08
                                                    Plan to Decrease Spending       Ave. Gas Price/Gal
                                          20%                                                               $1.00                              •   Potential Culprits:
                                                  May


                                                  May


                                                  May
                                                Jan-05


                                                  May
                                                  Sep
                                                Jan-06


                                                  May
                                                  Sep
                                                Jan-07


                                                  May
                                                  Sep
                                                Jan-08


                                                  May
                                                  Sep
                                                Jan-09

                                                  Sep
                                                Jan-10

                                                  Sep
                                                Jan-11

                                                  Sep
                                                Jan-12
                                                                                                                                                    Pain at the Pump
                                                                                                                                                    Increasing Prices
                                                                                                                                                    Capitol Hill?
                                                            NEW Blog
                                                            Why are Shoppers so Glum about Spending?
                                                            CLICK to View
                                                                                                    Source: BIGinsight™ Monthly Consumer Survey, JAN-05 - APR-12;
   © 2012, Prosper®
                                                                                                     Energy Information Administration (All Grades, All Formulations)
BIG Forward Look: 90 Day Spending

Over the next 90 days (April, May and June), do you plan on spending more, the same or less
on the following items than you would normally spend at this time of the year?
Adults 18+
                                              Retail Merchandise Categories - 90 Day Outlook
                                                    (Apr-12 compared to Mar-12, Apr-11, and Apr-10)

                   Category:                       Mar-12       Apr-11      Apr-10       Category:                              Mar-12       Apr-11       Apr-10
                   Children’s                        flat         up           up        Toys/Games                              down           up           up

                   Women’s Dress                    down          up           up        CDs/DVDs/Videos/Books                   down           up           flat

                   Women’s Casual                    flat         up           up        Electronics                             down           up           up

                   Men’s Dress                       flat         up           up        Groceries                               down           up         down

                   Men’s Casual                       up          up           up        Home Improvement                        down           up         down

                   Shoes                            down          up           up        Lawn & Garden                           down           up         down

                   HBC                               flat         up           up        Home Furniture                          down           up           up

                   Dining Out                       down          up          down       Home Décor                              down           up           up

                   Sporting Goods                   down          up           flat      Linens/Bedding/Draperies                down           up           up

                     Note: “Up,” Down,” “Flat” refers to the direction of the Diffusion Index compared to the previous month (Mar-12) or years (Apr-11, Apr-10). Diffusion Index = %
                     Spending More - % Spending Less.

© 2012, Prosper®                                                                                                  Source: BIGinsight™ Monthly Consumer Survey, APR 10-12
BIG Forward Look: 90 Day Spending

Over the next 90 days (April, May and June), do you plan on spending more, the same or less
on the following items than you would normally spend at this time of the year?
Adults 18+
                                              Retail Merchandise Categories - 90 Day Outlook
                                                    (Apr-12 compared to Mar-12, Apr-11, and Apr-10)

                   Category:                       Mar-12       Apr-11       All categories
                                                                            Apr-10Category:                                     Mar-12       Apr-11       Apr-10
                   Children’s                        flat         up          up remain
                                                                                  Toys/Games                                     down           up           up

                   Women’s Dress                    down          up          up DOWN
                                                                                  CDs/DVDs/Videos/Books                          down           up           flat

                   Women’s Casual                    flat         up          up  from
                                                                                  Electronics                                    down           up           up

                   Men’s Dress                       flat         up
                                                                             pre-downturn
                                                                              up  Groceries                                      down           up         down
                                                                                April 2007
                   Men’s Casual                       up          up           up        Home Improvement                        down           up         down

                   Shoes                            down          up           up        Lawn & Garden                           down           up         down

                   HBC                               flat         up           up        Home Furniture                          down           up           up

                   Dining Out                       down          up          down       Home Décor                              down           up           up

                   Sporting Goods                   down          up           flat      Linens/Bedding/Draperies                down           up           up

                     Note: “Up,” Down,” “Flat” refers to the direction of the Diffusion Index compared to the previous month (Mar-12) or years (Apr-11, Apr-10). Diffusion Index = %
                     Spending More - % Spending Less.

© 2012, Prosper®                                                                                                  Source: BIGinsight™ Monthly Consumer Survey, APR 10-12
Pain at the Pump

Impacted by Fluctuating Gas Prices vs. Actual Gas Prices
Adults 18+                                                                                                            Apr-12 = 76.3%; $4.00/gal
90.0%                                                                                                         $4.50   Mar-12 = 76.7%; $3.85/gal
                                                                                                                      Apr-11 = 79.3%; $3.74/gal
                                                                                                              $4.00
                     86.0%
85.0%
                                                                                                              $3.50
                          82.2%
80.0%                                                                               79.3%                     $3.00

                                                                                                      76.3%                   Highest Reading:
                                                                                                              $2.50
                                                                                                                               Jun-08 = 86.0%
75.0%
                                                                                                              $2.00
                                                                                                                                  $4.03/gal
        73.3%                              74.0%
                                                                    70.0%
70.0%                                                                                                         $1.50


                                                                                                              $1.00
65.0%
                                                                                                              $0.50


60.0%                                                                                                         $0.00


                   Gas Price (U.S. All Grades Avg for Week)    Adults 18+: Impacted by Gas Prices


© 2012, Prosper®                                   Source: BIGinsight™ Monthly Consumer Survey, APR 07-12; Energy Information Association (eia.doe.gov)
Pain at the Pump

 Driving Less as a Result of Fluctuating Gas Prices vs. Actual Gas Prices
 Adults 18+                                                                                                           Apr-12 = 50.9%; $4.00/gal
                                                                                                                      Mar-12 = 50.9%; $3.85/gal
60.0%                                                                                                         $4.50   Feb-12 = 40.3%; $3.54/gal
                                 57.2%
                                                                                                              $4.00
55.0%
                                                                                                              $3.50
                                                                                                      50.9%             Expected Price by End
50.0%                                                                              49.5%                      $3.00          of Month:
                                                                                                                           Feb-12 = $3.69
                                                                                                              $2.50
                                                                                                                           Mar-12 = $4.08
45.0%                    45.7%
                                                                                                              $2.00
                                                                                                                           Apr-12 = $4.17

40.0%                                                              39.8%                                      $1.50

                                           38.6%                                                              $1.00
        36.7%
35.0%
                                                                                                              $0.50


30.0%                                                                                                         $0.00


                    Gas Price (U.S. All Grades Avg for Week)      Adults 18+: Driving Less Often


 © 2012, Prosper®                                  Source: BIGinsight™ Monthly Consumer Survey, APR 07-12; Energy Information Association (eia.doe.gov)
Pain at the Pump

Expect Gas Prices to be MORE by the End of the Month
Adults 18+


                   90.0%
                           81.8%
                                                                                                                 76.9%
                   80.0%           74.2%                                                                                 74.2%

                   70.0%                                                                                 63.3%
                                                                                                 61.3%
                   60.0%
                                                           51.3%
                   50.0%                   45.7%                   46.1%           45.9% 45.0%

                   40.0%                           34.8%
                                                                           32.9%

                   30.0%

                   20.0%

                   10.0%

                    0.0%


© 2012, Prosper®                                                                            Source: BIGinsight™ Monthly Consumer Survey, APR 11-12
Pain at the Pump

Changes in Fill-Up Habits as a Result of Fluctuating Gas Prices
Adults 18+


                                                              Filling up as soon as I
             Filling up less often                            see prices drop even
              by letting my tank                                if I don’t need gas
             run close to Empty
                                                                      29.1%
                   36.7%


                                     Filling up more often
                                     so that the cost isn’t
                                      as high each time I
                                         go to the pump
                                              23.3%


© 2012, Prosper®                                                        Source: American Pulse™ Survey, April 2012 #1
Pain at the Pump

Are you spending less on groceries because of gas prices in any of the following ways?
Top Responses for Adults 18+

                                 47.6%
                   50.0%                       44.3%
                   45.0%                                      38.7%
                   40.0%                                                    35.2%           35.1%
                   35.0%                                                                                    30.6%          29.4%
                   30.0%
                   25.0%
                   20.0%
                   15.0%
                   10.0%
                    5.0%
                    0.0%
                               Using         Only        Buying more   Switching to   Making a list   Stocking up      Shopping at
                           coupons more purchasing       store brand     different      and only      on products       discount
                               often    the products I   and generic      brands       buying the     so that I can   grocers more
                                           need (no       products     because they   products on       shop less         often
                                           impulse                      are cheaper     that list      frequently
                                          purchases)                     or on sale


© 2012, Prosper®                                                                                           Source: American Pulse™ Survey, April 2012 #1
Pain at the Pump

Are you spending less on clothing/shoes/accessories because of gas prices in any of the
following ways?
Top Responses for Adults 18+
                                    39.8%
                                                    38.0%
                   40.0%
                                                                      33.4%
                   35.0%                                                                 30.3%

                   30.0%
                                                                                                            24.2%
                   25.0%

                   20.0%

                   15.0%                                                                                                       11.9%

                   10.0%

                    5.0%

                    0.0%
                             Only buying      Shopping less     Shopping at         Making           Shopping at         Only buying
                           clothing, shoes,    frequently     discount stores   clothing, shoes,    malls less often   clothing, shoes,
                           and accessories                      more often      and accessories                        and accessories
                               on sale                                          a smaller part of                       when I have a
                                                                                   my budget                               coupon

© 2012, Prosper®                                                                                                 Source: American Pulse™ Survey, April 2012 #1
Pain at the Pump

Using Smartphone Apps to Research Gas Prices
Top Responses for Adults 18+

                                                                 NEW! Pain at the Pump:
                                                                   Running on Empty
                                  20.1%
   34.9%
                                               Yes
                                                                     Read the Blog


                                               No


                                               I do not have a
                                               Smartphone


                               45.0%


© 2012, Prosper®                                                   Source: American Pulse™ Survey, April 2012 #1
BIG Consumer
                           Pain at the Pump: Running on Empty view

                           The Price of a Woman’s Face view
                Blog
                           Why Are Shoppers So Glum About Spending? view

                           Consumer Buzz: Women’s Clothing view

                           Battle of the Sexes: Keeping Up with the (Mobile)
                           Joneses view

                           Generation Gap: Webaholics Anonymous       view


                           Up, Up, and Away: Consumers Talk Rising Prices view

                           Easter Will Be Hoppin’ for Parents this Year view

© 2012, Prosper®
Contact   400 W. Wilson Bridge Road
                             Suite 200
                             Worthington, OH 43085
                             Ph: 614-846-0146
                             info@BIGinsight.com
                             for complimentary insights, visit:
                             www.BIGinsight.com


© 2012, Prosper®

BIG Call - April 2012

  • 1.
    The BIG Call April 2012 PA M E L A G O O D F E L L O W CONSUMER INSIGHTS DIRECTOR, BIGINSIGHT™ S TA C I E S E V E R S CLIENT SERVICES MANAGER, BIGINSIGHT™ 400 W. Wilson Bridge Road, Suite 200, Worthington, OH, 43085 614-846-0146 info@BIGinsight.com
  • 2.
    April 2012 ConsumerSurvey  April 2012 Results • Consumer Confidence • Employment Outlook • Practical Purchasing • Financial Forecast  Decreasing Overall Spending • 90 Day Outlook: Future Purchase Plans  Pain at the Pump This report is derived from the following studies: • BIGinsight™ Monthly Consumer Survey, April 2012 (N = 8724, respondents surveyed 4/3 – 4/10/12) • BIGinsight™ Monthly Consumer Survey Trends, April 2007 – April 2012 Disclaimer: BIGinsight™ is a trademark of Prosper Business Development Corp. Services are delivered by Prosper and/or a Prosper affiliated company (“Prosper”). Prosper makes no warranties, either expressed or implied, concerning: data gathered or obtained from any source; the present or future methodology employed in producing the statistics; or the data and estimates represent only the opinion of Prosper and reliance thereon and use thereof shall be at the user’s own risk. © 2012, Prosper®
  • 3.
    Consumer Confidence Confident/Very Confidentin Chances for a Strong Economy Adults 18+ 40%  Highlights: 34.8% 35% • Springing sentiment stalls in April 34.7%  Ends five month streak of continuous improvement 30% • Remains elevated from Apr-11 28.6% 25% • Falls well below pre-downturn Apr-07 (46.5%) 20% 20.6% 15% © 2012, Prosper® Source: BIGinsight™ Monthly Consumer Survey, APR 11-12
  • 4.
    Consumer Confidence Confident/Very Confidentin Chances for a Strong Economy 25% Adults 18+ decline 40% 50% from Apr-07 45% 34.8% 35% 40% 34.7% 35% 30% 30% 28.6% 25% 25% 20% 15% 20% 10% 20.6% 46.5% 34.7% 5% 15% 0% Apr-07 Apr-08 Apr-09 Apr-10 Apr-11 Mar-12 Apr-12 © 2012, Prosper® Source: BIGinsight™ Monthly Consumer Survey, APR 07-12
  • 5.
    Employment Outlook Regarding the U.S. employment environment, over the next 6 months, do you think that there will be more, the same, or fewer layoffs than at present? Adults 18+  Highlights: More Same Fewer U.S. Unemployment Rate* • One in four expecting “more” 100% 10.0% layoffs over the next six months 90% 9.8%  Slightly lower compared to 9.8%* 19.8% 80% 23.8% 22.9% 22.3% 9.6% Apr-11 and Apr-10 U.S. Unemployment Rate* 70% 9.4% • Those calling for “fewer” Layoff Predictions remains stagnant 60% 9.2%  Optimism fails to appear 50% 9.0% even as Unemployment 40% 8.9% 8.8% Rate declines 30% 48.6% 51.7% 8.6% • Employment mantra = more of 53.2% 53.7% the “same.” 20% 8.4% • Security among the employed 10% 8.3% 8.2% 8.2%  Just 3.1% fear becoming 27.6% 28.5% 23.9% 24.0% 0% 8.0% laid off Apr-10 Apr-11 Mar-12 Apr-12 * U.S. Unemployment Rate for the previous month for each corresponding MMM-YY, as reported by the U.S. Bureau of Labor Statistics. © 2012, Prosper® Source: BIGinsight™ Monthly Consumer Survey, APR 10-12
  • 6.
    Practical Purchasing In thelast 6 months, have you made any of the following changes? Adults 18+ 60%  Highlights: 58% • Practicality remains priority 56% for majority 54% 52%  Slipped from March, but 50% remains elevated from 48% Apr-10, Apr-11 46% • 58.6% are focused on 44% necessities 42%  In range of recession-era 40% Apr-09 (59.5%) and Apr- 10 (59.4%) I have become more practical and realistic in my purchases I focus more on what I NEED rather than what I WANT © 2012, Prosper® Source: BIGinsight™ Monthly Consumer Survey, APR 11-12
  • 7.
    Financial Forecast Which ofthe following financial steps are you planning to take in the next 3 months? Adults 18+ Apr-11 Mar-12 Apr-12  Highlights: • Summer sales drought? Pay down debt  Financial plans become more conservative compared to Apr-11 Increase savings • Paying down debt takes backseat to decreasing spending, while increasing Pay with cash more often savings holds strong • Decreasing overall spending nears the rare 40% territory… Decrease overall spending 0% 10% 20% 30% 40% 50% © 2012, Prosper® Source: BIGinsight™ Monthly Consumer Survey, APR 11-12
  • 8.
    Decreasing Overall Spending 45% Hurricane $4.50 Katrina Summer Post-Holiday  Highlights: % Planning to Decrease Overall Spending '08 Gas $ '08 High $4.00 • Decreasing overall 40% spending has only Average $/Gal Gasoline $3.50 approached 40% 35% $3.00 THREE times in the past seven years: $2.50 30%  Hurricane Katrina $2.00  Summer ‘08 Gas 25% Price Highs $1.50  Post-Holiday ’08 Plan to Decrease Spending Ave. Gas Price/Gal 20% $1.00 • Potential Culprits: May May May Jan-05 May Sep Jan-06 May Sep Jan-07 May Sep Jan-08 May Sep Jan-09 Sep Jan-10 Sep Jan-11 Sep Jan-12  Pain at the Pump  Increasing Prices  Capitol Hill? NEW Blog Why are Shoppers so Glum about Spending? CLICK to View Source: BIGinsight™ Monthly Consumer Survey, JAN-05 - APR-12; © 2012, Prosper® Energy Information Administration (All Grades, All Formulations)
  • 9.
    BIG Forward Look:90 Day Spending Over the next 90 days (April, May and June), do you plan on spending more, the same or less on the following items than you would normally spend at this time of the year? Adults 18+ Retail Merchandise Categories - 90 Day Outlook (Apr-12 compared to Mar-12, Apr-11, and Apr-10) Category: Mar-12 Apr-11 Apr-10 Category: Mar-12 Apr-11 Apr-10 Children’s flat up up Toys/Games down up up Women’s Dress down up up CDs/DVDs/Videos/Books down up flat Women’s Casual flat up up Electronics down up up Men’s Dress flat up up Groceries down up down Men’s Casual up up up Home Improvement down up down Shoes down up up Lawn & Garden down up down HBC flat up up Home Furniture down up up Dining Out down up down Home Décor down up up Sporting Goods down up flat Linens/Bedding/Draperies down up up Note: “Up,” Down,” “Flat” refers to the direction of the Diffusion Index compared to the previous month (Mar-12) or years (Apr-11, Apr-10). Diffusion Index = % Spending More - % Spending Less. © 2012, Prosper® Source: BIGinsight™ Monthly Consumer Survey, APR 10-12
  • 10.
    BIG Forward Look:90 Day Spending Over the next 90 days (April, May and June), do you plan on spending more, the same or less on the following items than you would normally spend at this time of the year? Adults 18+ Retail Merchandise Categories - 90 Day Outlook (Apr-12 compared to Mar-12, Apr-11, and Apr-10) Category: Mar-12 Apr-11 All categories Apr-10Category: Mar-12 Apr-11 Apr-10 Children’s flat up up remain Toys/Games down up up Women’s Dress down up up DOWN CDs/DVDs/Videos/Books down up flat Women’s Casual flat up up from Electronics down up up Men’s Dress flat up pre-downturn up Groceries down up down April 2007 Men’s Casual up up up Home Improvement down up down Shoes down up up Lawn & Garden down up down HBC flat up up Home Furniture down up up Dining Out down up down Home Décor down up up Sporting Goods down up flat Linens/Bedding/Draperies down up up Note: “Up,” Down,” “Flat” refers to the direction of the Diffusion Index compared to the previous month (Mar-12) or years (Apr-11, Apr-10). Diffusion Index = % Spending More - % Spending Less. © 2012, Prosper® Source: BIGinsight™ Monthly Consumer Survey, APR 10-12
  • 11.
    Pain at thePump Impacted by Fluctuating Gas Prices vs. Actual Gas Prices Adults 18+ Apr-12 = 76.3%; $4.00/gal 90.0% $4.50 Mar-12 = 76.7%; $3.85/gal Apr-11 = 79.3%; $3.74/gal $4.00 86.0% 85.0% $3.50 82.2% 80.0% 79.3% $3.00 76.3% Highest Reading: $2.50 Jun-08 = 86.0% 75.0% $2.00 $4.03/gal 73.3% 74.0% 70.0% 70.0% $1.50 $1.00 65.0% $0.50 60.0% $0.00 Gas Price (U.S. All Grades Avg for Week) Adults 18+: Impacted by Gas Prices © 2012, Prosper® Source: BIGinsight™ Monthly Consumer Survey, APR 07-12; Energy Information Association (eia.doe.gov)
  • 12.
    Pain at thePump Driving Less as a Result of Fluctuating Gas Prices vs. Actual Gas Prices Adults 18+ Apr-12 = 50.9%; $4.00/gal Mar-12 = 50.9%; $3.85/gal 60.0% $4.50 Feb-12 = 40.3%; $3.54/gal 57.2% $4.00 55.0% $3.50 50.9% Expected Price by End 50.0% 49.5% $3.00 of Month: Feb-12 = $3.69 $2.50 Mar-12 = $4.08 45.0% 45.7% $2.00 Apr-12 = $4.17 40.0% 39.8% $1.50 38.6% $1.00 36.7% 35.0% $0.50 30.0% $0.00 Gas Price (U.S. All Grades Avg for Week) Adults 18+: Driving Less Often © 2012, Prosper® Source: BIGinsight™ Monthly Consumer Survey, APR 07-12; Energy Information Association (eia.doe.gov)
  • 13.
    Pain at thePump Expect Gas Prices to be MORE by the End of the Month Adults 18+ 90.0% 81.8% 76.9% 80.0% 74.2% 74.2% 70.0% 63.3% 61.3% 60.0% 51.3% 50.0% 45.7% 46.1% 45.9% 45.0% 40.0% 34.8% 32.9% 30.0% 20.0% 10.0% 0.0% © 2012, Prosper® Source: BIGinsight™ Monthly Consumer Survey, APR 11-12
  • 14.
    Pain at thePump Changes in Fill-Up Habits as a Result of Fluctuating Gas Prices Adults 18+ Filling up as soon as I Filling up less often see prices drop even by letting my tank if I don’t need gas run close to Empty 29.1% 36.7% Filling up more often so that the cost isn’t as high each time I go to the pump 23.3% © 2012, Prosper® Source: American Pulse™ Survey, April 2012 #1
  • 15.
    Pain at thePump Are you spending less on groceries because of gas prices in any of the following ways? Top Responses for Adults 18+ 47.6% 50.0% 44.3% 45.0% 38.7% 40.0% 35.2% 35.1% 35.0% 30.6% 29.4% 30.0% 25.0% 20.0% 15.0% 10.0% 5.0% 0.0% Using Only Buying more Switching to Making a list Stocking up Shopping at coupons more purchasing store brand different and only on products discount often the products I and generic brands buying the so that I can grocers more need (no products because they products on shop less often impulse are cheaper that list frequently purchases) or on sale © 2012, Prosper® Source: American Pulse™ Survey, April 2012 #1
  • 16.
    Pain at thePump Are you spending less on clothing/shoes/accessories because of gas prices in any of the following ways? Top Responses for Adults 18+ 39.8% 38.0% 40.0% 33.4% 35.0% 30.3% 30.0% 24.2% 25.0% 20.0% 15.0% 11.9% 10.0% 5.0% 0.0% Only buying Shopping less Shopping at Making Shopping at Only buying clothing, shoes, frequently discount stores clothing, shoes, malls less often clothing, shoes, and accessories more often and accessories and accessories on sale a smaller part of when I have a my budget coupon © 2012, Prosper® Source: American Pulse™ Survey, April 2012 #1
  • 17.
    Pain at thePump Using Smartphone Apps to Research Gas Prices Top Responses for Adults 18+ NEW! Pain at the Pump: Running on Empty 20.1% 34.9% Yes Read the Blog No I do not have a Smartphone 45.0% © 2012, Prosper® Source: American Pulse™ Survey, April 2012 #1
  • 18.
    BIG Consumer Pain at the Pump: Running on Empty view The Price of a Woman’s Face view Blog Why Are Shoppers So Glum About Spending? view Consumer Buzz: Women’s Clothing view Battle of the Sexes: Keeping Up with the (Mobile) Joneses view Generation Gap: Webaholics Anonymous view Up, Up, and Away: Consumers Talk Rising Prices view Easter Will Be Hoppin’ for Parents this Year view © 2012, Prosper®
  • 19.
    Contact 400 W. Wilson Bridge Road Suite 200 Worthington, OH 43085 Ph: 614-846-0146 info@BIGinsight.com for complimentary insights, visit: www.BIGinsight.com © 2012, Prosper®