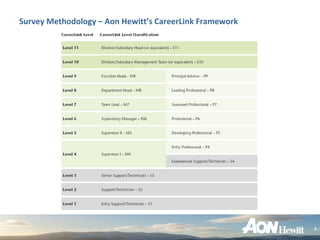
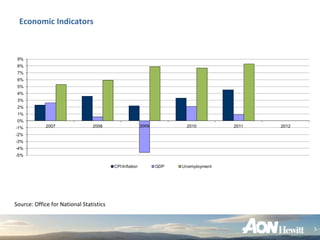
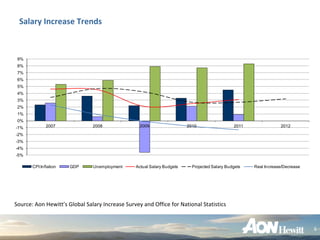
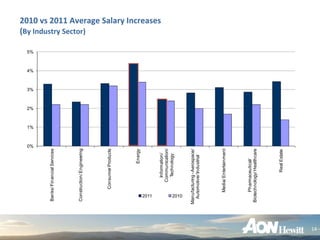
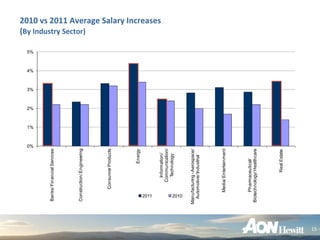
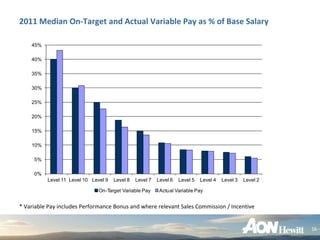
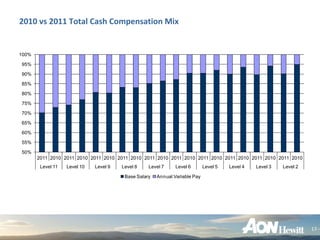
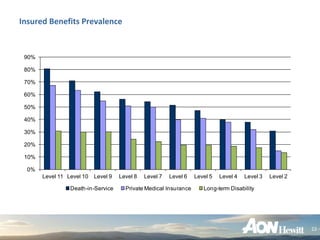
Employee Remuneration Trends in 2011/12
Aon Hewitt | United Kingdom
Aon Hewitt Speakers


Andrew MacLeod                             John Puddephatt
EMEA Reward Data Services Leader           Principal Benefits Consultant
Tel: +44 (0)207 086 9181                   Tel: +44 (0)788 940 6624


Cheryl Hinman                              Nishant Mahajan
Senior Executive Compensation Consultant   Market Intelligence Expert
Tel: +44 (0)207 086 9138                   Tel: +44 (0)207 086 9184


Nikki Severs
Senior Global Rewards Consultant
Tel: +44 (0)117 900 4435


                                                                           2
Agenda

• Aon Hewitt Total Reward Survey Methodology

• Key Economic Indicators

• Salary Increases & Budgets

• Bonus Awards

• Long-Term Incentive Trends

• Employee Benefits

• 2012 Reward Outlook

• Aon Hewitt 2012 Survey Calendar


                                               3
Survey Methodology – Aon Hewitt’s CareerLink Framework


                                                         4
Economic Indicators


 9%
 8%
 7%
 6%
 5%
 4%
 3%
 2%
 1%
 0%
-1%          2007               2008                     2009          2010          2011   2012

-2%
-3%
-4%
-5%

                                         CPI Inflation          GDP   Unemployment


Source: Office for National Statistics


                                                                                                   5
Salary Increase Trends


 9%
 8%
 7%
 6%
 5%
 4%
 3%
 2%
 1%
 0%
-1%           2007             2008               2009                  2010                  2011               2012

-2%
-3%
-4%
-5%

       CPI Inflation   GDP     Unemployment     Actual Salary Budgets     Projected Salary Budgets   Real Increase/Decrease


Source: Aon Hewitt’s Global Salary Increase Survey and Office for National Statistics


                                                                                                                              6
Salary Increase Trends


 9%
 8%
 7%
 6%
 5%
 4%
 3%
 2%
 1%
 0%
-1%           2007             2008               2009                  2010                  2011               2012

-2%
-3%
-4%
-5%

       CPI Inflation   GDP     Unemployment     Actual Salary Budgets     Projected Salary Budgets   Real Increase/Decrease


Source: Aon Hewitt’s Global Salary Increase Survey and Office for National Statistics


                                                                                                                              7
Salary Increase Trends


 9%
 8%
 7%
 6%
 5%
 4%
 3%
 2%
 1%
 0%
-1%           2007             2008               2009                  2010                  2011               2012

-2%
-3%
-4%
-5%

       CPI Inflation   GDP     Unemployment     Actual Salary Budgets     Projected Salary Budgets   Real Increase/Decrease


Source: Aon Hewitt’s Global Salary Increase Survey and Office for National Statistics


                                                                                                                              8
Salary Increase Trends


 9%
 8%
 7%
 6%
 5%
 4%
 3%
 2%
 1%
 0%
-1%           2007             2008               2009                  2010                  2011               2012

-2%
-3%
-4%
-5%

       CPI Inflation   GDP     Unemployment     Actual Salary Budgets     Projected Salary Budgets   Real Increase/Decrease


Source: Aon Hewitt’s Global Salary Increase Survey and Office for National Statistics


                                                                                                                              9
Key Engagement Drivers – Reward is Vital

               Driver Name                        Global *           Asia-Pacific              Europe            Latin America   North America
   Career Opportunities                                1                    1                     1                      1            1

   Brand Alignment                                     2                    2                     3                      3            4

   Recognition                                         3                    3                     5                      2            5

   People/HR Practices                                 4                    5                     2

   Organisation Reputation                             5                                                                              3

   Managing Performance                                                                                                               2

   Pay                                                                      4                     4                      4

   Valuing People/ People Focus                                                                                          5


   * Ranking of drivers based on percentage of time the driver appear as one of top 3 opportunity areas in the organisation


Source: Aon Hewitt Global Employee Engagement Database


                                                                                                                                                 10
Base Salary Increases from 2010 to 2011
(Constant Incumbent & Constant Company Comparison)

 7%


 6%


 5%


 4%


 3%


 2%


 1%


 0%
      Level 11 Level 10 Level 9   Level 8   Level 7   Level 6   Level 5   Level 4   Level 3   Level 2   Level 1


                           Lower Quartile         Median          Upper Quartile


                                                                                                                  11
0%
                                          1%
                                               2%
                                                    3%
                                                         4%
                                                              5%


      Banks/ Financial Services


      Construction/ Engineering
                                                                   (By Industry Sector)


               Consumer Products


                           Energy


       2011
                                                                   2010 vs 2011 Average Salary Increases


                   Information/
                  Communication/
                    Technology

       2010

     Manufacturing - Aerospace/
       Automotive/ Industrial


              Media/ Entertainment


          Pharmaceutical/
     Biotechnology/ Healthcare


                       Real Estate
12
0%
                                          1%
                                               2%
                                                    3%
                                                         4%
                                                              5%


      Banks/ Financial Services


      Construction/ Engineering
                                                                   (By Industry Sector)


               Consumer Products


                           Energy


       2011
                                                                   2010 vs 2011 Average Salary Increases


                   Information/
                  Communication/
                    Technology

       2010

     Manufacturing - Aerospace/
       Automotive/ Industrial


              Media/ Entertainment


          Pharmaceutical/
     Biotechnology/ Healthcare


                       Real Estate
13
0%
                                          1%
                                               2%
                                                    3%
                                                         4%
                                                              5%


      Banks/ Financial Services


      Construction/ Engineering
                                                                   (By Industry Sector)


               Consumer Products


                           Energy


       2011
                                                                   2010 vs 2011 Average Salary Increases


                   Information/
                  Communication/
                    Technology

       2010

     Manufacturing - Aerospace/
       Automotive/ Industrial


              Media/ Entertainment


          Pharmaceutical/
     Biotechnology/ Healthcare


                       Real Estate
14
0%
                                          1%
                                               2%
                                                    3%
                                                         4%
                                                              5%


      Banks/ Financial Services


      Construction/ Engineering
                                                                   (By Industry Sector)


               Consumer Products


                           Energy


       2011
                                                                   2010 vs 2011 Average Salary Increases


                   Information/
                  Communication/
                    Technology

       2010

     Manufacturing - Aerospace/
       Automotive/ Industrial


              Media/ Entertainment


          Pharmaceutical/
     Biotechnology/ Healthcare


                       Real Estate
15
2011 Median On‐Target and Actual Variable Pay as % of Base Salary

    45%

    40%

    35%

    30%

    25%

    20%

    15%

    10%

     5%

     0%
          Level 11 Level 10 Level 9   Level 8   Level 7   Level 6   Level 5   Level 4   Level 3   Level 2

                               On-Target Variable Pay      Actual Variable Pay


* Variable Pay includes Performance Bonus and where relevant Sales Commission / Incentive


                                                                                                            16
2010 vs 2011 Total Cash Compensation Mix


100%

95%

90%

85%

80%

75%

70%

65%

60%

55%

50%
       2011 2010 2011 2010 2011 2010 2011 2010 2011 2010 2011 2010 2011 2010 2011 2010 2011 2010 2011 2010
        Level 11   Level 10   Level 9   Level 8    Level 7     Level 6       Level 5   Level 4   Level 3   Level 2

                                         Base Salary   Annual Variable Pay


                                                                                                                     17
2010 vs 2011 Median Long‐Term Incentives % of Base Salary


   30%


   25%


   20%


   15%


   10%


    5%


    0%
          Level 11    Level 10        Level 9   Level 8     Level 7
                                 2011    2010


                                                                      18
Top Three Reasons for Providing a Benefits Programme


                   Attract talent


                   Retain talent


             Meet market norms


      Productivity & engagement


               Create alignment


                  Control costs


                                    0%         10%   20%   30%   40%   50%      60%      70%       80%

                               1st       2nd   3rd                           Number of responses 185


Source: Aon Hewitt Benefits and Trends Survey 2011


                                                                                                         19
Status of Salary Sacrifice and Flexible Benefits Schemes


                   Introduced


         Decided to introduce


      Decided not to introduce


   Not considering introducing


                                 0%       10%       20%   30%    40%   50%   60%    70%     80%      90%

                                      Salary sacrifice    Flex                 Number of responses 100


Source: Aon Hewitt Benefits and Trends Survey 2011


                                                                                                           20
Satisfaction with Flexible Benefits Schemes

                      Changes to pension scheme

                            Competitive pressures

                      Diverse needs of employees

          Inconsistent compensation arrangements

                            Organisational change

                            Retention, recruitment

                            Tax and NI efficiencies

To improve employee understanding of total rewards

                To increase employee engagement

       Increase employee satisfaction with benefits

           Introduce / extend employee self service

                                                      0%     10%   20%       30%    40%      50%   60%   70%   80%     90%    100%


                               Very satisfied    Satisfied    Dissatisfied   Very dissatisfied            Number of responses 52


Source: Aon Hewitt Benefits and Trends Survey 2011


                                                                                                                                     21
Insured Benefits Prevalence


 90%

 80%

 70%

 60%

 50%

 40%

 30%

 20%

 10%

  0%
       Level 11 Level 10   Level 9   Level 8   Level 7   Level 6   Level 5   Level 4   Level 3   Level 2

                 Death-in-Service      Private Medical Insurance      Long-term Disability


                                                                                                           22
2012 ‐ Organisations Have More Reward Options Than They Think

Use budgets wisely
– Differentiate to recognise high performers and ensure alignment with business needs
– Bring the meaning back to variable pay
– Optimise benefits programmes for both employers and employees


Be fair in pay programmes
– Ensure fairness and transparency
– Benchmark to ensure competitiveness


Be creative in what you offer and how you communicate it
– Focus on all elements of the package including benefits
– Communicate and educate employees on the value of their deal
– Understand the critical role of the line manager
– Listen to employee needs and measure impact


                                                                                        23
Aon Hewitt’s 2012 Survey Calendar

Total Reward Survey (TRS) and Executive Total Reward Survey (ETRS)
• Data collection period : April – July
• Reports available: September – October

Benefits & Trends Survey
• Data collection period : July – September
• Reports available: December – January

Sales Incentive Survey
• Data collection period : March – May
• Reports available: July – August


We also have three specialist divisions within Aon Hewitt:

• Radford - specialist compensation and benefits data within the Hi-Tech / Life-sciences sector
• McLagan - specialist compensation and benefits data within the Financial Services sector
• New Bridge Street - executive remuneration data and consulting


                                                                                                  24
Sharing our thought leadership with clients

•   Aon Hewitt makes a significant ongoing investment in reward, performance, talent and
    employee engagement research. We regularly publish research reports, white papers and
    articles that we make available to our clients.

•   Our compensation database covers 180 countries, over 680 globally consistent benchmark
    positions and over 6 million incumbents. That’s more than any other compensation data
    provider worldwide.

•   Below are some of the recent reward research reports we have published. Please click on the
    images to read more.


                                                                                                  25
Aon Hewitt Global Footprint


                              26
Copyright © 2012 Aon Hewitt Limited. All rights reserved.
Aon Hewitt Limited, 8 Devonshire Square, London EC2M 4PL. Registered in England No. 4396810

To protect the confidential and proprietary information included in this material, it may not be disclosed or provided to any third parties without the prior written
consent of Aon Hewitt Limited.

Aon Hewitt Limited does not accept or assume any responsibility for any consequences arising from any person, other than the intended recipient, using or relying
on this material.


                                                                                                                                                                        27

Reward trends - Aon Hewitt

  • 1.
    Employee Remuneration Trendsin 2011/12 Aon Hewitt | United Kingdom
  • 2.
    Aon Hewitt Speakers Andrew MacLeod John Puddephatt EMEA Reward Data Services Leader Principal Benefits Consultant Tel: +44 (0)207 086 9181 Tel: +44 (0)788 940 6624 Cheryl Hinman Nishant Mahajan Senior Executive Compensation Consultant Market Intelligence Expert Tel: +44 (0)207 086 9138 Tel: +44 (0)207 086 9184 Nikki Severs Senior Global Rewards Consultant Tel: +44 (0)117 900 4435 2
  • 3.
    Agenda • Aon HewittTotal Reward Survey Methodology • Key Economic Indicators • Salary Increases & Budgets • Bonus Awards • Long-Term Incentive Trends • Employee Benefits • 2012 Reward Outlook • Aon Hewitt 2012 Survey Calendar 3
  • 4.
  • 5.
    Economic Indicators 9% 8% 7% 6% 5% 4% 3% 2% 1% 0% -1% 2007 2008 2009 2010 2011 2012 -2% -3% -4% -5% CPI Inflation GDP Unemployment Source: Office for National Statistics 5
  • 6.
    Salary Increase Trends 9% 8% 7% 6% 5% 4% 3% 2% 1% 0% -1% 2007 2008 2009 2010 2011 2012 -2% -3% -4% -5% CPI Inflation GDP Unemployment Actual Salary Budgets Projected Salary Budgets Real Increase/Decrease Source: Aon Hewitt’s Global Salary Increase Survey and Office for National Statistics 6
  • 7.
    Salary Increase Trends 9% 8% 7% 6% 5% 4% 3% 2% 1% 0% -1% 2007 2008 2009 2010 2011 2012 -2% -3% -4% -5% CPI Inflation GDP Unemployment Actual Salary Budgets Projected Salary Budgets Real Increase/Decrease Source: Aon Hewitt’s Global Salary Increase Survey and Office for National Statistics 7
  • 8.
    Salary Increase Trends 9% 8% 7% 6% 5% 4% 3% 2% 1% 0% -1% 2007 2008 2009 2010 2011 2012 -2% -3% -4% -5% CPI Inflation GDP Unemployment Actual Salary Budgets Projected Salary Budgets Real Increase/Decrease Source: Aon Hewitt’s Global Salary Increase Survey and Office for National Statistics 8
  • 9.
    Salary Increase Trends 9% 8% 7% 6% 5% 4% 3% 2% 1% 0% -1% 2007 2008 2009 2010 2011 2012 -2% -3% -4% -5% CPI Inflation GDP Unemployment Actual Salary Budgets Projected Salary Budgets Real Increase/Decrease Source: Aon Hewitt’s Global Salary Increase Survey and Office for National Statistics 9
  • 10.
    Key Engagement Drivers – Reward is Vital Driver Name Global * Asia-Pacific Europe Latin America North America Career Opportunities 1 1 1 1 1 Brand Alignment 2 2 3 3 4 Recognition 3 3 5 2 5 People/HR Practices 4 5 2 Organisation Reputation 5 3 Managing Performance 2 Pay 4 4 4 Valuing People/ People Focus 5 * Ranking of drivers based on percentage of time the driver appear as one of top 3 opportunity areas in the organisation Source: Aon Hewitt Global Employee Engagement Database 10
  • 11.
    Base Salary Increases from 2010 to 2011 (Constant Incumbent & Constant Company Comparison) 7% 6% 5% 4% 3% 2% 1% 0% Level 11 Level 10 Level 9 Level 8 Level 7 Level 6 Level 5 Level 4 Level 3 Level 2 Level 1 Lower Quartile Median Upper Quartile 11
  • 12.
    0% 1% 2% 3% 4% 5% Banks/ Financial Services Construction/ Engineering (By Industry Sector) Consumer Products Energy 2011 2010 vs 2011 Average Salary Increases Information/ Communication/ Technology 2010 Manufacturing - Aerospace/ Automotive/ Industrial Media/ Entertainment Pharmaceutical/ Biotechnology/ Healthcare Real Estate 12
  • 13.
    0% 1% 2% 3% 4% 5% Banks/ Financial Services Construction/ Engineering (By Industry Sector) Consumer Products Energy 2011 2010 vs 2011 Average Salary Increases Information/ Communication/ Technology 2010 Manufacturing - Aerospace/ Automotive/ Industrial Media/ Entertainment Pharmaceutical/ Biotechnology/ Healthcare Real Estate 13
  • 14.
    0% 1% 2% 3% 4% 5% Banks/ Financial Services Construction/ Engineering (By Industry Sector) Consumer Products Energy 2011 2010 vs 2011 Average Salary Increases Information/ Communication/ Technology 2010 Manufacturing - Aerospace/ Automotive/ Industrial Media/ Entertainment Pharmaceutical/ Biotechnology/ Healthcare Real Estate 14
  • 15.
    0% 1% 2% 3% 4% 5% Banks/ Financial Services Construction/ Engineering (By Industry Sector) Consumer Products Energy 2011 2010 vs 2011 Average Salary Increases Information/ Communication/ Technology 2010 Manufacturing - Aerospace/ Automotive/ Industrial Media/ Entertainment Pharmaceutical/ Biotechnology/ Healthcare Real Estate 15
  • 16.
    2011 Median On‐Target and Actual Variable Pay as % of Base Salary 45% 40% 35% 30% 25% 20% 15% 10% 5% 0% Level 11 Level 10 Level 9 Level 8 Level 7 Level 6 Level 5 Level 4 Level 3 Level 2 On-Target Variable Pay Actual Variable Pay * Variable Pay includes Performance Bonus and where relevant Sales Commission / Incentive 16
  • 17.
    2010 vs 2011 Total Cash Compensation Mix 100% 95% 90% 85% 80% 75% 70% 65% 60% 55% 50% 2011 2010 2011 2010 2011 2010 2011 2010 2011 2010 2011 2010 2011 2010 2011 2010 2011 2010 2011 2010 Level 11 Level 10 Level 9 Level 8 Level 7 Level 6 Level 5 Level 4 Level 3 Level 2 Base Salary Annual Variable Pay 17
  • 18.
    2010 vs 2011 Median Long‐Term Incentives % of Base Salary 30% 25% 20% 15% 10% 5% 0% Level 11 Level 10 Level 9 Level 8 Level 7 2011 2010 18
  • 19.
    Top Three Reasons for Providing a Benefits Programme Attract talent Retain talent Meet market norms Productivity & engagement Create alignment Control costs 0% 10% 20% 30% 40% 50% 60% 70% 80% 1st 2nd 3rd Number of responses 185 Source: Aon Hewitt Benefits and Trends Survey 2011 19
  • 20.
    Status of Salary Sacrifice and Flexible Benefits Schemes Introduced Decided to introduce Decided not to introduce Not considering introducing 0% 10% 20% 30% 40% 50% 60% 70% 80% 90% Salary sacrifice Flex Number of responses 100 Source: Aon Hewitt Benefits and Trends Survey 2011 20
  • 21.
    Satisfaction with Flexible Benefits Schemes Changes to pension scheme Competitive pressures Diverse needs of employees Inconsistent compensation arrangements Organisational change Retention, recruitment Tax and NI efficiencies To improve employee understanding of total rewards To increase employee engagement Increase employee satisfaction with benefits Introduce / extend employee self service 0% 10% 20% 30% 40% 50% 60% 70% 80% 90% 100% Very satisfied Satisfied Dissatisfied Very dissatisfied Number of responses 52 Source: Aon Hewitt Benefits and Trends Survey 2011 21
  • 22.
    Insured Benefits Prevalence 90% 80% 70% 60% 50% 40% 30% 20% 10% 0% Level 11 Level 10 Level 9 Level 8 Level 7 Level 6 Level 5 Level 4 Level 3 Level 2 Death-in-Service Private Medical Insurance Long-term Disability 22
  • 23.
    2012 ‐ Organisations Have More Reward Options Than They Think Use budgetswisely – Differentiate to recognise high performers and ensure alignment with business needs – Bring the meaning back to variable pay – Optimise benefits programmes for both employers and employees Be fair in pay programmes – Ensure fairness and transparency – Benchmark to ensure competitiveness Be creative in what you offer and how you communicate it – Focus on all elements of the package including benefits – Communicate and educate employees on the value of their deal – Understand the critical role of the line manager – Listen to employee needs and measure impact 23
  • 24.
    Aon Hewitt’s 2012 Survey Calendar Total Reward Survey(TRS) and Executive Total Reward Survey (ETRS) • Data collection period : April – July • Reports available: September – October Benefits & Trends Survey • Data collection period : July – September • Reports available: December – January Sales Incentive Survey • Data collection period : March – May • Reports available: July – August We also have three specialist divisions within Aon Hewitt: • Radford - specialist compensation and benefits data within the Hi-Tech / Life-sciences sector • McLagan - specialist compensation and benefits data within the Financial Services sector • New Bridge Street - executive remuneration data and consulting 24
  • 25.
    Sharing our thought leadership with clients • Aon Hewitt makes a significant ongoing investment in reward, performance, talent and employee engagement research. We regularly publish research reports, white papers and articles that we make available to our clients. • Our compensation database covers 180 countries, over 680 globally consistent benchmark positions and over 6 million incumbents. That’s more than any other compensation data provider worldwide. • Below are some of the recent reward research reports we have published. Please click on the images to read more. 25
  • 26.
  • 27.
    Copyright © 2012Aon Hewitt Limited. All rights reserved. Aon Hewitt Limited, 8 Devonshire Square, London EC2M 4PL. Registered in England No. 4396810 To protect the confidential and proprietary information included in this material, it may not be disclosed or provided to any third parties without the prior written consent of Aon Hewitt Limited. Aon Hewitt Limited does not accept or assume any responsibility for any consequences arising from any person, other than the intended recipient, using or relying on this material. 27