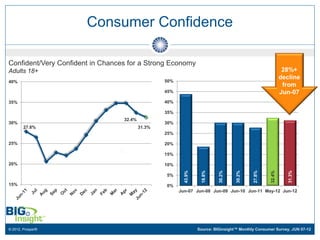
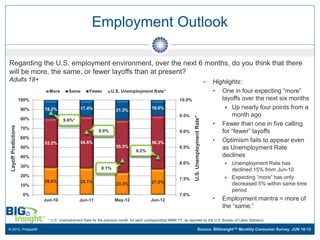
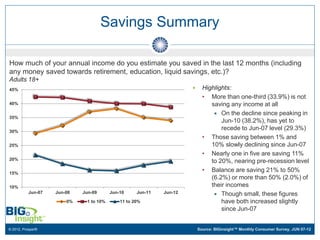
The BIG Call
                           June 2012
                PA M E L A G O O D F E L L O W
      CONSUMER INSIGHTS DIRECTOR, BIGINSIGHT™

                 GUEST CONTRIBUTOR:
JOHN MARIOTTI, PRESIDENT & CEO, THE ENTERPRISE GROUP


       400 W. Wilson Bridge Road, Suite 200, Worthington, OH, 43085   614-846-0146   info@BIGinsight.com
June 2012 Consumer Survey

  June 2012 Results
   • Consumer Confidence
   • Employment Outlook
   • Practical Purchasing
   • Financial Forecast
   • 90 Day Outlook: Future Purchase Plans
   • How is JC Penney’s “Fair & Square” Faring?


                   This report is derived from the following studies:
                   • BIGinsight™ Monthly Consumer Survey, June 2012 (N = 8760, respondents surveyed 6/5 – 6/12/12)
                   • BIGinsight™ Monthly Consumer Survey Trends, June 2007 – June 2012

                   Disclaimer: BIGinsight™ is a trademark of Prosper Business Development Corp. Services are delivered by Prosper and/or a Prosper affiliated company (“Prosper”).
                   Prosper makes no warranties, either expressed or implied, concerning: data gathered or obtained from any source; the present or future methodology employed in
                   producing the statistics; or the data and estimates represent only the opinion of Prosper and reliance thereon and use thereof shall be at the user’s own risk.

© 2012, Prosper®
Consumer Confidence

Confident/Very Confident in Chances for a Strong Economy
Adults 18+                                                                                                    28%+
                                                                                                             decline
40%                                               50%
                                                                                                              from
                                                  45%                                                        Jun-07
35%                                               40%

                                                  35%
                                  32.4%
30%                                               30%
        27.8%                             31.3%
                                                  25%

25%                                               20%

                                                  15%

20%                                               10%


                                                          43.9%


                                                                    18.8%


                                                                            30.2%


                                                                                    30.2%


                                                                                            27.8%


                                                                                                     32.4%


                                                                                                                31.3%
                                                  5%

15%                                               0%
                                                        Jun-07 Jun-08 Jun-09 Jun-10 Jun-11 May-12 Jun-12


© 2012, Prosper®                                                  Source: BIGinsight™ Monthly Consumer Survey, JUN 07-12
Employment Outlook

Regarding the U.S. employment environment, over the next 6 months, do you think that there
will be more, the same, or fewer layoffs than at present?
Adults 18+                                                                                                                                          Highlights:
                               More        Same        Fewer        U.S. Unemployment Rate*                                                          • One in four expecting “more”
                      100%                                                                                   10.0%                                      layoffs over the next six months
                      90%    19.2%                17.4%                                      16.6%                                                        Up nearly four points from a
                                                                       21.3%
                                                                                                             9.5%                                           month ago


                                                                                                                       U.S. Unemployment Rate*
                      80%              9.6%*
                                                                                                                                                     • Fewer than one in five calling
 Layoff Predictions


                      70%
                                                             9.0%                                            9.0%                                       for “fewer” layoffs
                      60%
                             52.2%                54.6%                                      56.3%                                                   • Optimism fails to appear even
                      50%                                              55.5%                                 8.5%                                       as Unemployment Rate
                                                                                   8.2%
                      40%                                                                                                                               declines
                                                                                                             8.0%                                           Unemployment Rate has
                      30%                                     8.1%                                                                                           declined 15% from Jun-10
                      20%                                                                                                                                   Expecting “more” has only
                                                                                                             7.5%
                             28.6%                28.1%                                      27.0%
                      10%                                              23.3%                                                                                 decreased 5% within same time
                                                                                                                                                             period
                       0%                                                                                    7.0%
                             Jun-10              Jun-11               May-12                Jun-12                                                   •   Employment mantra = more of
                                                                                                                                                         the “same.”

                               * U.S. Unemployment Rate for the previous month for each corresponding MMM-YY, as reported by the U.S. Bureau of Labor Statistics.

© 2012, Prosper®                                                                                                                  Source: BIGinsight™ Monthly Consumer Survey, JUN 10-12
Employment Outlook

                   FUD Part I: Fear Uncertainty & Doubt … CONTINUE

                   —Higher Productivity = More Competitive

                   —Fewer People Do More Work = Fewer Jobs

                   —Supply of Workers >> Demand for Employees (4:1)

                   —High Tech/High Skill Jobs go Unfilled, (or in Wrong Locations)

                   —Low Tech/Low Skill Jobs More Numerous (and Low Pay)

                   Creates Downward Pressure on All Wages (Impact on Spending?)


© 2012, Prosper®
Savings Summary

How much of your annual income do you estimate you saved in the last 12 months (including
any money saved towards retirement, education, liquid savings, etc.)?
Adults 18+
45%                                                                         Highlights:
                                                                             • More than one-third (33.9%) is not
40%                                                                             saving any income at all
                                                                                  On the decline since peaking in
35%
                                                                                    Jun-10 (38.2%), has yet to
30%
                                                                                    recede to Jun-07 level (29.3%)
                                                                             • Those saving between 1% and
25%                                                                             10% slowly declining since Jun-07
                                                                             • Nearly one in five are saving 11%
20%
                                                                                to 20%, nearing pre-recession level
15%
                                                                             • Balance are saving 21% to 50%
                                                                                (6.2%) or more than 50% (2.0%) of
10%                                                                             their incomes
           Jun-07   Jun-08   Jun-09       Jun-10     Jun-11   Jun-12              Though small, these figures
                        0%     1 to 10%       11 to 20%                             have both increased slightly
                                                                                    since Jun-07


© 2012, Prosper®                                                           Source: BIGinsight™ Monthly Consumer Survey, JUN 07-12
Savings Summary

              After “FUD” Wears Down Americans…
              …The “Stockholm Syndrome” Grabs Them!
                      (This terms comes from when people held hostage begin to
                      accept and feel better about their captors.)

              When Things Have Been Bad (or Not Good) for So Long, Even a
              Small Change/Improvement Starts to Look Good
                      Example: When job growth is below 125,000 per month, a
                      month or two above 125,000 looks good, but 150,000 new
                      jobs/month are needed to just absorb new workforce entrants,
                      which doesn’t really help unemployment—it just hasn’t gotten
                      any worse.

              BUT—Reality “Bites”—Shows the Improvements Were “Illusory”
                   Take a Look….


© 2012, Prosper®
How is JC Penney’s “Fair & Square” Faring?

Women’s Clothing – Shop Most Often
Adults 18+
                    JC Penney         Macy's
                                                  Highlights:
  11%
                                                   • Traditionally #3 in Women’s
  10%                                                 Clothing, since the launch of
                    "Fair & Square"                   “Fair & Square,” JC Penney has
                     Commences
   9%                                                 fallen to #4, behind Macy’s
                                                   • For more, click over to the
   8%
                                                      BIG Consumer Blog
   7%                                                   Includes 10 year trends for
                                                          Top 5 Women’s Clothing
   6%                                                     retailers (Walmart, Kohl’s,
                                                          Macy’s, JC Penney, Target)
   5%                                                   “Hot or Not?” trended
                                                          graphic for JCP “Fair &
   4%
                                                          Square” (Mar-12 vs. Jun-12)

                                                               NEW Blog
                                                               “Fair & Square” Revisited

© 2012, Prosper®                               Source: BIGinsight™ Monthly Consumer Survey, JUN 11-12
Thank you
                               Thank you for your interest in our
                               June 2012 BIG Call data.

                               CLICK HERE
                               to view the full deck of BIG Call
                               slides for June 2012


© 2012, Prosper®
Contact       400 W. Wilson Bridge Road
                                 Suite 200
                                 Worthington, OH 43085
                                 Ph: 614-846-0146
                                 info@BIGinsight.com
                                 for complimentary insights, visit:
                                 www.BIGinsight.com


                             For more about John Mariotti:
                             http://www.mariotti.net/
                             _


                             and
                             _


                             “Telling It Like It Is” Blog


© 2012, Prosper®

BIG Call June 2012 Sneak Peek

  • 1.
    The BIG Call June 2012 PA M E L A G O O D F E L L O W CONSUMER INSIGHTS DIRECTOR, BIGINSIGHT™ GUEST CONTRIBUTOR: JOHN MARIOTTI, PRESIDENT & CEO, THE ENTERPRISE GROUP 400 W. Wilson Bridge Road, Suite 200, Worthington, OH, 43085 614-846-0146 info@BIGinsight.com
  • 2.
    June 2012 ConsumerSurvey  June 2012 Results • Consumer Confidence • Employment Outlook • Practical Purchasing • Financial Forecast • 90 Day Outlook: Future Purchase Plans • How is JC Penney’s “Fair & Square” Faring? This report is derived from the following studies: • BIGinsight™ Monthly Consumer Survey, June 2012 (N = 8760, respondents surveyed 6/5 – 6/12/12) • BIGinsight™ Monthly Consumer Survey Trends, June 2007 – June 2012 Disclaimer: BIGinsight™ is a trademark of Prosper Business Development Corp. Services are delivered by Prosper and/or a Prosper affiliated company (“Prosper”). Prosper makes no warranties, either expressed or implied, concerning: data gathered or obtained from any source; the present or future methodology employed in producing the statistics; or the data and estimates represent only the opinion of Prosper and reliance thereon and use thereof shall be at the user’s own risk. © 2012, Prosper®
  • 3.
    Consumer Confidence Confident/Very Confidentin Chances for a Strong Economy Adults 18+ 28%+ decline 40% 50% from 45% Jun-07 35% 40% 35% 32.4% 30% 30% 27.8% 31.3% 25% 25% 20% 15% 20% 10% 43.9% 18.8% 30.2% 30.2% 27.8% 32.4% 31.3% 5% 15% 0% Jun-07 Jun-08 Jun-09 Jun-10 Jun-11 May-12 Jun-12 © 2012, Prosper® Source: BIGinsight™ Monthly Consumer Survey, JUN 07-12
  • 4.
    Employment Outlook Regarding theU.S. employment environment, over the next 6 months, do you think that there will be more, the same, or fewer layoffs than at present? Adults 18+  Highlights: More Same Fewer U.S. Unemployment Rate* • One in four expecting “more” 100% 10.0% layoffs over the next six months 90% 19.2% 17.4% 16.6%  Up nearly four points from a 21.3% 9.5% month ago U.S. Unemployment Rate* 80% 9.6%* • Fewer than one in five calling Layoff Predictions 70% 9.0% 9.0% for “fewer” layoffs 60% 52.2% 54.6% 56.3% • Optimism fails to appear even 50% 55.5% 8.5% as Unemployment Rate 8.2% 40% declines 8.0%  Unemployment Rate has 30% 8.1% declined 15% from Jun-10 20%  Expecting “more” has only 7.5% 28.6% 28.1% 27.0% 10% 23.3% decreased 5% within same time period 0% 7.0% Jun-10 Jun-11 May-12 Jun-12 • Employment mantra = more of the “same.” * U.S. Unemployment Rate for the previous month for each corresponding MMM-YY, as reported by the U.S. Bureau of Labor Statistics. © 2012, Prosper® Source: BIGinsight™ Monthly Consumer Survey, JUN 10-12
  • 5.
    Employment Outlook FUD Part I: Fear Uncertainty & Doubt … CONTINUE —Higher Productivity = More Competitive —Fewer People Do More Work = Fewer Jobs —Supply of Workers >> Demand for Employees (4:1) —High Tech/High Skill Jobs go Unfilled, (or in Wrong Locations) —Low Tech/Low Skill Jobs More Numerous (and Low Pay) Creates Downward Pressure on All Wages (Impact on Spending?) © 2012, Prosper®
  • 6.
    Savings Summary How muchof your annual income do you estimate you saved in the last 12 months (including any money saved towards retirement, education, liquid savings, etc.)? Adults 18+ 45%  Highlights: • More than one-third (33.9%) is not 40% saving any income at all  On the decline since peaking in 35% Jun-10 (38.2%), has yet to 30% recede to Jun-07 level (29.3%) • Those saving between 1% and 25% 10% slowly declining since Jun-07 • Nearly one in five are saving 11% 20% to 20%, nearing pre-recession level 15% • Balance are saving 21% to 50% (6.2%) or more than 50% (2.0%) of 10% their incomes Jun-07 Jun-08 Jun-09 Jun-10 Jun-11 Jun-12  Though small, these figures 0% 1 to 10% 11 to 20% have both increased slightly since Jun-07 © 2012, Prosper® Source: BIGinsight™ Monthly Consumer Survey, JUN 07-12
  • 7.
    Savings Summary After “FUD” Wears Down Americans… …The “Stockholm Syndrome” Grabs Them! (This terms comes from when people held hostage begin to accept and feel better about their captors.) When Things Have Been Bad (or Not Good) for So Long, Even a Small Change/Improvement Starts to Look Good Example: When job growth is below 125,000 per month, a month or two above 125,000 looks good, but 150,000 new jobs/month are needed to just absorb new workforce entrants, which doesn’t really help unemployment—it just hasn’t gotten any worse. BUT—Reality “Bites”—Shows the Improvements Were “Illusory” Take a Look…. © 2012, Prosper®
  • 8.
    How is JCPenney’s “Fair & Square” Faring? Women’s Clothing – Shop Most Often Adults 18+ JC Penney Macy's  Highlights: 11% • Traditionally #3 in Women’s 10% Clothing, since the launch of "Fair & Square" “Fair & Square,” JC Penney has Commences 9% fallen to #4, behind Macy’s • For more, click over to the 8% BIG Consumer Blog 7%  Includes 10 year trends for Top 5 Women’s Clothing 6% retailers (Walmart, Kohl’s, Macy’s, JC Penney, Target) 5%  “Hot or Not?” trended graphic for JCP “Fair & 4% Square” (Mar-12 vs. Jun-12) NEW Blog “Fair & Square” Revisited © 2012, Prosper® Source: BIGinsight™ Monthly Consumer Survey, JUN 11-12
  • 9.
    Thank you Thank you for your interest in our June 2012 BIG Call data. CLICK HERE to view the full deck of BIG Call slides for June 2012 © 2012, Prosper®
  • 10.
    Contact 400 W. Wilson Bridge Road Suite 200 Worthington, OH 43085 Ph: 614-846-0146 info@BIGinsight.com for complimentary insights, visit: www.BIGinsight.com For more about John Mariotti: http://www.mariotti.net/ _ and _ “Telling It Like It Is” Blog © 2012, Prosper®