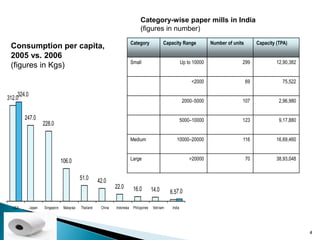
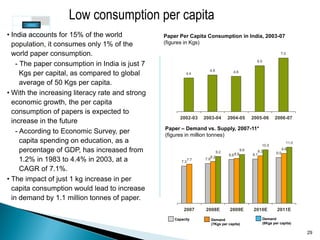
A Review of Indian paper industry
   The global pulp and paper industry consists of
    about 5000 industrial pulp and paper mills,
    and an equal number of very small companies.
   Broadly, the industry can be classified into two
    segments:
   - Paper and paperboard (writing, printing,
    packaging and tissue). The writing and printing
    paper market can be further divided into coated
    and uncoated segments.
   - Newsprint mainly uses for newspapers, flyers,
    and other printed material intended for mass
    distribution


                                                       2
   The US is the largest market for paper product
    and commands high per capita consumption.
   Asia’s main markets are China, Japan, India,
    Malaysia, Singapore and Thailand.
   In 2005, Japan had the highest per capita
    consumption (247 kg), followed by Singapore
    (228 kg), Malaysia (106 kg), Taiwan (51 kg) China
    (42 kg), Indonesia (22 kg) and Philippines (16
    kg).

   India’s per capita consumption is
    estimated to be 7.0 kg in 2006.


                                                        3
Category-wise paper mills in India
                                                                                   (figures in number)
                                                                             Category              Capacity Range             Number of units        Capacity (TPA)
 Consumption per capita,
 2005 vs. 2006
                                                                             Small                              Up to 10000                 299               12,90,382
 (figures in Kgs)
                                                                                                                     <2000                      69              75,522

     324.0
312.0                                                                                                            2000–5000                  107                2,96,980


        247.0                                                                                                   5000–10000                  123                9,17,880
                     228.0

                                                                             Medium                        10000–20000                      116               16,69,460


                                 106.0                                       Large                                  >20000                      70            38,93,048


                                             51.0       42.0
                                                                 22.0         16.0          14.0       6.57.0

  USA        Japan   Singapore    Malaysia   Thailand    China   Indonesia    Philippines   Viet nam    India


                                                                                                                                                                          4
5
   Indian Pulp and Paper has
    shown significant
    improvements.
   There are still many
    challenges & a long way
    to go.
   Capacity utilization of the
    industry is just 79%, due
    to old technology.


                                  6
7
8
India is the 15th largest paper producer in the
world. It provides employment to nearly 1.5
million people and contributes INR25.0 billion
to the government's exchequer. In last 55
years, the number of paper mills has increased
from just 17 mills in 1951 to more than 666
units engaged in the manufacture of paper and
paperboard, out of which nearly 568 are in
operation by 2006.
- 194 mills under purview of Board of
Industrial and Financial Reconstruction (BIFR);
nearly 60 mills with a
       capacity of 1.3 million tonnes is closed.

                                                   9
Indian paper mills are categorised

based on the raw materials -
                                           Recycled
wood/forest based mills, agro-residue       Paper
                                             38%
based mills and wastepaper-based

mills.

-   Due to the increasing regulation and

    raw material prices, the companies

    are increasingly using more non-

    wood based raw material over the

    years. In 2006, around 70 % of the

    total production is based on non-

-              wood raw    material.

                                                      10
11
Due to high growth rate, Indian paper industry is very attractive
                                        for the foreign players
Paper and Paperboard - Production in India, 2002-06
(figures in million tonnes)
                                                                                      • India is self-sufficient in manufacture
                                                     8.1
                                                                 Installed Capacity
                                                                                        of most varieties of paper and
                                                                 Production
                                        7.7
                           7.4
                                                           6.5
                                                                                        paperboards.
 6.2          6.4
                                 5.9          5.9
       5.2
                    5.6                                                                   - Import is mainly related to certain
                                                                                           speciality papers such as light
                                                                                           weight coated variety of paper,
                                                                                           cheque paper, etc.
                                                                                          - Due to the scarcity of raw material,
2002-03      2003-04      2004-05      2005-06      2006-07
                                                                                           the companies also need to rely on
Paper and Paperboard - Import-Export, 2002-06                                              imported wood pulp and waste
(figures in million tonnes)                                           Import
                                                     0.4
                                                                                           paper.
                                                                      Export
              0.3
                                 0.3
                                        0.3 0.3
                                                           0.3
                                                                                      • In last 5 years, capacity was
 0.2
                    0.2                                                                 increased mainly through expansion
                           0.2
       0.2                                                                              and modernisation of the existing
                                                                                        facilities rather than setting up
                                                                                        greenfield projects.
2002-03      2003-04      2004-05      2005-06      2006-07 *


                                                                                                                                   12
•   The per capita consumption of paper in India is
    very low i.e. 7 Kgs in 2006, as compared to an
    average consumption of 28 Kgs and 58 Kgs in
    Asia and world respectively. The per capita
    consumption is expected to increase to 12 Kgs
    by 2020.
•   The domestic paper market is dominated by
    large players owing to their size, brand value
    and financial strength. In 2006-07, the top 10
    players control around 60% of the market in
    term of capacity.

                                                      13
Various macro-economic factors like
• national economic growth,
• industrial production,
• promotional expenditure,
• population growth and the government’s allocations
  for the educational sector influence the demand for
  paper
- The growth in paper consumption is directly related
to GDP growth in the country. In the past, it has shown
the 1:1 relationship with the GDP growth rate.
- With expected GDP growth of 9-9.5%, the demand
for Newsprint and Writing & Printing Paper is expected
to grow at the same rate.
Continued availability of raw materials would be a big
challenge for the industry in the next 5-10 years.


                                                          14
According to the Indian Pulp and Paper
Technical Association (IPPTA), the paper
industry is expected to fall short of demand by
1.1 million tonnes by 2010-11 due to raw
material constraints.
According to ITC’s estimates, the total demand
for paper is around 8.0 million tonnes and is
expected to grow to 10.0 million tonnes by
2012 and 21.0 million tonnes by 2020.
According to Indian Paper Manufacturers
Association (IPMA), consumption of paper in
India is set to double from the current 7.0
million tonnes per annum by 2015.

                                                  15
Demand driven P&P industry will be
stressed by pressures of
• quality,
• availability &
• environmental considerations.
Society, CREP & sustainability issues
will demand a change in the manner
in which industry conducts itself
today

                                        16
   Chip size control
   Dust & sound management
   Raw material cleaning
   Raw material Storage
   Segregation of waste paper


                                 17
   Pulp quality variation: H- Factor Control

   Adoption of modern pulping digesters

   Adoption of Single/two stage oxygen de-

    lignification

   Control of odour in conventional batch

    digester

                                                18
   Elimination of elemental chlorine &
    hypochlorite from bleaching sequence
   Introduction of ECF bleaching
   Introduction of oxygen extraction stage in
    bleaching (several mills don’t have
    this)
   Adoption of enzyme pre-bleaching
   Look at closing bleach filtrate cycles.

                                                 19
 Eliminate DCE for Kraft liquor evaporation (63
   per cent Indian mills have DCEs).
 Introduce concentrators for black liquor
  concentration above 72 per cent
 Look at BL viscosity reduction opportunity
 Put efforts on NPE, silica and scales
   management
 Introduce lime reburning systems


                                                   20
   Indian mills are weak in instrumentation &
    process control. This results in wide
    variations in quality of sectional outputs.
   Variation in quality of inputs,
    poor/inefficient/outdated multiple
    equipments multiplies the challenges.


                                                  21
On an average, recovered energy in
Indian mills meets only 45 per cent of
energy meets of pulp and recovery
section (in good global mills there is
energy excess)


                                         22
• During the previous year, pulp prices went up but
 companies were unable to pass on the full increase to
 buyers. However, most companies raised prices thrice
 this year, to pass on raw material push. They are
 reporting better performance, quarter-on-quarter.
• “ he fact that companies are able to pass on the price
  T
 increase from time to time shows the demand-supply
 gap is narrowing. Companies are also looking at
 another round of price increase.


                                                           23
   The domestic paper industry is estimated at
    around 10 million tonnes yearly. Of this, the
    writing and paper segment accounts for 3.8 mt,
    the packaging grade paper segment is around
    4.5 mt and the newsprint industry about 1.7 m t.
   The domestic yearly per capita consumption of
    paper is only 9.2 kg, much lower than many
    other developing economies. The figure in China
    and Indonesia is estimated at 42 kg and 23 kg,
    respectively. However, all segments of the
    industry are growing at eight to nine per cent or
    above.


                                                        24
   The industry is likely to see supply pressure
    by the end of the year.
   The supply overhang in the paper industry,
    caused by the bunching of new capacities by
    leading companies such as BILT, TNPL and
    West Coast in 2010, seems to be getting
    over.
   After having faced overcapacity last year, the
    industry is likely to see supply pressure by
    the year end.


                                                     25
   There were many capacity additions last year,
    but nobody is carrying stocks or operating at
    a lower capacity. The market is absorbing
    whatever is being produced.
   Demand is expected to exceed supply in
    2012 and 2013,”said A Velliangiri, deputy
    managing director, TNPL, which has writing
    and printing paper capacity of 400,000
    tonnes yearly. Others in the industry echo
    Velliangiri’ view.
               ’s


                                                    26
   Sustained fibre supply-Virgin & Secondary
   Sustained water supply
   Sustained energy supply & quantum
    reduction in specific energy use
   Colour & chloro - organics in wastewater
   Odour & VOC’s in emissions
   Solid wastes management


                                                27
Strong economic growth        Low consumption per capita


                    Indian Paper Industry


Increased government focus on
                                      Printing Industry
          education


                                                             28
Low consumption per capita
• India accounts for 15% of the world            Paper Per Capita Consumption in India, 2003-07
  population, it consumes only 1% of the         (figures in Kgs)

  world paper consumption.                                                                                        7.0

                                                                                                     6.0
    - The paper consumption in India is just 7
                                                                      4.8
      Kgs per capital, as compared to global               4.4                        4.6


      average of 50 Kgs per capita.
• With the increasing literacy rate and strong
  economic growth, the per capita
  consumption of papers is expected to
                                                       2002-03      2003-04        2004-05         2005-06     2006-07
  increase in the future
                                                 Paper – Demand vs. Supply, 2007-11*
    - According to Economic Survey, per          (figures in million tonnes)
      capita spending on education, as a                                                                                11.0
                                                                                                        10.5
      percentage of GDP, has increased from                                  9.2
                                                                                             9.6      9.3       9.0
                                                                                                                      9.8
                                                                                   8.6 8.8         8.7
                                                                       8.2
      1.2% in 1983 to 4.4% in 2003, at a                7.3
                                                              7.7   7.8

      CAGR of 7.1%.
• The impact of just 1 kg increase in per
  capita consumption would lead to increase
  in demand by 1.1 million tonnes of paper.
                                                         2007       2008E          2009E           2010E        2011E

                                                     Capacity          Demand                           Demand
                                                                       (7Kgs per capita)                (8Kgs per capita)

                                                                                                                               29
West Coast Paper Mills (WCPM) has recorded a
88 per cent rise in its net profit at Rs. 28.52
crores in 2000-01 (Rs. 15.20 crores). Sales
and income from operations rose 7 per cent
to Rs. 351.33 crores (Rs. 328.68 crores).
Profits jumped on better realisations coupled
with an increase in demand for paper and
paper board.


                                                  30
• ITC Bhadrachalam Paperboards had expanded
  capacity from 62,500 tpa to 1.82 lakh tpa. Following
  the infusion of around Rs. 150 crores from ITC, the
  company has carved a niche for itself in the export
  market for coated paperboards and specialty paper.
• Tamil Nadu Newsprint (TNPL) boasts of being among
  the most efficient players in the newsprint industry.
  In 2000-01, the company reported sales of Rs.
  596.40 crores and a net profit of Rs. 76.40 crores.
  Promoted jointly by the Tamil Nadu Government and
  IDBI, TNPL manufactures newsprint and
  printing/writing paper with a capacity of 1.8 lakh
  tonnes annually. TNPL uses bagasse as the main
  input. It is now going in for de-bottlenecking to
  enable capacity increase by around 25 per cent.


                                                          31
Ballarpur Industries Limited (BILT) is India's
largest paper company and the only Indian
company to rank amongst the top 100 paper
companies in the world.
BILT, part of the $3 billion Avantha Group, is
India's largest manufacturer and exporter of
paper, with a strong presence in all segments
of the usage spectrum, including writing and
printing paper, industrial paper and specialty
paper.
The company has a diversified production
infrastructure with six manufacturing units
spread across the country.

                                                 32
Ballarpur Industries Limited (BILT)
 The company has 6 units, together with a capacity of 480,000 tonnes and a pulp
  mill of capacity 100,000 tonnes manufacturing rayon grade pulp, in the state of
  Andhra Pradesh (Kamlapuram Unit).
 BILT is expanding its production capacity in both coated and non-coated paper,
  to take it to around 1.0 million tonnes by 2009-10. With the increase in overall
  capacity, the company expects to double its turnover by 2009-10.
   ◦ In October 2007, the company announced to increase the capacity of its
     coated wood free paper unit at Bhigwan in Pune by adding 190,000 tonnes.
     After the expansion, the total unit capacity would increase to 315,000 tonnes.
   ◦ The main plant and machinery and its installation would be supplied by Voith,
     Germany, while some equipment will be sourced locally from suppliers like
     L&T, etc.
 In July 2007, the company also initiated a restructuring plan, under which it
  would transfer 3 manufacturing units at Bhigwan, Ballarpur and Kamalapuram, to
  a separate company called BILT Graphic Paper Products, which would be
  transferred to Ballarpur Paper Holdings BV (BPH) after court approval. By this
  exercise, the company would transfer its commodity business, which is capital-
  intensive and would focus on the speciality and consumer-focused products
  business.


                                                                                      33
Installed Capacity, 2002-06
(Figures in ‘000 tonnes)


                                                480.0       480.0
                                                                 457.5
                                406.6
386.0           386.6                   383.4       407.3
        358.9           369.9


 2002-03        2003-04         2004-05         2005-06     2006-07


Installed Capacity – Paper unit, 2005-06
(Figures in ‘000 tonnes)


                                                                         34
   To choose eco-friendly paper:
    Know
   1. The paper’s fiber source
   2. Chemicals processing
   3. Ability to be recycled or break down in a
    landfill.


                                                   35

India's pulp-paper industry

  • 1.
    A Review ofIndian paper industry
  • 2.
    The global pulp and paper industry consists of about 5000 industrial pulp and paper mills, and an equal number of very small companies.  Broadly, the industry can be classified into two segments:  - Paper and paperboard (writing, printing, packaging and tissue). The writing and printing paper market can be further divided into coated and uncoated segments.  - Newsprint mainly uses for newspapers, flyers, and other printed material intended for mass distribution 2
  • 3.
    The US is the largest market for paper product and commands high per capita consumption.  Asia’s main markets are China, Japan, India, Malaysia, Singapore and Thailand.  In 2005, Japan had the highest per capita consumption (247 kg), followed by Singapore (228 kg), Malaysia (106 kg), Taiwan (51 kg) China (42 kg), Indonesia (22 kg) and Philippines (16 kg).  India’s per capita consumption is estimated to be 7.0 kg in 2006. 3
  • 4.
    Category-wise paper millsin India (figures in number) Category Capacity Range Number of units Capacity (TPA) Consumption per capita, 2005 vs. 2006 Small Up to 10000 299 12,90,382 (figures in Kgs) <2000 69 75,522 324.0 312.0 2000–5000 107 2,96,980 247.0 5000–10000 123 9,17,880 228.0 Medium 10000–20000 116 16,69,460 106.0 Large >20000 70 38,93,048 51.0 42.0 22.0 16.0 14.0 6.57.0 USA Japan Singapore Malaysia Thailand China Indonesia Philippines Viet nam India 4
  • 5.
  • 6.
    Indian Pulp and Paper has shown significant improvements.  There are still many challenges & a long way to go.  Capacity utilization of the industry is just 79%, due to old technology. 6
  • 7.
  • 8.
  • 9.
    India is the15th largest paper producer in the world. It provides employment to nearly 1.5 million people and contributes INR25.0 billion to the government's exchequer. In last 55 years, the number of paper mills has increased from just 17 mills in 1951 to more than 666 units engaged in the manufacture of paper and paperboard, out of which nearly 568 are in operation by 2006. - 194 mills under purview of Board of Industrial and Financial Reconstruction (BIFR); nearly 60 mills with a capacity of 1.3 million tonnes is closed. 9
  • 10.
    Indian paper millsare categorised based on the raw materials - Recycled wood/forest based mills, agro-residue Paper 38% based mills and wastepaper-based mills. - Due to the increasing regulation and raw material prices, the companies are increasingly using more non- wood based raw material over the years. In 2006, around 70 % of the total production is based on non- - wood raw material. 10
  • 11.
  • 12.
    Due to highgrowth rate, Indian paper industry is very attractive for the foreign players Paper and Paperboard - Production in India, 2002-06 (figures in million tonnes) • India is self-sufficient in manufacture 8.1 Installed Capacity of most varieties of paper and Production 7.7 7.4 6.5 paperboards. 6.2 6.4 5.9 5.9 5.2 5.6 - Import is mainly related to certain speciality papers such as light weight coated variety of paper, cheque paper, etc. - Due to the scarcity of raw material, 2002-03 2003-04 2004-05 2005-06 2006-07 the companies also need to rely on Paper and Paperboard - Import-Export, 2002-06 imported wood pulp and waste (figures in million tonnes) Import 0.4 paper. Export 0.3 0.3 0.3 0.3 0.3 • In last 5 years, capacity was 0.2 0.2 increased mainly through expansion 0.2 0.2 and modernisation of the existing facilities rather than setting up greenfield projects. 2002-03 2003-04 2004-05 2005-06 2006-07 * 12
  • 13.
    The per capita consumption of paper in India is very low i.e. 7 Kgs in 2006, as compared to an average consumption of 28 Kgs and 58 Kgs in Asia and world respectively. The per capita consumption is expected to increase to 12 Kgs by 2020. • The domestic paper market is dominated by large players owing to their size, brand value and financial strength. In 2006-07, the top 10 players control around 60% of the market in term of capacity. 13
  • 14.
    Various macro-economic factorslike • national economic growth, • industrial production, • promotional expenditure, • population growth and the government’s allocations for the educational sector influence the demand for paper - The growth in paper consumption is directly related to GDP growth in the country. In the past, it has shown the 1:1 relationship with the GDP growth rate. - With expected GDP growth of 9-9.5%, the demand for Newsprint and Writing & Printing Paper is expected to grow at the same rate. Continued availability of raw materials would be a big challenge for the industry in the next 5-10 years. 14
  • 15.
    According to theIndian Pulp and Paper Technical Association (IPPTA), the paper industry is expected to fall short of demand by 1.1 million tonnes by 2010-11 due to raw material constraints. According to ITC’s estimates, the total demand for paper is around 8.0 million tonnes and is expected to grow to 10.0 million tonnes by 2012 and 21.0 million tonnes by 2020. According to Indian Paper Manufacturers Association (IPMA), consumption of paper in India is set to double from the current 7.0 million tonnes per annum by 2015. 15
  • 16.
    Demand driven P&Pindustry will be stressed by pressures of • quality, • availability & • environmental considerations. Society, CREP & sustainability issues will demand a change in the manner in which industry conducts itself today 16
  • 17.
    Chip size control  Dust & sound management  Raw material cleaning  Raw material Storage  Segregation of waste paper 17
  • 18.
    Pulp quality variation: H- Factor Control  Adoption of modern pulping digesters  Adoption of Single/two stage oxygen de- lignification  Control of odour in conventional batch digester 18
  • 19.
    Elimination of elemental chlorine & hypochlorite from bleaching sequence  Introduction of ECF bleaching  Introduction of oxygen extraction stage in bleaching (several mills don’t have this)  Adoption of enzyme pre-bleaching  Look at closing bleach filtrate cycles. 19
  • 20.
     Eliminate DCEfor Kraft liquor evaporation (63 per cent Indian mills have DCEs).  Introduce concentrators for black liquor concentration above 72 per cent  Look at BL viscosity reduction opportunity  Put efforts on NPE, silica and scales management  Introduce lime reburning systems 20
  • 21.
    Indian mills are weak in instrumentation & process control. This results in wide variations in quality of sectional outputs.  Variation in quality of inputs, poor/inefficient/outdated multiple equipments multiplies the challenges. 21
  • 22.
    On an average,recovered energy in Indian mills meets only 45 per cent of energy meets of pulp and recovery section (in good global mills there is energy excess) 22
  • 23.
    • During theprevious year, pulp prices went up but companies were unable to pass on the full increase to buyers. However, most companies raised prices thrice this year, to pass on raw material push. They are reporting better performance, quarter-on-quarter. • “ he fact that companies are able to pass on the price T increase from time to time shows the demand-supply gap is narrowing. Companies are also looking at another round of price increase. 23
  • 24.
    The domestic paper industry is estimated at around 10 million tonnes yearly. Of this, the writing and paper segment accounts for 3.8 mt, the packaging grade paper segment is around 4.5 mt and the newsprint industry about 1.7 m t.  The domestic yearly per capita consumption of paper is only 9.2 kg, much lower than many other developing economies. The figure in China and Indonesia is estimated at 42 kg and 23 kg, respectively. However, all segments of the industry are growing at eight to nine per cent or above. 24
  • 25.
    The industry is likely to see supply pressure by the end of the year.  The supply overhang in the paper industry, caused by the bunching of new capacities by leading companies such as BILT, TNPL and West Coast in 2010, seems to be getting over.  After having faced overcapacity last year, the industry is likely to see supply pressure by the year end. 25
  • 26.
    There were many capacity additions last year, but nobody is carrying stocks or operating at a lower capacity. The market is absorbing whatever is being produced.  Demand is expected to exceed supply in 2012 and 2013,”said A Velliangiri, deputy managing director, TNPL, which has writing and printing paper capacity of 400,000 tonnes yearly. Others in the industry echo Velliangiri’ view. ’s 26
  • 27.
    Sustained fibre supply-Virgin & Secondary  Sustained water supply  Sustained energy supply & quantum reduction in specific energy use  Colour & chloro - organics in wastewater  Odour & VOC’s in emissions  Solid wastes management 27
  • 28.
    Strong economic growth Low consumption per capita Indian Paper Industry Increased government focus on Printing Industry education 28
  • 29.
    Low consumption percapita • India accounts for 15% of the world Paper Per Capita Consumption in India, 2003-07 population, it consumes only 1% of the (figures in Kgs) world paper consumption. 7.0 6.0 - The paper consumption in India is just 7 4.8 Kgs per capital, as compared to global 4.4 4.6 average of 50 Kgs per capita. • With the increasing literacy rate and strong economic growth, the per capita consumption of papers is expected to 2002-03 2003-04 2004-05 2005-06 2006-07 increase in the future Paper – Demand vs. Supply, 2007-11* - According to Economic Survey, per (figures in million tonnes) capita spending on education, as a 11.0 10.5 percentage of GDP, has increased from 9.2 9.6 9.3 9.0 9.8 8.6 8.8 8.7 8.2 1.2% in 1983 to 4.4% in 2003, at a 7.3 7.7 7.8 CAGR of 7.1%. • The impact of just 1 kg increase in per capita consumption would lead to increase in demand by 1.1 million tonnes of paper. 2007 2008E 2009E 2010E 2011E Capacity Demand Demand (7Kgs per capita) (8Kgs per capita) 29
  • 30.
    West Coast PaperMills (WCPM) has recorded a 88 per cent rise in its net profit at Rs. 28.52 crores in 2000-01 (Rs. 15.20 crores). Sales and income from operations rose 7 per cent to Rs. 351.33 crores (Rs. 328.68 crores). Profits jumped on better realisations coupled with an increase in demand for paper and paper board. 30
  • 31.
    • ITC BhadrachalamPaperboards had expanded capacity from 62,500 tpa to 1.82 lakh tpa. Following the infusion of around Rs. 150 crores from ITC, the company has carved a niche for itself in the export market for coated paperboards and specialty paper. • Tamil Nadu Newsprint (TNPL) boasts of being among the most efficient players in the newsprint industry. In 2000-01, the company reported sales of Rs. 596.40 crores and a net profit of Rs. 76.40 crores. Promoted jointly by the Tamil Nadu Government and IDBI, TNPL manufactures newsprint and printing/writing paper with a capacity of 1.8 lakh tonnes annually. TNPL uses bagasse as the main input. It is now going in for de-bottlenecking to enable capacity increase by around 25 per cent. 31
  • 32.
    Ballarpur Industries Limited(BILT) is India's largest paper company and the only Indian company to rank amongst the top 100 paper companies in the world. BILT, part of the $3 billion Avantha Group, is India's largest manufacturer and exporter of paper, with a strong presence in all segments of the usage spectrum, including writing and printing paper, industrial paper and specialty paper. The company has a diversified production infrastructure with six manufacturing units spread across the country. 32
  • 33.
    Ballarpur Industries Limited(BILT)  The company has 6 units, together with a capacity of 480,000 tonnes and a pulp mill of capacity 100,000 tonnes manufacturing rayon grade pulp, in the state of Andhra Pradesh (Kamlapuram Unit).  BILT is expanding its production capacity in both coated and non-coated paper, to take it to around 1.0 million tonnes by 2009-10. With the increase in overall capacity, the company expects to double its turnover by 2009-10. ◦ In October 2007, the company announced to increase the capacity of its coated wood free paper unit at Bhigwan in Pune by adding 190,000 tonnes. After the expansion, the total unit capacity would increase to 315,000 tonnes. ◦ The main plant and machinery and its installation would be supplied by Voith, Germany, while some equipment will be sourced locally from suppliers like L&T, etc.  In July 2007, the company also initiated a restructuring plan, under which it would transfer 3 manufacturing units at Bhigwan, Ballarpur and Kamalapuram, to a separate company called BILT Graphic Paper Products, which would be transferred to Ballarpur Paper Holdings BV (BPH) after court approval. By this exercise, the company would transfer its commodity business, which is capital- intensive and would focus on the speciality and consumer-focused products business. 33
  • 34.
    Installed Capacity, 2002-06 (Figuresin ‘000 tonnes) 480.0 480.0 457.5 406.6 386.0 386.6 383.4 407.3 358.9 369.9 2002-03 2003-04 2004-05 2005-06 2006-07 Installed Capacity – Paper unit, 2005-06 (Figures in ‘000 tonnes) 34
  • 35.
    To choose eco-friendly paper: Know  1. The paper’s fiber source  2. Chemicals processing  3. Ability to be recycled or break down in a landfill. 35