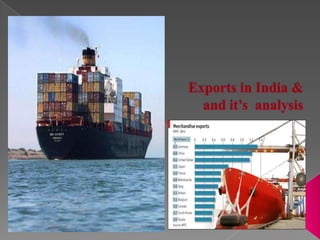
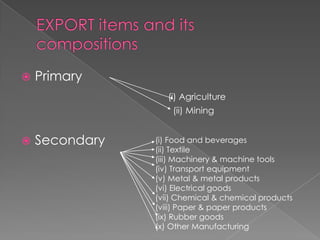
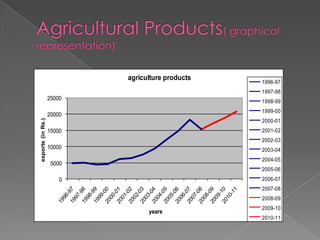
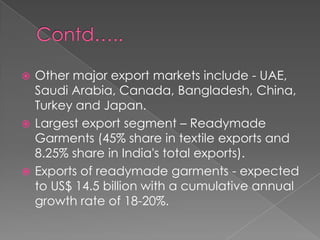
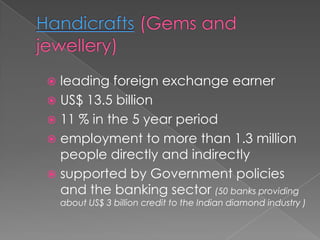
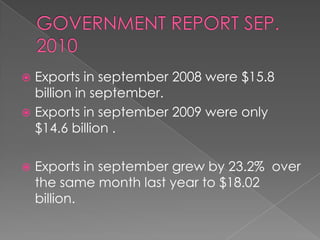
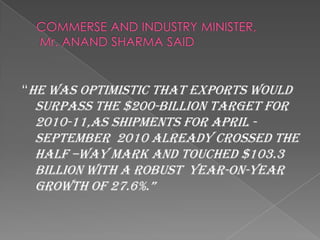
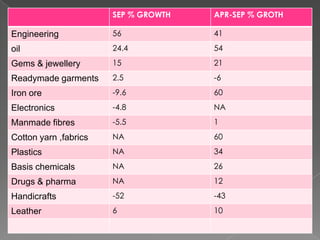
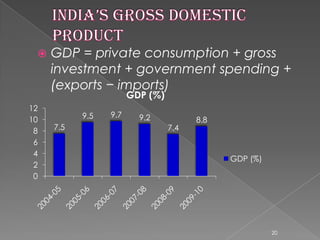
ASHOK KUMAR SINGH
   Primary
                   (i) Agriculture
                    (ii) Mining


   Secondary   (i) Food and beverages
                (ii) Textile
                (iii) Machinery & machine tools
                (iv) Transport equipment
                (v) Metal & metal products
                (vi) Electrical goods
                (vii) Chemical & chemical products
                (viii) Paper & paper products
                (ix) Rubber goods
                (x) Other Manufacturing
   Tertiary   (i) Telecommunication
               (ii) Power generation
                 (iii) Services
1.    COFFEE, TEA, MATE AND SPICES.
2.    RESIDUES AND WASTE FROM THE FOOD INDUSTRIES; PREPARED
      ANIMAL FODER.
3.    CEREALS.
4.    EDIBLE FRUIT AND NUTS; PEEL OR CITRUS FRUIT OR MELONS.
5.    RUBBER AND ARTICLES THEREOF.
6.    OIL SEEDS AND OLEA. FRUITS; MISC. GRAINS, SEEDS AND FRUIT;
      INDUSTRIAL OR MEDICINAL PLANTS; STRAW AND FODDER.
7.    TOBACCO AND MANUFACTURED TOBACCO SUBSTITUTES.
8.    SUGARS AND SUGAR CONFECTIONERY.
9.    EDIBLE VEGETABLES AND CERTAIN ROOTS AND TUBERS.
10.   LAC; GUMS, RESINS AND OTHER VEGETABLE SAPS AND
      EXTRACTS.
agriculture products
                                                  1996-97
                                                  1997-98
                   25000
                                                  1998-99
                                                  1999-00
                   20000
exports (in Rs.)


                                                  2000-01
                   15000                          2001-02
                                                  2002-03
                   10000                          2003-04
                                                  2004-05
                    5000
                                                  2005-06
                       0                          2006-07
                                                  2007-08
                                                  2008-09
                                                  2009-10
                                 years
                                                  2010-11
   Exports increased from US$ 14 million (2004-05) to
    US$ 17 million (2005-06) – 21.77 % increase.
   With continuing growth, the total exports has
    increased to – US$ 19.62 billion (2006-07).
   Current share in world export of textiles – 3.5 - 4 %.
   Current share in world clothing export – 3 %.
   Major export market – Europe (22% share in textiles
    & 43% share in apparel).
   Single largest buyer – US ( 10% share in textiles and
    32.65 share in apparel).
 Other major export markets include - UAE,
  Saudi Arabia, Canada, Bangladesh, China,
  Turkey and Japan.
 Largest export segment – Readymade
  Garments (45% share in textile exports and
  8.25% share in India's total exports).
 Exports of readymade garments - expected
  to US$ 14.5 billion with a cumulative annual
  growth rate of 18-20%.
 leading foreign exchange earner
 US$ 13.5 billion
 11 % in the 5 year period
 employment to more than 1.3 million
  people directly and indirectly
 supported by Government policies
  and the banking sector (50 banks providing
    about US$ 3 billion credit to the Indian diamond industry )
 highly labor intensive and decentralized
 as the second largest employment-
  generating sector after agriculture
 offers employment to over 6 million
  artisans
 a perfect example of assimilation
  between the traditional designs and
  modern techniques
   India is the largest livestock holding country - 21% large
    animals and 11% small animals
   A source for 10% world leather requirement
   About 2.50 million workforce (30% women)
   Annual production value is over U$ 4 billion
   Annual export value is over U$ 2 billion
   Export growth CAGR 8.20% (2000-04)
   Promising technology inflow and FDI
   High priority to occupational safety and work
    environment
   Compliance to environmental standards
   Immense potential for future growth (domestic as well as
    export)
   ARTICLES OF APPAREL AND CLOTHING ACCESSORIES, NOT
    KNITTED OR CROCHETED.
   COTTON.
   ARTICLES OF LEATHER,SADDLERY AND HARNESS;TRAVEL
    GOODS, HANDBAGS AND SIMILAR CONT.ARTICLES OF ANIMAL
    GUT(OTHR THN SILK-WRM)GUT.
   OTHER MADE UP TEXTILE ARTICLES; SETS; WORN CLOTHING
    AND WORN TEXTILE ARTICLES; RAGS
   CARPETS AND OTHER TEXTILE FLOOR COVERINGS.
   SILK
   KNITTED OR CROCHETED FABRICS.
   Leather goods
 Exports in september 2008 were $15.8
  billion in september.
 Exports in september 2009 were only
  $14.6 billion .

   Exports in september grew by 23.2% over
    the same month last year to $18.02
    billion.
“He was optimistic that exports would
 surpass the $200-billion target for
 2010-11,as shipments for april -
 september 2010 already crossed the
 half –way mark and touched $103.3
 billion with a robust year-on-year
 growth of 27.6%.”
SEP % GROWTH   APR-SEP % GROTH

Engineering            56             41
oil                    24.4           54
Gems & jewellery       15             21
Readymade garments     2.5            -6
Iron ore               -9.6           60
Electronics            -4.8           NA
Manmade fibres         -5.5           1
Cotton yarn ,fabrics   NA             60
Plastics               NA             34
Basis chemicals        NA             26
Drugs & pharma         NA             12
Handicrafts            -52            -43
Leather                6              10
   GDP = private consumption + gross
     investment + government spending +
     (exports − imports)
                       GDP (%)
12
           9.5   9.7     9.2
10                                     8.8
 8   7.5                         7.4
 6
 4
                                             GDP (%)
 2
 0


                                                       20
export and import

export and import

  • 1.
  • 3.
    Primary (i) Agriculture (ii) Mining  Secondary (i) Food and beverages (ii) Textile (iii) Machinery & machine tools (iv) Transport equipment (v) Metal & metal products (vi) Electrical goods (vii) Chemical & chemical products (viii) Paper & paper products (ix) Rubber goods (x) Other Manufacturing
  • 4.
    Tertiary (i) Telecommunication (ii) Power generation (iii) Services
  • 6.
    1. COFFEE, TEA, MATE AND SPICES. 2. RESIDUES AND WASTE FROM THE FOOD INDUSTRIES; PREPARED ANIMAL FODER. 3. CEREALS. 4. EDIBLE FRUIT AND NUTS; PEEL OR CITRUS FRUIT OR MELONS. 5. RUBBER AND ARTICLES THEREOF. 6. OIL SEEDS AND OLEA. FRUITS; MISC. GRAINS, SEEDS AND FRUIT; INDUSTRIAL OR MEDICINAL PLANTS; STRAW AND FODDER. 7. TOBACCO AND MANUFACTURED TOBACCO SUBSTITUTES. 8. SUGARS AND SUGAR CONFECTIONERY. 9. EDIBLE VEGETABLES AND CERTAIN ROOTS AND TUBERS. 10. LAC; GUMS, RESINS AND OTHER VEGETABLE SAPS AND EXTRACTS.
  • 7.
    agriculture products 1996-97 1997-98 25000 1998-99 1999-00 20000 exports (in Rs.) 2000-01 15000 2001-02 2002-03 10000 2003-04 2004-05 5000 2005-06 0 2006-07 2007-08 2008-09 2009-10 years 2010-11
  • 9.
    Exports increased from US$ 14 million (2004-05) to US$ 17 million (2005-06) – 21.77 % increase.  With continuing growth, the total exports has increased to – US$ 19.62 billion (2006-07).  Current share in world export of textiles – 3.5 - 4 %.  Current share in world clothing export – 3 %.  Major export market – Europe (22% share in textiles & 43% share in apparel).  Single largest buyer – US ( 10% share in textiles and 32.65 share in apparel).
  • 10.
     Other majorexport markets include - UAE, Saudi Arabia, Canada, Bangladesh, China, Turkey and Japan.  Largest export segment – Readymade Garments (45% share in textile exports and 8.25% share in India's total exports).  Exports of readymade garments - expected to US$ 14.5 billion with a cumulative annual growth rate of 18-20%.
  • 12.
     leading foreignexchange earner  US$ 13.5 billion  11 % in the 5 year period  employment to more than 1.3 million people directly and indirectly  supported by Government policies and the banking sector (50 banks providing about US$ 3 billion credit to the Indian diamond industry )
  • 13.
     highly laborintensive and decentralized  as the second largest employment- generating sector after agriculture  offers employment to over 6 million artisans  a perfect example of assimilation between the traditional designs and modern techniques
  • 14.
    India is the largest livestock holding country - 21% large animals and 11% small animals  A source for 10% world leather requirement  About 2.50 million workforce (30% women)  Annual production value is over U$ 4 billion  Annual export value is over U$ 2 billion  Export growth CAGR 8.20% (2000-04)  Promising technology inflow and FDI  High priority to occupational safety and work environment  Compliance to environmental standards  Immense potential for future growth (domestic as well as export)
  • 15.
    ARTICLES OF APPAREL AND CLOTHING ACCESSORIES, NOT KNITTED OR CROCHETED.  COTTON.  ARTICLES OF LEATHER,SADDLERY AND HARNESS;TRAVEL GOODS, HANDBAGS AND SIMILAR CONT.ARTICLES OF ANIMAL GUT(OTHR THN SILK-WRM)GUT.  OTHER MADE UP TEXTILE ARTICLES; SETS; WORN CLOTHING AND WORN TEXTILE ARTICLES; RAGS  CARPETS AND OTHER TEXTILE FLOOR COVERINGS.  CARPETS AND OTHER TEXTILE FLOOR COVERINGS.  SILK  KNITTED OR CROCHETED FABRICS.  Leather goods
  • 16.
     Exports inseptember 2008 were $15.8 billion in september.  Exports in september 2009 were only $14.6 billion .  Exports in september grew by 23.2% over the same month last year to $18.02 billion.
  • 17.
    “He was optimisticthat exports would surpass the $200-billion target for 2010-11,as shipments for april - september 2010 already crossed the half –way mark and touched $103.3 billion with a robust year-on-year growth of 27.6%.”
  • 19.
    SEP % GROWTH APR-SEP % GROTH Engineering 56 41 oil 24.4 54 Gems & jewellery 15 21 Readymade garments 2.5 -6 Iron ore -9.6 60 Electronics -4.8 NA Manmade fibres -5.5 1 Cotton yarn ,fabrics NA 60 Plastics NA 34 Basis chemicals NA 26 Drugs & pharma NA 12 Handicrafts -52 -43 Leather 6 10
  • 20.
    GDP = private consumption + gross investment + government spending + (exports − imports) GDP (%) 12 9.5 9.7 9.2 10 8.8 8 7.5 7.4 6 4 GDP (%) 2 0 20