Download to read offline
![International Journal of Modern Engineering Research (IJMER)
www.ijmer.com Vol.3, Issue.2, March-April. 2013 pp-765-768 ISSN: 2249-6645
Multiple Response Optimizations in Drilling Using Taguchi and
Grey Relational Analysis
B.Shivapragash, 1 K.Chandrasekaran, 2 C.Parthasarathy, 3 M.Samuel4
1 Assistant Professor, Department of mechanical engineering, PRIST University ,Trichy, Tamilnadu, India
2,3,4 Assistant Professor, Department of mechanical engineering, PRIST University ,Trichy, Tamilnadu, India
Abstract: Composite materials are important engineering materials due to their outstanding mechanical properties. Metal
matrix composite (MMCs) are one of the widely known composites because of their superior properties such as high
strength, hardness, stiffness, and corrosion resistances. Al-TiBr2 produces higher tool wear, poor surface roughness and
minimizes the metal removal rate. The quality of the material is influenced by the cutting conditions, tool material and
geometry. The present work is focusing on multiple response optimization of drilling process for composite Al-TiBr2. The
study provided to minimise the damage events occurring during drilling process for composite material. A statistical
approach used to analyse experiment data. Taguchi method with grey relational analysis was used to optimize the machining
parameters with multiple performance characteristics in drilling of MMC Al-TiBr2. The results shows that the maximum
feed rate, low spindle speed are the most significant factors which affect the drilling process and the performance in the
drilling process can be effectively improved by using this approach.
Keywords: Drilling, Grey relational analysis, Metal removal rate, Surface roughness, Taguchi method
I. Introduction
To provide cost effectiveness in manufacturing and especially machining operations, there is a continuous need to
reduce tooling costs. The most well-known methods used to reduce tooling costs are various applications of more resistant
tool materials, heat treatments, cutting fluids, speed and feed rates and the development of coated cutting tool [1, 2]. A
composite material is a heterogeneous solid consists of two or more different materials that are mechanically or metallurgical
bonded together. Each of its components retains its identity in the composite and maintains its characteristic structure and
property. The composite material, however generally possesses characteristics properties, such as stiffness, strength, high
temperature performance, corrosion resistance, hardness or conductivity that are not possible with the individual components
by them. Analysis of these properties shows that they depend on the property of individual components; the relative amount
of components; the size, shape and distribution of the discontinuous components; the degree of bonding between them and
the orientation of the various components [3]. MMC have become a large leading material in composite materials, and
particle reinforced aluminum MMCs have received considerable attention due to their excellent engineering properties.
These materials are known as the difficult-to-machine materials, because of the hardness and abrasive nature of
reinforcement element like silicon carbide (SiC) particles [4]. The application fields of MMCs include aerospace, defence
and automotives [4]. Hybrid MMCs were obtained by reinforcing the matrix alloy with more than one type of reinforcements
having different properties [6]. The Al-based hybrid composites, with 20% SiC Whiskers and 0, 2%, 5%, 7% SiC nano
particles, were fabricated by squeeze casting route [7]. In the view of the growing engineering applications of these
composites, a need for detailed and systematic study of their machining characteristics is envisaged. The efficient and
economic machining of these materials is required for the desired dimensions and surface finish [8].
Nihat Tosun[9] Use The grey relational analysis for optimizing the drilling process parameters for the work piece
surface roughness and the burr height is introduced. Various drilling parameters, such as feed rate, cutting speed, drill and
point angles of drill were considered. An orthogonal array was used for the experimental design. Optimal machining
parameters were determined by the grey relational grade obtained from the grey relational analysis for multi-performance
characteristics (the surface roughness and the burr height). Experimental results have shown that the surface roughness and
the burr height in the drilling process can be improved effectively through the new approach. Stein and Dornfeld [10]
presented a study on the burr height, thickness, and geometry observed in the drilling of 0.91-mm diameter through holes in
stainless steel 304L. They presented a proposal for using the drilling burr data as part of a process planning methodology for
burr control. To minimize the burr formed during drilling, Ko and Lee [11] investigated the effect of drill geometry on burr
formation. They showed that a larger point angle of drill reduced the burr size. Sakurai et al. [12] have also tried to change
the cutting conditions and determined high feed rate drilling of aluminium alloy. The researchers examined cutting forces,
drill wear, heat generated, chip shape, hole finish, etc. Gillespie and Blotter [13] studied experimentally the effects of drill
geometry, process conditions, and material properties. They have classified the machining burrs into four types: Poisson
burr, rollover burr, tear burr, and cut-off burr. Valuable review about burr in machining operation provided important
information [14].Erol Kilickap [15] Modelling and optimization of burr height in drilling of Al-7075 using Taguchi method
and response surface methodology. This investigation presents the use of Taguchi and response surface methodologies for
minimizing the burr height and the surface roughness in drilling Al-7075. The optimization results showed that the
combination of low cutting speed, low feed rate, and high point angle is necessary to minimize the burr height The study
shows that the Taguchi method is suitable to solve the stated within minimum number of trials as compared with a full
www.ijmer.com 765 | Page](https://image.slidesharecdn.com/bb32765768-130323020400-phpapp02/85/Bb32765768-1-320.jpg)
![International Journal of Modern Engineering Research (IJMER)
www.ijmer.com Vol.3, Issue.2, March-April. 2013 pp-765-768 ISSN: 2249-6645
Multiple Response Optimizations in Drilling Using Taguchi and
Grey Relational Analysis
B.Shivapragash, 1 K.Chandrasekaran, 2 C.Parthasarathy, 3 M.Samuel4
1 Assistant Professor, Department of mechanical engineering, PRIST University ,Trichy, Tamilnadu, India
2,3,4 Assistant Professor, Department of mechanical engineering, PRIST University ,Trichy, Tamilnadu, India
Abstract: Composite materials are important engineering materials due to their outstanding mechanical properties. Metal
matrix composite (MMCs) are one of the widely known composites because of their superior properties such as high
strength, hardness, stiffness, and corrosion resistances. Al-TiBr2 produces higher tool wear, poor surface roughness and
minimizes the metal removal rate. The quality of the material is influenced by the cutting conditions, tool material and
geometry. The present work is focusing on multiple response optimization of drilling process for composite Al-TiBr2. The
study provided to minimise the damage events occurring during drilling process for composite material. A statistical
approach used to analyse experiment data. Taguchi method with grey relational analysis was used to optimize the machining
parameters with multiple performance characteristics in drilling of MMC Al-TiBr2. The results shows that the maximum
feed rate, low spindle speed are the most significant factors which affect the drilling process and the performance in the
drilling process can be effectively improved by using this approach.
Keywords: Drilling, Grey relational analysis, Metal removal rate, Surface roughness, Taguchi method
I. Introduction
To provide cost effectiveness in manufacturing and especially machining operations, there is a continuous need to
reduce tooling costs. The most well-known methods used to reduce tooling costs are various applications of more resistant
tool materials, heat treatments, cutting fluids, speed and feed rates and the development of coated cutting tool [1, 2]. A
composite material is a heterogeneous solid consists of two or more different materials that are mechanically or metallurgical
bonded together. Each of its components retains its identity in the composite and maintains its characteristic structure and
property. The composite material, however generally possesses characteristics properties, such as stiffness, strength, high
temperature performance, corrosion resistance, hardness or conductivity that are not possible with the individual components
by them. Analysis of these properties shows that they depend on the property of individual components; the relative amount
of components; the size, shape and distribution of the discontinuous components; the degree of bonding between them and
the orientation of the various components [3]. MMC have become a large leading material in composite materials, and
particle reinforced aluminum MMCs have received considerable attention due to their excellent engineering properties.
These materials are known as the difficult-to-machine materials, because of the hardness and abrasive nature of
reinforcement element like silicon carbide (SiC) particles [4]. The application fields of MMCs include aerospace, defence
and automotives [4]. Hybrid MMCs were obtained by reinforcing the matrix alloy with more than one type of reinforcements
having different properties [6]. The Al-based hybrid composites, with 20% SiC Whiskers and 0, 2%, 5%, 7% SiC nano
particles, were fabricated by squeeze casting route [7]. In the view of the growing engineering applications of these
composites, a need for detailed and systematic study of their machining characteristics is envisaged. The efficient and
economic machining of these materials is required for the desired dimensions and surface finish [8].
Nihat Tosun[9] Use The grey relational analysis for optimizing the drilling process parameters for the work piece
surface roughness and the burr height is introduced. Various drilling parameters, such as feed rate, cutting speed, drill and
point angles of drill were considered. An orthogonal array was used for the experimental design. Optimal machining
parameters were determined by the grey relational grade obtained from the grey relational analysis for multi-performance
characteristics (the surface roughness and the burr height). Experimental results have shown that the surface roughness and
the burr height in the drilling process can be improved effectively through the new approach. Stein and Dornfeld [10]
presented a study on the burr height, thickness, and geometry observed in the drilling of 0.91-mm diameter through holes in
stainless steel 304L. They presented a proposal for using the drilling burr data as part of a process planning methodology for
burr control. To minimize the burr formed during drilling, Ko and Lee [11] investigated the effect of drill geometry on burr
formation. They showed that a larger point angle of drill reduced the burr size. Sakurai et al. [12] have also tried to change
the cutting conditions and determined high feed rate drilling of aluminium alloy. The researchers examined cutting forces,
drill wear, heat generated, chip shape, hole finish, etc. Gillespie and Blotter [13] studied experimentally the effects of drill
geometry, process conditions, and material properties. They have classified the machining burrs into four types: Poisson
burr, rollover burr, tear burr, and cut-off burr. Valuable review about burr in machining operation provided important
information [14].Erol Kilickap [15] Modelling and optimization of burr height in drilling of Al-7075 using Taguchi method
and response surface methodology. This investigation presents the use of Taguchi and response surface methodologies for
minimizing the burr height and the surface roughness in drilling Al-7075. The optimization results showed that the
combination of low cutting speed, low feed rate, and high point angle is necessary to minimize the burr height The study
shows that the Taguchi method is suitable to solve the stated within minimum number of trials as compared with a full
www.ijmer.com 765 | Page](https://image.slidesharecdn.com/bb32765768-130323020400-phpapp02/75/Bb32765768-1-2048.jpg)
![International Journal of Modern Engineering Research (IJMER)
www.ijmer.com Vol.3, Issue.2, March-April. 2013 pp-765-768 ISSN: 2249-6645
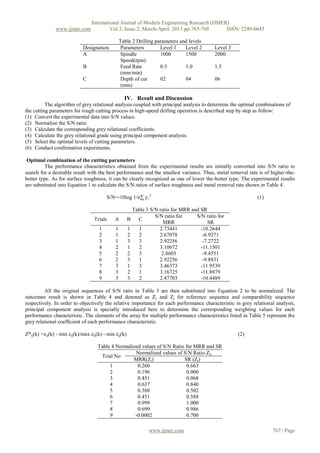
Table 5 Grey Relational Coefficients for MRR and SR
Grey Relational Coefficient
Trial No Grey Grade
MRR SR
1 0.657397 0.42959 0.543493
2 0.7183 1.0000 0.85915
3 0.525618 0.879272 0.702445
4 0.439404 0.373107 0.406256
5 0.56296 0.498552 0.530756
6 0.525618 0.459539 0.492578
7 0.333394 0.333333 0.333364
8 0.416927 0.336277 0.376602
9 1.000548 0.416457 0.708502
The response table of Taguchi method is employed here to calculate the average grey relational grade for each
cutting parameter level. It is done by sorting the grey relational grades corresponding to levels of the cutting parameter in
each column of the orthogonal array, and taking an average on those with the same level. Using the same method,
calculations are performed for each cutting parameter level and the response table is constructed as shown in Table 6.
Basically, the larger the grey relational grade is the better the corresponding multiple performance characteristic. From the
response table for the grey relational grades shown in Table 05, the best combination of the cutting parameters is the set with
spindle low speed, high feed rate and middle depth of cut.
Table 6 Optimum Level for Drilling Parameter
Factors 1 2 3
Spindle
A 0.701696 0.47653 0.472823
Speed
B Feed Rate 0.427704 0.588836 0.634508
Depth of
C 0.470891 0.657969 0.522188
Cut
V. Conclusions
In this study mainly focus on material removal rate and surface roughness on Al-TiBr2 in radial drilling machining
with dry conditions. From the study of result in drilling is using Grey relational analysis. These following can be concluded
by this present studies.
1. Optimum cutting parameters for minimization surface roughness is spindle speed set as low level (1000 rpm), feed rate
set as maximum level (1.5 mm/min) and depth of cut set as middle level (6 mm).
2. Optimum cutting parameters for maximization material removal rate is spindle speed set as low level (1000 rpm), feed
rate set as maximum level (1.5 mm/min) and depth of cut set as middle level (6 mm).
Reference
[1] Da Silva, F.J., Franco, S.D., Machado, A.R., Ezugwu, E.O., Souza Jr. A.M. (2006). Performance cryogenically treated HSS tools.
Wear, vol. 261, no.5-6, p. 674-685,
[2] Boris Stirn, Kiha Lee, David A. Dornfeld (2001) “BURR FORMATION IN MICRO-DRILLING”.
[3] KILIÇKAP E, ÇAKIR O, AKSOY M, INAN A. Study of tool wear and surface roughness in machining of homogenized SiC-p
reinforced aluminium metal matrix composite. Journal of Materials Processing Technology, 2005, 165: 862-867.
[4] MOHAN B, RAJADURAI A, SATYANARAYANA K G. Electric discharge machining of Al/SiC metal matrix composites using
rotary tube electrode [J]. Journal of Mater Process Technology, 2004, 153: 978-985.
[5] ZHAN Y Z, ZHANG G D. The role of graphite particles in the high temperature wear of copper hybrid composites against steel [J].
Materials and Design, 2006, 27: 79-84.
[6] ZHANG X N, GENG L, WANG G S. Fabrication of Al-based hybrid composites reinforced with SiC whiskers and SiC nano
particles by squeeze casting [J]. Journal of Materials Processing Technology, 2066, 176: 146-151.
[7] GALLAB M, SKLAD M. Machining of Al/SiC metal matrix composites. Part II: Workpiece integrity [J]. Journal Mater Process,
1998, 83: 277-283.
[8]. Lin TR, Shyu RF (2000) Improvement of tool life and exit burr using variable feeds when drilling stainless steel with coated drills.
Int J Adv Manuf Technol 16:308–313
[9]. Stein JM, Dornfeld DA (1997) Burr formation in drilling miniature holes. Ann CIRP 46/17:63–66
[10]. Ko SL, Lee JK (2001) Analysis of burr formation in drilling with a new-concept drill. J Mater Process Technol 113:392–398
[11]. Sakurai K, Adachi K, Kawai G, Sawai T (2000) High feed rate drilling of aluminum alloy. Mat Sci Forum 331–337:625–630
[12]. Gillespie LK, Blotter PT (1976) the formation and properties of machining burs. Transactions ASME Journal of Engineering for
Industry 98:66–74
[13]. Aurich JC, Dornfeld D, Arrazola PJ, Franke V, Leitz L, Min S (2009) Burrs: analysis, control and removal. CIRP Annals Manuf
Technol 58:519–542
[14]. Erol Kilickap Modelling and optimization of burr height in drilling of Al-7075 using Taguchi method and response surface
methodology Springer-Verlag London Limited 2010.
www.ijmer.com 768 | Page](https://image.slidesharecdn.com/bb32765768-130323020400-phpapp02/85/Bb32765768-4-320.jpg)

This document summarizes a study that used Taguchi methods and Grey Relational Analysis to optimize drilling parameters for a composite material (Al-TiBr2). The study aimed to minimize surface roughness and maximize material removal rate during the drilling process. Experiments were conducted using an orthogonal array design with spindle speed, feed rate, and depth of cut as control parameters. Signal-to-noise ratios were calculated for each response and normalized. Grey relational coefficients and grades were then determined to identify the optimal drilling parameters. The results indicated that low spindle speed, high feed rate, and medium depth of cut provided the best combination for the multiple performance characteristics.