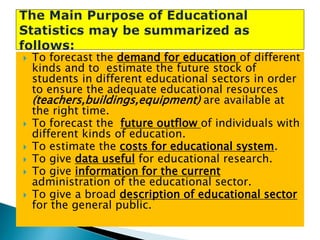
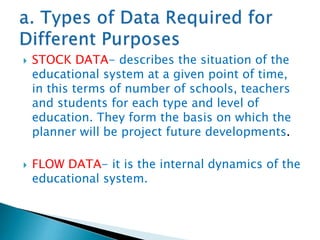
Rai Dela Vega Blanquera








To forecast the demand for education of different
kinds and to estimate the future stock of
students in different educational sectors in order
to ensure the adequate educational resources
(teachers,buildings,equipment) are available at
the right time.
To forecast the future outflow of individuals with
different kinds of education.
To estimate the costs for educational system.
To give data useful for educational research.
To give information for the current
administration of the educational sector.
To give a broad description of educational sector
for the general public.




STOCK DATA- describes the situation of the
educational system at a given point of time,
in this terms of number of schools, teachers
and students for each type and level of
education. They form the basis on which the
planner will be project future developments.
FLOW DATA- it is the internal dynamics of the
educational system.




Individualized Data- provide
information about each individual
student or teacher in a considerably
detailed basis.
Aggregated Data-provide information
on students and teachers distributed
by sex, age, grade, subjects areas, etc.
Data on individuals are not reported.


The basic population data used are
the previous and projected singleyear, sex-age groups of the school
age population. With these data, it is
possible to assess the proportion of
children of school age who are
enrolled in schools and those who are
not attending school; to know the
future school age population and to
analyze student flows.
 Educational

planning is closely
interrelated
with
manpower
planning. In the preparation of an
educational plan, it is essential to
get the data on actual and
expected needs for educated
people which are presented in
manpower projections and special
surveys.




As to the economic data needed, the Gross
National Product (GNP) or the gross national
income should provide basic information.
Estimates of the share of the educational
sector in the economy have to be projected.
All the economic data should be presented
clearly and comprehensively to enable the
planners and decision makers to determine
whether or not the plan is economically
feasible.
The proper classification of
data in presenting statistics on
schools, classes, students and
teachers may be as follows:
a. By authority which is
responsible for schools.
b. By levels and school cycle.
 The

most essentials source of
information
in
educational
planning is that which concerns
students.
It
is,
therefore
necessary
to
distribute
students by authority, cycle,
sex and grade for whatever
purpose they are as needed.




As teacher salaries constitute the largest item
in educational budget, a proper planning of
the future demand for teachers and their
utilization is essentials. Moreover , an
adequate supply of qualified teachers is
essential for the implementation of an
educational plan.
Data on teachers should be distributed and
cross-classified by authority, sex, age,
educational qualification/training, tenure and
eligibility.
 Regular

censuses of students, teachers,
graduates in all educational institutions
 Regular sample surveys of students, teachers in
all schools
 Ad Hoc surveys at irregular interval
 Population consensus
 Sample surveys drawn from population censuses
 Routine reporting of data obtained as by product
of educational administration


The needs for educational statistics are
related to the development of the educational
planning machinery. Where planning has
reached a sophisticated level, the demands
are much greater as to the amount of
information needed, the flexibility of, and the
access to such information. These factors
directly influence the methods of processing,
storage and retrieval of data.








INPUT SYSTEM- Transfers the original data to a
form which is suitable for processing.
ARITHMETIC UNIT- Consists of desk calculators,
punched card, operated machines or computers.
STORAGE SYSTEM- Permits the keeping of all the
original information as well as immediate data
which appeared in the processing of the original
ones.
OUTPUT UNIT- Enables the statistical office staff
to present processed data in a form which can be
printed and published.




The implementation of the integrated
reorganization program in the DepEd has
generated some measures to improve the
administrative and planning functions of the
new set up.
In the lights of these developments there is
indeed a great need of an effective and
efficient system that could provide the
necessary data and information inputs for the
formulation of accurate decisions and
realistic plans.
1. Population by educational attainment,
training skills
2. School-going age population by single-age
(7-24)
3. Migration within the country, by age
grouping
4. Literacy rate of population, 10 years and
above
5. Mobility
A. Enrolment and Graduates (Public and Private)
1. Elementary and Secondary Level
1.1 Total enrolment by sex, single-age group, level and
type of education
1.2 Male and female enrolment as percentage of total by
level and type of education
1.3 School enrolment ratios (participation rates)
1.4 Retention ratio by type of education (survival rates)
1.5 Attrition rates by level and type of education
2. Education at the Tertiary Level

3.
4.
5.
6.

2.1 Distribution of enrolment and graduates by field of study and
by sex
2.2 Attrition rates by course and by field of study
2.3 Absorption rate of graduates in their respective field of studies

Dropout rate, all levels, by type of education, sex and age
Students by socio-economic origin
Absorption rate by level of education and by field of study
Actual number of professional by field of study
B. NCEE
1. Number of applicants in the NCEE by socioeconomic group
2. Number of qualified applicants by socioeconomic group
3. Number of graduates in scholarship program
C. Scholarships
1. Number of scholars by level of education
2. Number of scholars by field of study and by type
of education
3. Number of graduates in scholarship program
A. Vocational/Technical Education
1. Enrolment and graduates in vocational/technical courses by level
of education and field of study
2. Absorption of graduates of vocational/technical schools
B. Manpower Training
1. Inventory of non-formal programs
2. Number, age and location of out-of-school youth (aged 10 – 24)
by training programs
3. Number and characteristics of participants of training programs
4. Number of graduates from training programs and rate of
absorption
5. Number and type of participants in apprenticeship training
programs
6. Absorption rate of apprentices
1. Total number of teachers by sex, age group,
level and type of education and salary scale
2. Average working life or service years of a
teacher
3. Teachers occupying non-teaching posts
4. Number of field-time and part-time guidance
counsellors
5. Teachers’ retirement and separation
6. Pupil-teacher, pupil-school and teacher-school
ratios by district and/or division
7. Number of administrative personnel by level,
category and type.
1. Number of schools at first level of education by
division
2. Number of schools at the second level of
education by type of education and division
3. Number of institutions, at the third level of
education by division, type and course
4. Other educational and training institutions
operating outside MEC jurisdiction
5. Size and enrolment capacity of schools and
training programs
6. Utilization of classrooms
7. Status of facilities of schools
a. Level of education
b. Type of education
c. Number of schools
d. Office accommodation
e. Science room
f. Workshops
g. Laboratory room
h. Home Economics
i. Library
j. Auditorium/gymnasium
k. Toilet
l. Water/drinking facilities
8. Ancillary Services
a. Medical-dental-nursing
services
b. Guidance and counselling
c. Canteen Services
d. Others

9. Textbooks and educational
materials
1. Teacher’s salaries
2. Cost of teachers’ training
3. Administrative cost
4. Instructional/training materials and facilities
5. Government subsidy by source to educational
institutions and training programs
6. Capital cost on education for the construction of
schools
7. Maintenance, rent and repair of schools
8. Cost of related services (or social expense)
1.
2.
3.
4.

Status
Location by region
Manpower requirements
Budget – capital and
operating
5. External assistance/ loans
“The

best kind of management, I
believe, allows all employees to
participate, so that each can
contribute in his own capacity to
the realization of a common goal.
QUOTES FROM NOT FOR BREAD ALONE By: Konosuke Matsushita”
“A good manager should never
have to resort to lies or deceit. His
integrity, furthermore, will remain
solid even if he speaks the truth in
every situation, even if
circumstances change and he must
say something quite different from
what he said three months ago.
Truth has a power of its own that
never fails to move others.”
QUOTES FROM NOT FOR BREAD ALONE By: Konosuke Matsushita
Basic statistical tools in educational planning

Basic statistical tools in educational planning

  • 1.
    Rai Dela VegaBlanquera
  • 3.
          To forecast thedemand for education of different kinds and to estimate the future stock of students in different educational sectors in order to ensure the adequate educational resources (teachers,buildings,equipment) are available at the right time. To forecast the future outflow of individuals with different kinds of education. To estimate the costs for educational system. To give data useful for educational research. To give information for the current administration of the educational sector. To give a broad description of educational sector for the general public.
  • 5.
      STOCK DATA- describesthe situation of the educational system at a given point of time, in this terms of number of schools, teachers and students for each type and level of education. They form the basis on which the planner will be project future developments. FLOW DATA- it is the internal dynamics of the educational system.
  • 6.
      Individualized Data- provide informationabout each individual student or teacher in a considerably detailed basis. Aggregated Data-provide information on students and teachers distributed by sex, age, grade, subjects areas, etc. Data on individuals are not reported.
  • 8.
     The basic populationdata used are the previous and projected singleyear, sex-age groups of the school age population. With these data, it is possible to assess the proportion of children of school age who are enrolled in schools and those who are not attending school; to know the future school age population and to analyze student flows.
  • 9.
     Educational planning isclosely interrelated with manpower planning. In the preparation of an educational plan, it is essential to get the data on actual and expected needs for educated people which are presented in manpower projections and special surveys.
  • 10.
      As to theeconomic data needed, the Gross National Product (GNP) or the gross national income should provide basic information. Estimates of the share of the educational sector in the economy have to be projected. All the economic data should be presented clearly and comprehensively to enable the planners and decision makers to determine whether or not the plan is economically feasible.
  • 11.
    The proper classificationof data in presenting statistics on schools, classes, students and teachers may be as follows: a. By authority which is responsible for schools. b. By levels and school cycle.
  • 12.
     The most essentialssource of information in educational planning is that which concerns students. It is, therefore necessary to distribute students by authority, cycle, sex and grade for whatever purpose they are as needed.
  • 13.
      As teacher salariesconstitute the largest item in educational budget, a proper planning of the future demand for teachers and their utilization is essentials. Moreover , an adequate supply of qualified teachers is essential for the implementation of an educational plan. Data on teachers should be distributed and cross-classified by authority, sex, age, educational qualification/training, tenure and eligibility.
  • 15.
     Regular censuses ofstudents, teachers, graduates in all educational institutions  Regular sample surveys of students, teachers in all schools  Ad Hoc surveys at irregular interval  Population consensus  Sample surveys drawn from population censuses  Routine reporting of data obtained as by product of educational administration
  • 16.
     The needs foreducational statistics are related to the development of the educational planning machinery. Where planning has reached a sophisticated level, the demands are much greater as to the amount of information needed, the flexibility of, and the access to such information. These factors directly influence the methods of processing, storage and retrieval of data.
  • 17.
        INPUT SYSTEM- Transfersthe original data to a form which is suitable for processing. ARITHMETIC UNIT- Consists of desk calculators, punched card, operated machines or computers. STORAGE SYSTEM- Permits the keeping of all the original information as well as immediate data which appeared in the processing of the original ones. OUTPUT UNIT- Enables the statistical office staff to present processed data in a form which can be printed and published.
  • 18.
      The implementation ofthe integrated reorganization program in the DepEd has generated some measures to improve the administrative and planning functions of the new set up. In the lights of these developments there is indeed a great need of an effective and efficient system that could provide the necessary data and information inputs for the formulation of accurate decisions and realistic plans.
  • 21.
    1. Population byeducational attainment, training skills 2. School-going age population by single-age (7-24) 3. Migration within the country, by age grouping 4. Literacy rate of population, 10 years and above 5. Mobility
  • 22.
    A. Enrolment andGraduates (Public and Private) 1. Elementary and Secondary Level 1.1 Total enrolment by sex, single-age group, level and type of education 1.2 Male and female enrolment as percentage of total by level and type of education 1.3 School enrolment ratios (participation rates) 1.4 Retention ratio by type of education (survival rates) 1.5 Attrition rates by level and type of education 2. Education at the Tertiary Level 3. 4. 5. 6. 2.1 Distribution of enrolment and graduates by field of study and by sex 2.2 Attrition rates by course and by field of study 2.3 Absorption rate of graduates in their respective field of studies Dropout rate, all levels, by type of education, sex and age Students by socio-economic origin Absorption rate by level of education and by field of study Actual number of professional by field of study
  • 23.
    B. NCEE 1. Numberof applicants in the NCEE by socioeconomic group 2. Number of qualified applicants by socioeconomic group 3. Number of graduates in scholarship program C. Scholarships 1. Number of scholars by level of education 2. Number of scholars by field of study and by type of education 3. Number of graduates in scholarship program
  • 24.
    A. Vocational/Technical Education 1.Enrolment and graduates in vocational/technical courses by level of education and field of study 2. Absorption of graduates of vocational/technical schools B. Manpower Training 1. Inventory of non-formal programs 2. Number, age and location of out-of-school youth (aged 10 – 24) by training programs 3. Number and characteristics of participants of training programs 4. Number of graduates from training programs and rate of absorption 5. Number and type of participants in apprenticeship training programs 6. Absorption rate of apprentices
  • 25.
    1. Total numberof teachers by sex, age group, level and type of education and salary scale 2. Average working life or service years of a teacher 3. Teachers occupying non-teaching posts 4. Number of field-time and part-time guidance counsellors 5. Teachers’ retirement and separation 6. Pupil-teacher, pupil-school and teacher-school ratios by district and/or division 7. Number of administrative personnel by level, category and type.
  • 26.
    1. Number ofschools at first level of education by division 2. Number of schools at the second level of education by type of education and division 3. Number of institutions, at the third level of education by division, type and course 4. Other educational and training institutions operating outside MEC jurisdiction 5. Size and enrolment capacity of schools and training programs 6. Utilization of classrooms
  • 27.
    7. Status offacilities of schools a. Level of education b. Type of education c. Number of schools d. Office accommodation e. Science room f. Workshops g. Laboratory room h. Home Economics i. Library j. Auditorium/gymnasium k. Toilet l. Water/drinking facilities
  • 28.
    8. Ancillary Services a.Medical-dental-nursing services b. Guidance and counselling c. Canteen Services d. Others 9. Textbooks and educational materials
  • 29.
    1. Teacher’s salaries 2.Cost of teachers’ training 3. Administrative cost 4. Instructional/training materials and facilities 5. Government subsidy by source to educational institutions and training programs 6. Capital cost on education for the construction of schools 7. Maintenance, rent and repair of schools 8. Cost of related services (or social expense)
  • 30.
    1. 2. 3. 4. Status Location by region Manpowerrequirements Budget – capital and operating 5. External assistance/ loans
  • 31.
    “The best kind ofmanagement, I believe, allows all employees to participate, so that each can contribute in his own capacity to the realization of a common goal. QUOTES FROM NOT FOR BREAD ALONE By: Konosuke Matsushita”
  • 32.
    “A good managershould never have to resort to lies or deceit. His integrity, furthermore, will remain solid even if he speaks the truth in every situation, even if circumstances change and he must say something quite different from what he said three months ago. Truth has a power of its own that never fails to move others.” QUOTES FROM NOT FOR BREAD ALONE By: Konosuke Matsushita