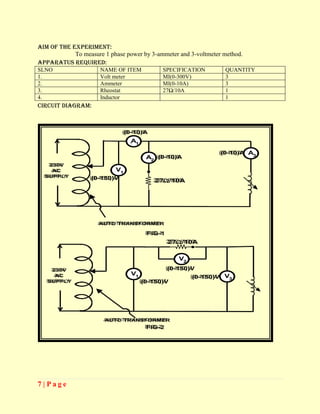
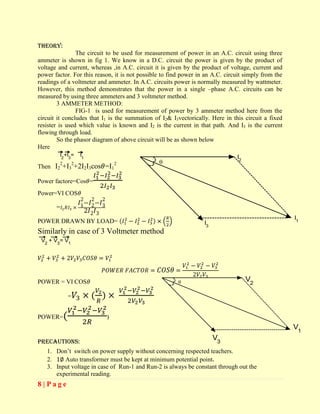
DESCRIPTION
Nowadays everybody has overhead tank at their homes, but the one who has a water tank above knows the kind of problems that they face. Water tank overflow is a common problem which leads to the wastage of water. Being electronics enthusiastic made a simple and handy circuit which will detect the water level and will raise an alarm upon getting the water tank full or a preset level.
This simple transistor based water level indicator circuit is very useful to indicate the water levels in a tank. Whenever tank gets filled, we get alerts on particular levels. Here we have created levels by alarms & we have added LEDs to indicate the level of water and one buzzer to indicate full level. When tanks gets filled completely we get beep sound from buzzer. So now we do not have to worry about overflow and water out anymore.
TEAM MEMBERS
SHAHRUKH JAVED
MOHAMMED AMIR
For more log on to: http://shahrukhjaved.webs.com/apps/blog/
E-mial: shahrukh.tjit14@gmail.com
These slides provide an elementary description of Power Electronics and its application domains. It also shows the different power devices and converters.
Inverter is a device which convert a DC input supply voltage into symmetric AC voltage of desired magnitude and frequency at the output side. It is also know as DC-AC converter.
Ideal and practical inverter have sinusoidal and no-sinusoidal waveforms at output respectively.
If the input dc is a voltage source, the inverter is called a Voltage Source Inverter (VSI). One can similarly think of a Current Source Inverter (CSI), where the input to the circuit is a current source. The VSI circuit has direct control over ‘output (ac) voltage’ whereas the CSI directly controls ‘output (ac) current.
Installation, Testing and Troubleshooting of TransformersLiving Online
This will provide you with practical knowledge (including tips, tricks and tools) covering the fundamentals of power transformers and their testing. It will greatly assist you in communicating more effectively with your electrical engineering colleagues. At the end of this workshop, participants will be familiar with the importance of transformer testing and their purpose, the different kinds of transformer tests and their procedures and the practical applications of principals applied in transformer operation and maintenance.
WHO SHOULD ATTEND?
This workshop will be appropriate for the following professionals:
Electrical engineers
Maintenance engineers
Maintenance supervisors
Power electricians
Power engineers
MORE INFORMATION: http://www.idc-online.com/content/installation-testing-and-troubleshooting-transformers-24
This manual consists of some important experiments of ac electrical machines.This is prepared by satish babu and lokesh.They are working as staff in usha rama college,telaprolu.
The manual is very useful for UG EEE students for the subject Power Electronics
By
M.MURUGANANDAM. M.E.,(Ph.D).,MIEEE.,MISTE,
Assistant Professor & Head / EIE,
Muthayammal Engineering College,
Rasipuram,
Namakkal-637 408.
Cell No: 9965768327
ELC 131 Lab 4 Series-Parallel and Bridge CircuitsIntroduction Vi.docxtoltonkendal
ELC 131 Lab 4: Series-Parallel and Bridge Circuits
Introduction: Virtually all electronic products are filled with components that are connected both in series and in parallel to form circuits that are coupled, or combined, in order to perform a desired function. The key component to analyzing series-parallel circuits is the ablility to recognize which components are connected in series and which components are connected in parallel.
Objectives: Upon completion of this lab exercise the student will be able to:
1. Identify which components are connected in series and which components are connected in parallel in a series-parallel circuit; calculate the total resistance of a simple series-parallel circuit.
2. Calculate and measure the current flow through and the voltage dropped across any component in a simple series-parallel circuit.
3. Calculate the node voltages of a ladder network.
4. Recognize a circuit as being a bridge configuration; determine the value of resistance that will balance a bridge circuit when the resistance of three arms is given.
5. Describe an operation of a bridge circuit used to sense a change in temperature.
Parts and Equipment:variable DC power supply and leads
DMM and meter leads
resistors, 1 W minimum: 360 Ω, 470 Ω, 680 Ω, 1 kΩ, 2.2 kΩ, 5.1 kΩ, 10 kΩ,
18 kΩ.
potentiometer, 25 kΩ
NTC thermistor, R0=10 kΩ
resistance substitution box
spring board and wires as needed
Prelab: Complete Section 1 Step 1 and Step 2.
Complete Section 2 Step 1.
Complete Section 3 Step 1.
Section 1: Series-Parallel Circuits
Before beginning the analysis of a series-parallel circuit, you must recognize which components are connected in parallel and which components are connected in series. Refer to the circuit of Figure 1. Resistors R2 and R3 are connected in parallel. Resistor R1 is in series with both the parallel combination of R2 and R3 and the source.
The current supplied by the source, IT, flows through R1. IT splits into two branch currents, IR2 and IR3, at node A. These two branch currents combine a node B and flow back into the source.
Figure 1: Series-Parallel Circuit Example
Calculating the total resistance is the first step in analyzing a series-parallel circuit. To find the total resistance of a series-parallel circuit, the circuit has to be simplified, one part at a time, until a simple series or a simple parallel circuit remains.
For the circuit of Figure 1, first the resistance of R2 in parallel with R3 is calculated as follows:
Now, the series-parallel circuit can be reduced to the simple series circuit shown in Figure 2.
Figure 2: Circuit of Figure 1 Reduced to a Series Circuit
The total resistance of the circuit of Figure 1 is calculated as follows:
The current supplied by the source is calculated using Ohm’s law as follows:
The voltage dropped across each of the resistors is calculated using Ohm’s law as follows:
The source current, IT, flows through R1.
The current through R2 is calculated .
To understand the basic working principle of a transformer.
To obtain the equivalent circuit parameters from Open circuit and Short circuit tests, and to estimate efficiency & regulation at various loads.
1.SINGLE PHASE HALF WAVE CONTROLLED CONVERTER WITH RESISTIVEINDUCTIVE LOAD
2 SINGLE PHASE FULLY CONTROLLED CONVERTER WITH RESISTIVEINDUCTIVE LOAD
3 SPEED CONTROL OF 3-PHASE SLIP RING (WOUND ROTOR) INDUCTION MOTOR
4 THYRISTORISED DRIVE FOR DC MOTOR WITH CLOSED LOOP CONTROL
5 THYRISTORISED DRIVE FOR PMDC MOTOR WITH SPEED MEASUREMENT & CLOSED LOOP CONTROL
6 SPEED MEASUREMENT OF PMDC MOTOR WITH CLOSED LOOP CONTROL
7 IGBT USING SINGLE 4 QUADRANT CHOPPER DRIVE FOR PMDC MOTOR WITH SPEED MEASUREMENT AND CLOSED LOOP AND CONTROL
8 SINGLE PHASE CYCLO CONVERTER BASED AC INDUCTION MOTOR CONTROLLER
9 THREE PHASE INPUT THYRISTORISED DRIVE 3HP DC MOTOR WITH CLOSED LOOP CONTROL
10 THREE PHASE INPUT IGBT DRIVE FOR 4 QUADRANT CHOPPER OF 3HP DC MOTOR WITH CLOSED LOOP CONTROL
A detailed presentation on Power meters which includes watt meter , poly phase power measurement , VAR meter, Energy (kilo-watt/hour) meter ,power factor meter
RMD24 | Retail media: hoe zet je dit in als je geen AH of Unilever bent? Heid...BBPMedia1
Grote partijen zijn al een tijdje onderweg met retail media. Ondertussen worden in dit domein ook de kansen zichtbaar voor andere spelers in de markt. Maar met die kansen ontstaan ook vragen: Zelf retail media worden of erop adverteren? In welke fase van de funnel past het en hoe integreer je het in een mediaplan? Wat is nu precies het verschil met marketplaces en Programmatic ads? In dit half uur beslechten we de dilemma's en krijg je antwoorden op wanneer het voor jou tijd is om de volgende stap te zetten.
Cracking the Workplace Discipline Code Main.pptxWorkforce Group
Cultivating and maintaining discipline within teams is a critical differentiator for successful organisations.
Forward-thinking leaders and business managers understand the impact that discipline has on organisational success. A disciplined workforce operates with clarity, focus, and a shared understanding of expectations, ultimately driving better results, optimising productivity, and facilitating seamless collaboration.
Although discipline is not a one-size-fits-all approach, it can help create a work environment that encourages personal growth and accountability rather than solely relying on punitive measures.
In this deck, you will learn the significance of workplace discipline for organisational success. You’ll also learn
• Four (4) workplace discipline methods you should consider
• The best and most practical approach to implementing workplace discipline.
• Three (3) key tips to maintain a disciplined workplace.
Unveiling the Secrets How Does Generative AI Work.pdfSam H
At its core, generative artificial intelligence relies on the concept of generative models, which serve as engines that churn out entirely new data resembling their training data. It is like a sculptor who has studied so many forms found in nature and then uses this knowledge to create sculptures from his imagination that have never been seen before anywhere else. If taken to cyberspace, gans work almost the same way.
What is the TDS Return Filing Due Date for FY 2024-25.pdfseoforlegalpillers
It is crucial for the taxpayers to understand about the TDS Return Filing Due Date, so that they can fulfill your TDS obligations efficiently. Taxpayers can avoid penalties by sticking to the deadlines and by accurate filing of TDS. Timely filing of TDS will make sure about the availability of tax credits. You can also seek the professional guidance of experts like Legal Pillers for timely filing of the TDS Return.
What are the main advantages of using HR recruiter services.pdfHumanResourceDimensi1
HR recruiter services offer top talents to companies according to their specific needs. They handle all recruitment tasks from job posting to onboarding and help companies concentrate on their business growth. With their expertise and years of experience, they streamline the hiring process and save time and resources for the company.
Remote sensing and monitoring are changing the mining industry for the better. These are providing innovative solutions to long-standing challenges. Those related to exploration, extraction, and overall environmental management by mining technology companies Odisha. These technologies make use of satellite imaging, aerial photography and sensors to collect data that might be inaccessible or from hazardous locations. With the use of this technology, mining operations are becoming increasingly efficient. Let us gain more insight into the key aspects associated with remote sensing and monitoring when it comes to mining.
As a business owner in Delaware, staying on top of your tax obligations is paramount, especially with the annual deadline for Delaware Franchise Tax looming on March 1. One such obligation is the annual Delaware Franchise Tax, which serves as a crucial requirement for maintaining your company’s legal standing within the state. While the prospect of handling tax matters may seem daunting, rest assured that the process can be straightforward with the right guidance. In this comprehensive guide, we’ll walk you through the steps of filing your Delaware Franchise Tax and provide insights to help you navigate the process effectively.
Attending a job Interview for B1 and B2 Englsih learnersErika906060
It is a sample of an interview for a business english class for pre-intermediate and intermediate english students with emphasis on the speking ability.
Putting the SPARK into Virtual Training.pptxCynthia Clay
This 60-minute webinar, sponsored by Adobe, was delivered for the Training Mag Network. It explored the five elements of SPARK: Storytelling, Purpose, Action, Relationships, and Kudos. Knowing how to tell a well-structured story is key to building long-term memory. Stating a clear purpose that doesn't take away from the discovery learning process is critical. Ensuring that people move from theory to practical application is imperative. Creating strong social learning is the key to commitment and engagement. Validating and affirming participants' comments is the way to create a positive learning environment.
Falcon stands out as a top-tier P2P Invoice Discounting platform in India, bridging esteemed blue-chip companies and eager investors. Our goal is to transform the investment landscape in India by establishing a comprehensive destination for borrowers and investors with diverse profiles and needs, all while minimizing risk. What sets Falcon apart is the elimination of intermediaries such as commercial banks and depository institutions, allowing investors to enjoy higher yields.
1. 1 | P a g e
Basic electrical labarotary
experiment
2. 2 | P a g e
3 phase
POWER
MEASURMENT
BY 2
WATTMETER
METHOD
3. 3 | P a g e
AIM OF THE EXPERIMENT:
To MeasureThree Phase Power By 2 Watt Meter Method. And calculate the percentage error.
APPARATUS REQUIRED:
THEORY:
A watt meter is an instrument for measuring power directly in a circuit. It has two coils
which when connected in series give the lower current range of the instrument and when
connected in parallel gives the double the range. The pressure circuit has a coil of high resistant.
The current coil is connected in series with the circuit in which power is measured and pressure
coil across the circuit. Two wattmeter’scan be used to measure power in a three phase 3-wire
circuit, by making the connections as shown in below. The load may be balanced or unbalanced.
The current coils are connected in series with two phases and the pressure coils between either
phase and the third. If one of the wattmeters tends to read negative, the current coil is reversed,
but reading of this instrument must be regarded as negative the total power consumed=
w1+w2(alzebric sum).
Here current through the current coil W1=IR and W2=IB
While potential difference across voltage coil of W1=VRY and W2=VBY
According to the phasor diagram given below
W1=VRYIRcos(30+ ) and W2=VBYIB cos(30- )
Here total power drawn by 3 phase load is W1+W2=VRYIRcos(30+ ) + VBYIB cos(30- )
Here VRY=VBY=VL
Then W1+W2= 3 VL I cos (after solving) which is 3 phase power
And W2-W1=VLI sin
Now tan =
Thus pf angle =
SLNO NAME OF ITEM SPECIFICATION QUANTITY
1. Watt meter 5A/600V 2
2. Volt meter MI(0-300V) 1
3. Ammeter MI(0-5A) 3
4. Rheostat 50Ω/5A 3
5. 3 phase variac 0-100V 1
4. 4 | P a g e
CIRCUIT DIAGRAM:
Precautions:
1. Don’t switch on power supply without concerning respected teachers.
2. 3 Auto transformer must be kept at minimum potential point before starting.
3. Resistant value of all rheostat should be kept at maximum postion.
PROCEDURE:
1. Connect as shown in fig.
2. Keep the rheostat resistance in maximum and slowely increase the output voltage of the
variac so that current in each line is about 4A or slightly less.
3. Then vary the resistant of the rehoastats so the load is deliberately unbalanced ,i.e the
current in each line becomes different. Corresponding phase voltages across the rehoastat
are VRN,VYN ,VBNrespectively.
4. Take reading of W1,W2 ,IR, IB,IY and VRN,VYN,VBN.
5. Decrease the output of the variacabd repeat the above procedure again.
5. 5 | P a g e
OBSERVATION:
SLNO W1 W2 IR IY IB VRN VYN VBN
1
2
……….
9
10
VERIFICATION:
SLNO W1+W2=P1 VRN×IR VYN×IY VBN×IB ∑VI=P2
1
2
…………
9
10
CONCLUSION:
To be written by student.
DISCUSSION:
1. Compare W1+W2& ∑VI , comment on the discrepancy if any.
2. Explain how will find the multiplying factor of the watt meter.
3. Verify theoritrically how the two wattmeter method gives the power measurement under
both balanced and unbalanced condition.
4. Discuss whether this method is suitable for three star and delta system and also four –
wire unbalanced load.
REFERENCES:
1. Refer CIRCUIT THEORY BY A. CHAKRABARTI (fifth edition) page-284.
6. 6 | P a g e
1 phase
Power
measurement
by 3 AMMETER
AND 3
VOLTMETER
METHOD
7. 7 | P a g e
AIM OF THE EXPERIMENT:
To measure 1 phase power by 3-ammeter and 3-voltmeter method.
APPARATUS REQUIRED:
CIRCUIT DIAGRAM:
SLNO NAME OF ITEM SPECIFICATION QUANTITY
1. Volt meter MI(0-300V) 3
2. Ammeter MI(0-10A) 3
3. Rheostat 27Ω/10A 1
4. Inductor 1
8. 8 | P a g e
THEORY:
The circuit to be used for measurement of power in an A.C. circuit using three
ammeter is shown in fig 1. We know in a D.C. circuit the power is given by the product of
voltage and current, whereas ,in A.C. circuit it is given by the product of voltage, current and
power factor. For this reason, it is not possible to find power in an A.C. circuit simply from the
readings of a voltmeter and ammeter. In A.C. circuits power is normally measured by wattmeter.
However, this method demonstrates that the power in a single –phase A.C. circuits can be
measured by using three ammeters and 3 voltmeter method.
3 AMMETER METHOD:
FIG-1 is used for measurement of power by 3 ammeter method here from the
circuit it concludes that I1 is the summation of I2& I3vectorically. Here in this circuit a fixed
resister is used which value is known and I2 is the current in that path. And I3 is the current
flowing through load.
So the phasor diagram of above circuit will be as shown below
Here
Then I2
2
+I3
2
+2I2I3cos =I1
2
Power factore=Cos =
Power=VI COS
=
POWER DRAWN BY LOAD=
Similarly in case of 3 Voltmeter method
POWER = VI COS
=
POWER= )
Precautions:
1. Don’t switch on power supply without concerning respected teachers.
2. Auto transformer must be kept at minimum potential point.
3. Input voltage in case of Run-1 and Run-2 is always be constant through out the
experimental reading.
9. 9 | P a g e
PROCEDURE:
RUN-1 : Measurement of power by three-ammeter method:
1. Connect as per the circuit diagram fig-1.
2. Give supply voltage 60V for measurement. If this voltage will more than 60V then the
inductor will make sound.
3. Vary the load impendence insteps and note down the reading of the meter in each case. Here
in each case I2 and V is constant in all over the experiment.
RUN-2: measurement of power by three-voltmeter method:
1. Connect as per the circuit diagram(fig-2)
2. Give supply voltage 120V for measurement. If this voltage will more than 120V then the
inductor will make sound.
3. Vary the load impendence (i.e inductor) in steps and note down the reading of the meters in
each case.Here V1 is constant in all over the experiment.
OBSERVATION AND CALCULATION:
RUN-1:
SLNO I1 in
Amp
I2 in
Amp
I3 in
Amp
V in Volt POWER P= POWERFACTOR
COS =
1
2
4
5
6
7
8
9
10
RUN-2:
SLNO V1 in
Volt
V2 in
Volt
V3inVolt I in Amp POWER P= POWERFACTOR
COS =
1
2
3
4
5
6
7
8
9
10
10. 10 | P a g e
CONCLUSION:
To be written by student.
DISCUSSIONS:
1. If the load is capacitive in nature, whether there will be any change in the expression of
power factor in both case.
11. 11 | P a g e
TESTING OF
1 ENERGY
METER AT
(0.5,0.866
AND 1.0 PF)
12. 12 | P a g e
AIM OF THE EXPERIMENT:
Testing of single 1 energy meter in different power factor 0.5 ,0.866 and unity power
factor.
APPARATUS REQUIRED:
SLNO NAME OF APPARATUS RANGE AND TYPE QUANTITY
1 Voltmeter 0-300(MI) 3
2 Ammeter 0-5/10A(MI) 1
3 1 variac 0-300V(MI) 2
4 1 energy meter 1500 RPK 1
5 Voltmeter 0-600V(MI) 1
6 Tipple Pole Iron Clad Switch 1
THEORY:
1. ENERGY METER: it is used to calculate energy (kilo watt hour) at each instant of time
so this type of instrument is indicating type instrument.
2. WHY TESTING: In all supply meters a meter constant is made in them. This
constant is expressed in revolutions per kilowatt hour (RPK) usually. Full load current
and line voltage for which the meter is intended, are also stated. From these data the
number of revolutions per minute which the meter should make, when tested with a
certain fraction of its full load can be calculated. The number of revoltions per minute
which it actually does make when tested at this load is then observed and the error is
calculated.
3. TESTING OF 1 ENERGY METER: for testing of 1∅ energy meter in
different power factor is done by help of two phase that is 2400
displaced. Here R phase
and B phase are 2400
displaced. In the arrangement given in circuit diagram pressure coil
of energy meter is always taking voltage from R phase only and current coil of energy
meter has the provision for taking current from R phase and B phase simultaneously or
individually.
When VRN =0 and VBN has some voltage then current coil of energy meter will
take current from B phase. So power factor angle=600
as shown below phasor
diagram.
And Power factor=cos600
=0.5
13. 13 | P a g e
When VBN has equal voltage withVRN then current coil of energy meter will take current
from B phase and R phase equally. So power factor angle=300
as shown below phasor
diagram. Power factor=cos300
=0.866
When VBN =0 and VRN has some voltage then current coil of energy meter will take current
from R phase. So power factor angle=00
as shown below phasor diagram. And Power
factor=cos00
=1
14. 14 | P a g e
CIRCUIT DIAGRAM
Precautions:
1. Do not switch on power supply without concerning respected teachers.
2. Auto transformer must be kept at minimum potential point.
3. See the revolution of energy meter if it rotates reversely then change the terminal of
pressure coil.
PROCEDURE:
1. Make connections according to circuit diagram.
2. For testing at loads at different power factor vary the auto transformer positions. Take
reading of all voltmeters and ammeters. Calculate the power factor by drawing the vector
diagrams.
15. 15 | P a g e
OBSERVATION:
SLNO
COS
V1 VRN VBN VPC I R.P.M R.P.H VPCICCOS =
(P1)
=P2
PERCENT
AGE
ERROR=
1
2
3
4
5
6
7
8
9
REPORT:
1. Find error for each setting of auto transformer (each power factor).
2. Plot a curve between error vs power factors and find error at p.f 0.5,0.866 and 1.0
CONCLUSION:
To be written by student.
DISCUSSION AND QUESTIONS:
Discuss as the result of the experiment question
1. How do you vary the pf using two auto-transformers.
2. What is the basic difference in testing DC and AC energy meters.
3. How many terminals does an energy meter has.
4. Why energymeter is tested at different powerfactor.
REFERENCES
Books:
1. Fundamentals of Electrical engineering by Ashfaq Husain.
2. A Textbook of Electrical Technology by B.L Thereja.
3. Electrical Science by J. B. Gupta
URLS:
1.www.nptel.iitm.ac.in
2. www.electronics-tutorials.ws/dccircuits
3 www.openbookproject.net
4.www.mhhe.com
5.www.opamp-electronics.com
16. 16 | P a g e
VOLTAGE-
CURRENT
RELATIONSHIPS
AND LOCUS
DIAGRAM OF
A SERIES R-L
CIRCUIT
17. 17 | P a g e
AIM OF THE EXPERIMENT:
To represent the voltage and current relationship of a series R-L circuit and draw the
locus diagram for varying resistance and fixed inductance.
APPARATUS REQUIRED:
SLNO NAME OF THE APPARATUS RANGE AND TYPE QUANTITY
1 AUTO TRANSFORMER 0-230V(AC) 1
2 VOLTMETER 0-300V MI TYPE 3
3 AMMETER 0-5/10A 1
4 LAMPLOAD 3KW 1
5 WATTMETER LPF 1
6 CHOKE 0.32H 1
CIRCUIT DIAGRAM:
THEORY:
In a series RL circuit, if the inductance l is kept constant and the resistance R be varied
and if a phasor diagram be drawn with the applied voltage V1phasor as the reference(V1 is drawn
along x axis) then the locus of the tips of the current phasor is given by the following equation.
IX
2
+ (IY+ )2
= )2
Where XL= inductive reactance in ohms(of the choke coil)
Ix= in phase component of current.
Iy= quadrature component of current
This is a semi circle with as diameter.which is known as current locus.
If VR and VL be the resistive and inductive drops respectively, the
VR
2
+VL
2
=V1
2
So that the locus of the tip of the VRphasor is a semicircle with V1phasor as the diameter.which
is known as voltage locus.
18. 18 | P a g e
Precautions:
1. Don’t switch on power supply without concerning respected teachers.
2. Auto transformer must be kept at minimum potential point.
3. Primary voltage that is V1 should always be constant through out the experiment.
PROCEDURE:
Make connections as shown in the circuit diagram. Adjust the value of the supply voltage
V1 to a definite value with the help of variac. Take readings of ammeter, voltmeter and
wattmeters, change the current in the circuit by putting on more lamps and take several readings
till all the lamps are on. The applied voltage V1 must be maintained constant for each reading.
OBSERVATIONS:
SLNO V1 I V2 V3 W LOAD
1
2
3
4
5
6
7
8
CALCULATIONS:
Make calculations in tabular form shown below:
RL= R= VR=I(R+RL) VRL= VL= XL= =
1
2
3
4
5
6
7
8
GRAPHS:
1. Draw the two theoretical semi-circles
a. Voltage drops locus and
b. For current locus i.e semicircles with V1 as diameter(V1 is along Y-axis) and another
semicircle with phasor ( which is at 900
lagging w.r.t v1phasor) as diameter.
2. From the calculations made above draw the phasorsVR , VL.
See if the tips of the voltage drop phasor and current phasor lie on the theoretical
locus diagram.
19. 19 | P a g e
CONCLUSION:
To be written by student.
DISCUSSION question:
1. Discuss why a low power factor watt meter was used by you.
2. What do you understand by the term power factor in reference to a.c. circuits ?.
3. What is the importance of power factor ?
CURRENT LOCUS
VOLTAGE LOCUS
20. 20 | P a g e
OPEN CIRCUIT
AND SHORT
CIRCUIT TEST
ON 1
TRANSFORMER
21. 21 | P a g e
AIM OF THE EXPERIMENT:
To perform the open circuit and short circuit test on a single phase transformer and to
draw the equivalent circuit after determining its constants.
APPARATUS REQUIRED:
SLNO NAME OF THE EXPERIMENT RANGE AND TYPE QUANTITY
1 Single phase transformer 3KVA,230/230V,50 HZ 1
2 Wattmeter 2.5/5A LPF 1
3 Wattmeter 10/20A UPF 1
4 Ammeter 0-1A 1
5 Ammeter 0-20A 1
6 Voltmeter 0-300V 1
7 Voltmeter 0-30/75V 1
8 1 variac 0-300V,15A 1
THEORY:
The performance of a transformer can be calculated on the basis of its equivalent circuit
which contains four main parameters, the equivalent resistance R01 as referred to primary( or
secondary R02), the equivalent leakage reactance X01 as referred to primary, the core-loss
conductance G0 and the magnetizing susceptance B0. These constants or parameters can be easily
determined by two test i.e. Open circuit test and short circuit test. These are very economical and
convenient, because they furnish the required information without actually loading the
transformer. In fact, the testing of very large a.c machinery consists of running two test similar
to the open and short circuit test of a transformer.
The purpose of this test is to determine no load loss or core loss and no load I0 which is
helpful in finding X0 and R0. One winding of the transformer whichever is convenient but
usually high voltage winding is left open and the other is connected to its supply of normal
voltage and frequency. A wattmeter(W), Voltmeter (V) and ammeter (A) are connected in the
low voltage winding i.e. primary winding in the present case. With normal voltage applied to the
primary, normal flux will be setup in the core, hence normal iron losses will occur which are
recorded by the wattmeter. As the primary no load current I0 is small, Cu loss is negligibly small
in primary and nill in secondary. Hence, the wattmeter reading represents practically the core
loss under no load condition.
For short circuit test, one winding usually the low voltage winding, is solidly short-
circuited by a thick conductor ( or through an ammeter which may serve the additional purpose
of indicating rated load current).
A low voltage ( usually 5 to 10% of normal primary voltage) at correct frequency (though for Cu
losses it is not essential) is applied to the primary and is cautiously increased ill full- load current
are flowing both in primary and secondary( as indicated by the respective ammeters).
Since, in this test, the applied voltage is a small percentage of the normal voltage, the mutual flux
ø produced is also a small percentage of its normal value. Hence, core losses are very small with
the result that the wattmeter reading represents the full load Cu loss or i2 R loss for the whole
transformer i.e. both primary Cu loss and secondary Cu loss. The equivalent circuit of the
22. 22 | P a g e
transformer under short- circuit condition. If Vsc is the voltage required to circulate rated load
currents, then Z01= Vsc/I1
a two winding transformer can be represented by means of an equivalent circuit as shown
below
Precautions:
1. Don’t switch on power supply without concerning respected teachers.
2. Auto transformer must be kept at minimum potential point. Before switch on the
experiment.
CIRCUIT DIAGRAM:
23. 23 | P a g e
OPEN CIRCUIT TEST PROCEDURE:
1. Connect circuit as shown in the circuit diagram.open circuit the secondary and apply full
load voltage to the primary through a variac. The cupper loss is negligible since there is
only no load current is flowing.hence power consumed are the core losses of the core.
2. Note voltmeter and ammeter and wattmeter reading.
Observation table:
SLNO V I0 W IW= IM= COS
CALCULATION:
See the no load phasor diagram below
W=VI0COS
IW= , IM= , ,
SHORT CIRCUIT TEST PROCEDURE:
1. Connect as shown in the circuit diagram. Short circuit the secondary and apply a low
voltage to the primary through a auto transformer. The iron losses are negligible
since the flux will be very low on account of the primary and secondary.
2. Increase the voltage gradually till full load current flows in the primary. Note
voltmeter and ammeter and wattmeter reading.
Observation:
SL.NO. V I Wc
24. 24 | P a g e
Calculations:
Let the total equivalent resistance of primary and secondary referred to primary side be
R1 ohms and the total equivalent leakage reactance referred to primary side be X1 ohms.
Wc = I2
R1
Hence R1 = Wc / I2
Also V /I = Z1 and X1 = ohms.
Conclusion:
1. Now draw the equivalent circuit.
2. Plot a graph of copper loss versus load current (short circuit current). What is the
shape of the curve?
3. Determine the regulation of the transformer at various loads for an assumed load
power factor of 0.8 lagging.
Regulation percent = X 100
Where Vo = secondary no load voltage.
Vt = secondary full load voltage.
4. Plot a curve or regulation versus load current
Discussion:
1. Why iron is chosen as the material for the core of the transformer? Why not we use
aluminium?
2. What is normally the efficiency of a transformer to be?
26. 26 | P a g e
AIM OF THE EXPERIMENT:
To study load test on single phase transformer and determine efficiency and voltage
regulation of a single phase transformer.
APPARATUS REQUIRED:
SLNO ITEM NAME RANGE/TYPE QUANTITY
1 1 Transformer 230/230,3KVA 1
2 1 Autotransformer 0-270V 1
3 Wattmeter 150/300/600V,10/20A dynamometer type,UPF 2
4 Ammeter 0-5/10/20 ,moving iron(MI) 2
5 Voltmeter 0-150/300/600V (MI) 2
6 lamp load 3 KW 1
CIRCUIT DIAGRAM:
THEORY:
When the secondary winding of a transformer is completed through a load and a voltage
Vis applied to the primary winding. The transformer is said to be operate under load condition.
Under this condition transformer cupper loss increases with increase in current .due to that
efficiency changes. At half load efficiencies reaches to maximum it gradually decreases when
further load increases. This is because at half load cu loss is less and iron loss is also less but
below half load iron loss will more this result efficiency is less.This situation happens when
transformer is distribution transformer.When load increases beyond half load cupper loss will
increase which again reduces the efficiency.
27. 27 | P a g e
Precautions:
3. Do not switch on supply without concerning respected teachers.
4. Auto transformer must be kept at minimum potential point.
5. Primary voltage that is V1 should always be constant throughout the experiment.
PROCEDURE:
1. Make the connection as shown in the diagram keeping the auto-transformer in zero
position and all switches and load is in off position.
2. Switch on the AC supply and then vary the voltage up to rated voltage of the transformer.
3. Now, start loading the transformer by putting on load switch on. So that a suitable current
is obtained.
4. And then change the load and note down the reading of all the instrument.
5. Here the primary voltage of the transformer should always be in rated voltage
irrespective of load.
SAMPLE CALCULATION:
Percentage Efficiency=
=
28. 28 | P a g e
Voltage regulation=
Here V0=V1
And VL=V2
OBSERVATION TABLE:
SLNO LOAD V1 I1 W1 V2 I2 W2
×100
VOLTAGE
REGULATION=
CONCLUSION:
To be written by student.
DISCUSSION QUESTION:
29. 29 | P a g e
THEVeNIN
AND
SUPERPOSITION
THEOREM
VERIFICATION
EXPERIMENT
30. 30 | P a g e
AIM OF THE EXPERIMENT:
To verify thievenin and superposition theorem .
APPARATUS REQUIRED:
SLNO NAME OF ITEM SPECIFICATION QUANTITY
1. Rheostat 27Ω/10A 3
2. Rheostat 10Ω/8A 1
3. Volt meter MC(0-15V) 1
4. Ammeter MC(0-1A) 3
5. Dc source 0-20V 2
Vefification of thevnine theorem RL+ Rin
THEORY OF THEVENIN THEOREM:
In a passive ,linear,bilateralnetwork,the current in any element is given by the ratio of
the open circuit voltage(obtained by open circuiting the element under consideration) to the
sum of the resistance of the element and internal resistant,where the internal resistant is
obtained by looking across to terminals of the element with the element removed and with all
sources assumed to be dead.
Then IL=Voc
Where IL is the current in the element RL
Voc=open circuit voltage across the element RL with RL removed.
Rin=internal resistant across the terminal to which RL is connected with (RL removed and all
sources made dead). This is thevenine’s theorem. In this experiment, we find out the current in
a resistor element RL in the following network, using thevenine’s theorem.
CIRCUIT DIAGRAM:
31. 31 | P a g e
PROCEDURE:
1. Connect as in figure.A
2. When the D.P.D.T switch is closed on connecting terminals 1-1’ to 2-2, the ammeter A
reads IL’ amperes. Which is the current in RL found experimentally.
3. Make use of the thevenine’s theorem to find IL as defined earlier.
4. Throw the D.P.D.T switch connecting terminals 1-1’ and 3-3’ in figure-A the voltmeter
reads Voc volts, the required value.
5. To find the value of Rin and RL (defined earlier) connect as shown in figure-B
a. The D.P.D.T switch is closed connecting 1-1 and 2-2 (figure-B) and the voltmeter
respectively.V1/I1 gives the value of RL.
b. Close the D.P.D.T switch connecting 1-1 and 3-3(fig-B) and the current I2 and
voltage V2 are read on the ammeter and voltmeter respectively .V2/I2 gives the
value of Rin.
OBSERVATION:
SLNO IL
’
VOC I1 V1 I2 V2 ERROR=
RESULT:
The percentage error is found to be__%.
DISCUSSION:
The % error is found to be in the range within 10%.The percentage error is due to observational
errors, tolerance errors, calibration of instruments.Morover,it can be seen that thevenintheorm
can’t be applied to network only containing dependent sources
DISCUSSION QUESTION:
1. What are the advantages and disadvantages of using theveninTheorm?
2. Why Thevenintheorm not applied to non-linear circuis?
3. Can Thevenintheorm be applied to circuit having A.C sources?Ifyes,then what will be the
difference.
4. How Thevnintheorm be applied to network containing both independent and
dependent sources?
32. 32 | P a g e
THEORY OF SUPERPOSITION THEOREM
Superposition theorem
A current in a particular branch due to many sources acting in a circuit can v=be
obtaoined by adding the current due to the individual sources acting one at a time with the
remaining sources dead.
EXPLANATION
Consider a simple circuit:
To calculate current I1,I2 or I3 using superposition theorem, ignoring internal resistantces of the
two sources.
1. First Vasources acting with Vb source dead.
Corresponding circuit diagram is :
Vb source is replaced by a zero resistance path between point C and O. The currents are I1a, I2a
and I3a is calculated
2. Next VbactsVa is dead. Source Vahas been replaced by zero resistance path between the
points A and O. The currents are I1b, I2b and I3b is calculated.
33. 33 | P a g e
The currents are given by :
I1=I1a+I1b
I2=I2a+I2b
I3=I3a+I3b
PROCEDURE:
1. Connect the circuit as shown below in fig-1.
2. Keep the rheostats to give certain ohmic values R1,R2 and R3.
3. Note the readings of the three ammeters,connected to read I1,I2, and I3 in fig-1
4. Disconnect the voltage source VB,(VA sources acting) and connect the points A and O
with a wire.Note the ammeter readings.
5. Disconnect the source VA,(VB source acting ) and connect the points A and O with a wire
. Note the ammeter readings.
6. Add the currents obtained in step (4) and (5) and compare with the currents obtained in
step(3) , to verify the theorem .
7. Vary R1 ,R2 and R3 suitably repeat step (3) to (6) take no. Of reading.
OBSERVATION TABLE:
SLNO SOURCE
ACTING
CURRENT IN AMPS
I1 I2 I3 I1a I2a I3a I1b I2b I3b
1 VA
2 VB
3 VA AND
VB
DISCUSSION QUESTION:
1.What are the advantages and disadvantages of using superposition Theorm?
2.Why superposition theorm not applied to non-linear circuis?
3.Can superposition theorm be applied o circuit having A.C sources?Ifyes,then what will
be the difference.
4.How superposition theorm be applied to network containing both independent and
dependent sources?
REFERENCES:
Books:
1. Fundamentals of Electrical engineering by Ashfaq Husain.
4. A Textbook of Electrical Technology by B.L Thereja.
5. Electrical Science by J. B. Gupta
URLS:
1.www.brighthub.com
2.www.allaboutcircuits.com
3. www.howstuffworks.com
4. www.nptel.iitm.ac.in
34. 34 | P a g e
Magnetization
charterstic
of
separetly
excited dc
generator
35. 35 | P a g e
AIM OF THE EXPERIMENT
To find Magnetization characteristic of a separately excited DC generator.
Apparatus required:
SLNO NAME OF APPARATUS RANGE QUANTITY
1 moving coil type ammeter 0-3A 1
2 moving coil type voltmeter 0-300V 1
3 rheostats 0-300ohms.2Amp 2
4 Rheostat 50 Ohms,5Amp 1
5 Tachometer 0-10000RPM 1
6 A DC Generator Coupled to DC
motor Set
7.5KW,1500
RPM,230V,31.2Amp
1
Theory:
Magnetization curve is also called the open circuit characteristics (o.c.c) .It is the plot
between no load or open circuit armature terminal voltage (the induce e.m.f) versus the field
current at a constant speed. Hence the name o.c.c.It is also called magnetization characteristic
because the induce emf α flux and flux density and the field current is α H and hence the curve
is a B-H curve.
PRECAUTION:
1. Do not switch on the power supply without concerning respected teacher.
2. Do not make rheostat position of armature to minimum and field rheostat position to
maximum at the time of starting.
Circuit Diagram
36. 36 | P a g e
PROCEDURE:
Make connection as shown in the diagram. Run the motor and bring it up to rated speed.
With zero excitation in the field circuit, take the voltmeter reading. This represents the residual
magnetism. Increase the excitation slowly and take reading of ammeter and voltmeter after
adjusting the speed constant. While making the field current adjustments do not retrace.
Continue till the induce voltage is more than the rated value.
2. Reduce the excitation and take reading of ammeter and voltmeter at constant speed –Do not
retrace while reducing excitation.
Run II: - Keep the excitation of the generator constant at a partial value and vary the
speed.
Observations:-
Run I: - Speed constant
SL NO. If increasing V If decreasing V
Run II:- Excitation constant
SL NO. N V
GRAPHS:
1. Plot the curves of induced voltage versus field current for increasing and decreasing
excitation.
2. Plot the curve of induce voltage vs. speed taking care to choose the scale such as point (0,
0) is included in the graph paper.
DISCUSSION QUESTION:
1. The shape of the open circuit characteristic curve? What do you mean by saturation?
2. Can you obtain the o.c.c from the experimentally determined o.c.c for a different speed? If so, plot
the o.c.c for a speed which is half the value at which you performed the experiment.
3. Why does the induced voltage Vs speed curve pass through (0, 0) but not the induce voltage Vs
excitation curve?
4. Explain the effect of variation of the field resistance.
5. Discuss effect of variation of speed on build up voltage.
6. List the condition to be satisfied for voltage build up of a DC generator.
37. 37 | P a g e
Speed
control of DC
Motor using
armature
voltage and
field current
method
38. 38 | P a g e
AIM OF THE EXPERIMENT
To observe Speed control of DC Motor using
(A) Variation of armature circuit resistance.
(B) Variation of field circuit resistance.
Apparatus required:
SLNO NAME OF APPARATUS RANGE QUANTITY
1 moving coil type ammeter 0-5A 1
2 moving coil type ammeter 0-3A 1
2 moving coil type voltmeter 0-300V 1
3 Rheostats 0-300ohms.2Amp 1
4 Rheostat 50 Ohms,5Amp 1
5 Tachometer 0-10000RPM 1
6 DC shunt Motor With Starter 7.5HP,1200RPM,220V,30Amp 1
7 S.P.S.T switch 1
Theory:
If V is the applied voltage across the motor terminals, Ebis the back emfdeveloped,then V
= Eb+ IaRa. Where Iaand Ra the current and resistance in the armature circuit respectively.
But, Eb= = K .Hence V =K + IaRa .i.e. N = K ᶦ
This shows that:-
i. An increase in the IaRadrop will decrease the value of speed if V remains constant.
ii. Speed varies inversely as the field flux and hence varies inversely as the exciting current, if
below saturation. Thus, by increasing the resistance in the armature circuit, a motor can be
operated at speed below normal. By increasing the resistance in the field circuit, a motor can be
operated at speeds above normal.
Circuit diagram :
39. 39 | P a g e
Procedure:-
CASE A:
Speed control by variation of armature circuit resistance.
i. Connect as shown. Make R and Rf zero at the time of starting the motor (which is run on no
load) with the motor starter.
ii. The motor is on load. Adjust Rf and bring the motor to the rated speed. Note the terminal
voltage, V and normal excitation which correspond to the rated speed of motor. Keep Ifconstant
throughout, During starting, ammeter A2 may be by passed.
iii. With the exciting current kept constant, increase R in steps, at each step note the value of V
and the speed in r.p.m.
CASE B: -
Speed control by variation of field circuit resistance.
i. Run the motor as before and bring it to the rated speed at no load.
ii.Cut out the field regulating resistance, Rfin steps and note the speed and the field current ,If in
each case . Keep the voltage across the armature constant. Take reading for decreasing values of
speed by increasing field current.
iii. Take reading for increasing values of speed corresponding to same values of If as in 2.
iv. Measure Ra after test.
Observations:-
Case A If =
Ra=
SL.NO. Speed in R.P.M Voltage across Arm.
Case B: - Voltage across armature =.............................................
SL.NO. If Speed in R.P.M with
decreasing If
Speed in R.P.M with increasing If
Graphs:
Case A:- plot a graph between speed along y-axis and volts across arm. Along x-axis.
CaseB: - Plot a graph between speed along y –axis and exciting current If along x-axis.
Discussion question:
1.compare the two methods and discuss the advantages and disadvantages of each method.
2. If, by chance, there be a loose contacts in the field circuits rheostat what will be the
consequences .What precautions do you take to avoid these consequences.
3. Discuss the graph you obtained.