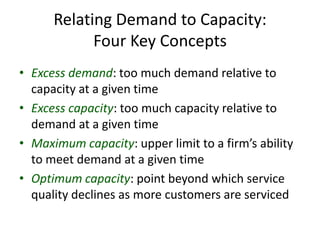
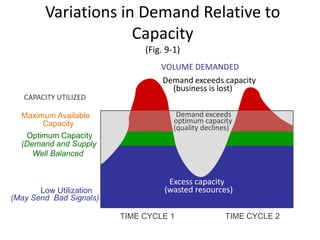
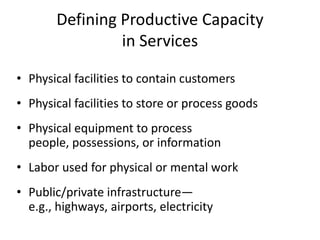
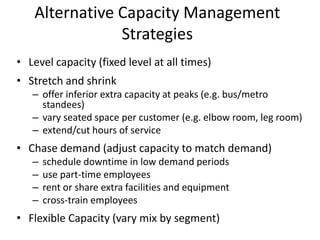
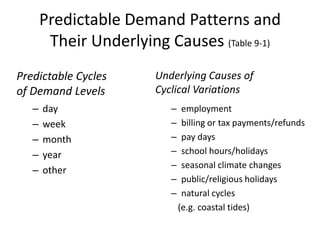
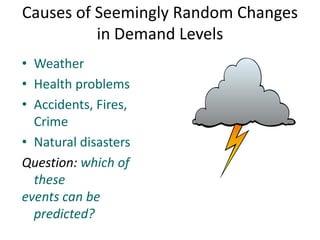
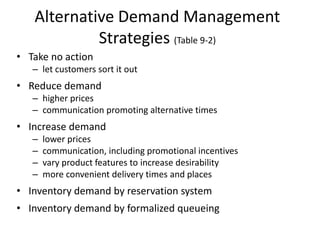
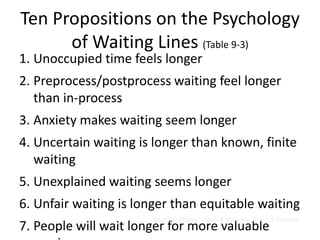
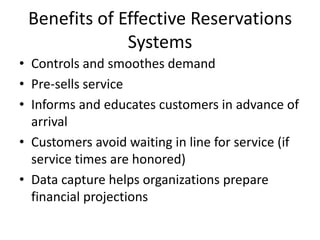
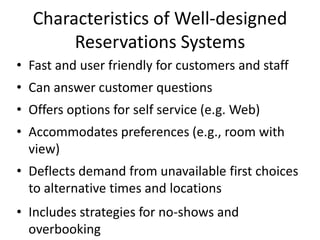
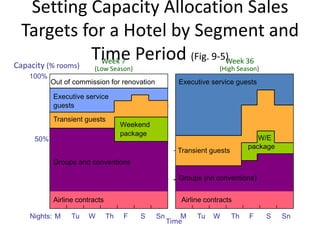
Chapter 9


Balancing Demand
  and Capacity
Relating Demand to Capacity:
            Four Key Concepts
• Excess demand: too much demand relative to
  capacity at a given time
• Excess capacity: too much capacity relative to
  demand at a given time
• Maximum capacity: upper limit to a firm’s ability
  to meet demand at a given time
• Optimum capacity: point beyond which service
  quality declines as more customers are serviced
Variations in Demand Relative to
                     Capacity
                              (Fig. 9-1)
                                  VOLUME DEMANDED
                                  Demand exceeds capacity
                                    (business is lost)
   CAPACITY UTILIZED

  Maximum Available                    Demand exceeds
       Capacity                       optimum capacity
                                      (quality declines)
   Optimum Capacity
  (Demand and Supply
     Well Balanced


                                    Excess capacity
       Low Utilization             (wasted resources)
(May Send Bad Signals)

                         TIME CYCLE 1                TIME CYCLE 2
Defining Productive Capacity
                in Services

• Physical facilities to contain customers
• Physical facilities to store or process goods
• Physical equipment to process
  people, possessions, or information
• Labor used for physical or mental work
• Public/private infrastructure—
  e.g., highways, airports, electricity
Alternative Capacity Management
               Strategies
• Level capacity (fixed level at all times)
• Stretch and shrink
   – offer inferior extra capacity at peaks (e.g. bus/metro
     standees)
   – vary seated space per customer (e.g. elbow room, leg room)
   – extend/cut hours of service
• Chase demand (adjust capacity to match demand)
   –   schedule downtime in low demand periods
   –   use part-time employees
   –   rent or share extra facilities and equipment
   –   cross-train employees
• Flexible Capacity (vary mix by segment)
Predictable Demand Patterns and
        Their Underlying Causes (Table 9-1)
Predictable Cycles      Underlying Causes of
of Demand Levels        Cyclical Variations
   –   day                 –    employment
   –   week                –    billing or tax payments/refunds
   –   month               –    pay days
   –   year                –    school hours/holidays
                           –    seasonal climate changes
   –   other
                           –    public/religious holidays
                           –    natural cycles
                               (e.g. coastal tides)
Causes of Seemingly Random Changes
          in Demand Levels
• Weather
• Health problems
• Accidents, Fires,
  Crime
• Natural disasters
Question: which of
  these
events can be
  predicted?
Alternative Demand Management
            Strategies (Table 9-2)
• Take no action
   – let customers sort it out
• Reduce demand
   – higher prices
   – communication promoting alternative times
• Increase demand
   –   lower prices
   –   communication, including promotional incentives
   –   vary product features to increase desirability
   –   more convenient delivery times and places
• Inventory demand by reservation system
• Inventory demand by formalized queueing
Hotel Room Demand Curves by
                 Segment
            and by Season (Fig. 9-2)
 Price per
Room Night
                Bl    Bh
           Th                           Bh = business travelers in high season
                                        Bl = business travelers in low season
      Tl                                Th = tourist in high season

                                        Tl = tourist in low season


                                         Th
                           Bh
                     Bl         Tl
     Quantity of Rooms Demanded at Each Price
     by Travelers in Each Segment in Each Season          Note: hypothetical example
Avoiding Burdensome Waits for
             Customers
• Add extra capacity so that demand can be met at
  most times (problem: may add too many costs)
• Rethink design of queuing system to give priority
  to certain customers or transactions
• Redesign processes to shorten transaction time
• Manage customer behavior and perceptions of
  wait
• Install a reservations system
Alternative Queuing Configurations
                               (Fig. 9-4)

 Single line, single server, single stage

 Single line, single servers at sequential stages


 Parallel lines to multiple servers


 Designated lines to designated servers


 Single line to multiple servers (“snake”)

                                                                         21
                                                                29
                                                         28
 “Take a number” (single or multiple servers)        30        25
                                                                         20

                                                          26             24
                                                    31              27
                                                          32             23
Tailoring Queuing Systems to Market
 Segments: Criteria for Allocation to
           Designated Lines
• Urgency of job
  – emergencies vs. non-emergencies
• Duration of service transaction
  – number of items to transact
  – complexity of task
• Payment of premium price
  – First class vs. economy
• Importance of customer
  – frequent users/loyal customers vs. others
Ten Propositions on the Psychology
      of Waiting Lines (Table 9-3)
1. Unoccupied time feels longer
2. Preprocess/postprocess waiting feel longer
   than in-process
3. Anxiety makes waiting seem longer
4. Uncertain waiting is longer than known, finite
   waiting
5. Unexplained waiting seems longer
6. Unfair waiting is longer than equitable waiting
                       Sources: Maister; Davis & Heineke; Jones & Peppiatt
7. People will wait longer for more valuable
Benefits of Effective Reservations
              Systems
• Controls and smoothes demand
• Pre-sells service
• Informs and educates customers in advance of
  arrival
• Customers avoid waiting in line for service (if
  service times are honored)
• Data capture helps organizations prepare
  financial projections
Characteristics of Well-designed
       Reservations Systems
• Fast and user friendly for customers and staff
• Can answer customer questions
• Offers options for self service (e.g. Web)
• Accommodates preferences (e.g., room with
  view)
• Deflects demand from unavailable first choices
  to alternative times and locations
• Includes strategies for no-shows and
  overbooking
Setting Capacity Allocation Sales
  Targets for a Hotel by Segment and
Capacity (% rooms)
                   Time Period (Fig. 9-5)Week 36
                    Week 7
                      (Low Season)                              (High Season)
  100%
         Out of commission for renovation           Executive service guests

         Executive service
         guests
         Transient guests
                                  Weekend
                                  package
   50%                                                                        W/E
                                                                           package
                                                   Transient guests
         Groups and conventions

                                                    Groups (no conventions)


         Airline contracts                          Airline contracts

  Nights: M    Tu   W        Th   F   S     Sn      M    Tu   W       Th   F    S    Sn
                                                 Time
Information Needed for Demand
   and Capacity Management
           Strategies
• Historical data on demand level and
  composition, noting responses to marketing
  variables
• Demand forecasts by segment under specified
  conditions
• Fixed and variable cost data, profitability of
  incremental sales
• Site-by-site demand variations

Utsav Mahendra : Balancing Demand and Capacity

  • 1.
  • 2.
    Relating Demand toCapacity: Four Key Concepts • Excess demand: too much demand relative to capacity at a given time • Excess capacity: too much capacity relative to demand at a given time • Maximum capacity: upper limit to a firm’s ability to meet demand at a given time • Optimum capacity: point beyond which service quality declines as more customers are serviced
  • 3.
    Variations in DemandRelative to Capacity (Fig. 9-1) VOLUME DEMANDED Demand exceeds capacity (business is lost) CAPACITY UTILIZED Maximum Available Demand exceeds Capacity optimum capacity (quality declines) Optimum Capacity (Demand and Supply Well Balanced Excess capacity Low Utilization (wasted resources) (May Send Bad Signals) TIME CYCLE 1 TIME CYCLE 2
  • 4.
    Defining Productive Capacity in Services • Physical facilities to contain customers • Physical facilities to store or process goods • Physical equipment to process people, possessions, or information • Labor used for physical or mental work • Public/private infrastructure— e.g., highways, airports, electricity
  • 5.
    Alternative Capacity Management Strategies • Level capacity (fixed level at all times) • Stretch and shrink – offer inferior extra capacity at peaks (e.g. bus/metro standees) – vary seated space per customer (e.g. elbow room, leg room) – extend/cut hours of service • Chase demand (adjust capacity to match demand) – schedule downtime in low demand periods – use part-time employees – rent or share extra facilities and equipment – cross-train employees • Flexible Capacity (vary mix by segment)
  • 6.
    Predictable Demand Patternsand Their Underlying Causes (Table 9-1) Predictable Cycles Underlying Causes of of Demand Levels Cyclical Variations – day – employment – week – billing or tax payments/refunds – month – pay days – year – school hours/holidays – seasonal climate changes – other – public/religious holidays – natural cycles (e.g. coastal tides)
  • 7.
    Causes of SeeminglyRandom Changes in Demand Levels • Weather • Health problems • Accidents, Fires, Crime • Natural disasters Question: which of these events can be predicted?
  • 8.
    Alternative Demand Management Strategies (Table 9-2) • Take no action – let customers sort it out • Reduce demand – higher prices – communication promoting alternative times • Increase demand – lower prices – communication, including promotional incentives – vary product features to increase desirability – more convenient delivery times and places • Inventory demand by reservation system • Inventory demand by formalized queueing
  • 9.
    Hotel Room DemandCurves by Segment and by Season (Fig. 9-2) Price per Room Night Bl Bh Th Bh = business travelers in high season Bl = business travelers in low season Tl Th = tourist in high season Tl = tourist in low season Th Bh Bl Tl Quantity of Rooms Demanded at Each Price by Travelers in Each Segment in Each Season Note: hypothetical example
  • 10.
    Avoiding Burdensome Waitsfor Customers • Add extra capacity so that demand can be met at most times (problem: may add too many costs) • Rethink design of queuing system to give priority to certain customers or transactions • Redesign processes to shorten transaction time • Manage customer behavior and perceptions of wait • Install a reservations system
  • 11.
    Alternative Queuing Configurations (Fig. 9-4) Single line, single server, single stage Single line, single servers at sequential stages Parallel lines to multiple servers Designated lines to designated servers Single line to multiple servers (“snake”) 21 29 28 “Take a number” (single or multiple servers) 30 25 20 26 24 31 27 32 23
  • 12.
    Tailoring Queuing Systemsto Market Segments: Criteria for Allocation to Designated Lines • Urgency of job – emergencies vs. non-emergencies • Duration of service transaction – number of items to transact – complexity of task • Payment of premium price – First class vs. economy • Importance of customer – frequent users/loyal customers vs. others
  • 13.
    Ten Propositions onthe Psychology of Waiting Lines (Table 9-3) 1. Unoccupied time feels longer 2. Preprocess/postprocess waiting feel longer than in-process 3. Anxiety makes waiting seem longer 4. Uncertain waiting is longer than known, finite waiting 5. Unexplained waiting seems longer 6. Unfair waiting is longer than equitable waiting Sources: Maister; Davis & Heineke; Jones & Peppiatt 7. People will wait longer for more valuable
  • 14.
    Benefits of EffectiveReservations Systems • Controls and smoothes demand • Pre-sells service • Informs and educates customers in advance of arrival • Customers avoid waiting in line for service (if service times are honored) • Data capture helps organizations prepare financial projections
  • 15.
    Characteristics of Well-designed Reservations Systems • Fast and user friendly for customers and staff • Can answer customer questions • Offers options for self service (e.g. Web) • Accommodates preferences (e.g., room with view) • Deflects demand from unavailable first choices to alternative times and locations • Includes strategies for no-shows and overbooking
  • 16.
    Setting Capacity AllocationSales Targets for a Hotel by Segment and Capacity (% rooms) Time Period (Fig. 9-5)Week 36 Week 7 (Low Season) (High Season) 100% Out of commission for renovation Executive service guests Executive service guests Transient guests Weekend package 50% W/E package Transient guests Groups and conventions Groups (no conventions) Airline contracts Airline contracts Nights: M Tu W Th F S Sn M Tu W Th F S Sn Time
  • 17.
    Information Needed forDemand and Capacity Management Strategies • Historical data on demand level and composition, noting responses to marketing variables • Demand forecasts by segment under specified conditions • Fixed and variable cost data, profitability of incremental sales • Site-by-site demand variations