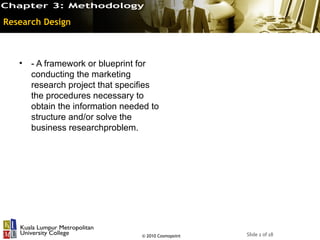
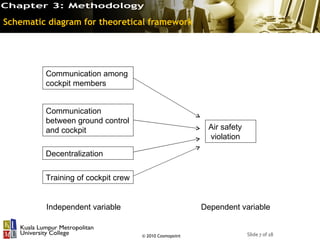
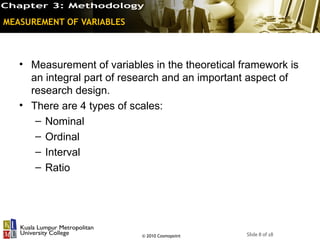
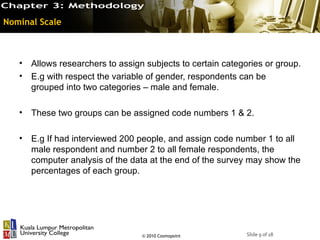
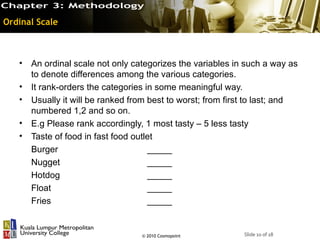
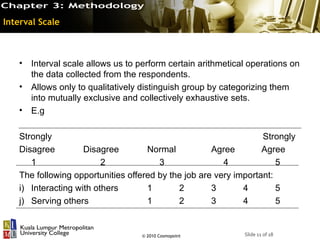
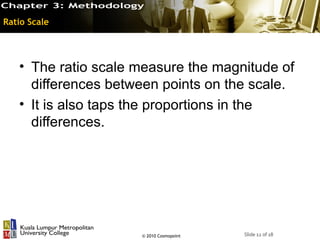
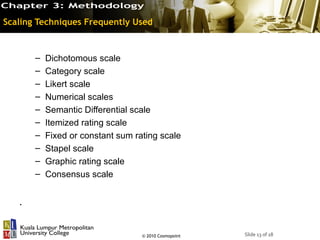
BAEB601: REESEARCH METHODOLOGY
CHAPTER 3: METHODOLOGY


                © 2010 Cosmopoint
Research Design


   •   - A framework or blueprint for
       conducting the marketing
       research project that specifies
       the procedures necessary to
       obtain the information needed to
       structure and/or solve the
       business researchproblem.


                                  © 2010 Cosmopoint   Slide 2 of 18
Research Design


   • Design process begins by
     defining the business research
     problem.

   • Followed by the Approach: a
     conceptual framework, research
     questions, hypotheses, and the
     information needed.


                                © 2010 Cosmopoint   Slide 3 of 18
Research Design


   • A good research design is important and necessary to
     ensure:

       •   That the information collected will be relevant and
           useful to management

       •   That all of the necessary information will be
           obtained

       •   That the business research project will be
           conducted effectively and efficiently.


                                    © 2010 Cosmopoint            Slide 4 of 18
Theoretical Framework


   • Theoretical framework is the foundation
     on which the entire research project is
     based. It is a logically developed,
     described, and elaborated network of
     association among variables deemed
     relevant to the problem situation and
     identified through such as interview,
     observation, and survey.

   • It is the important step in the research
     process.


                                   © 2010 Cosmopoint   Slide 5 of 18
Component of Theoretical Framework

   • The variables considered relevant to the study
     should be clearly identified and labeled in the
     discussions.

   • The study should state how two or more
     variables are related to one another. Is there any
     relationship?

   • Should be clear explanation between
     independent variables and dependent variables.

   • A schematic diagram of the theoretical
     framework should be given so that the reader
     can see and easily comprehend the therized
     relationship.

                                  © 2010 Cosmopoint       Slide 6 of 18
Schematic diagram for theoretical framework


         Communication among
         cockpit members


         Communication
         between ground control
         and cockpit                                     Air safety
                                                         violation

         Decentralization


         Training of cockpit crew


         Independent variable                           Dependent variable


                                    © 2010 Cosmopoint                 Slide 7 of 18
MEASUREMENT OF VARIABLES


   • Measurement of variables in the theoretical framework is
     an integral part of research and an important aspect of
     research design.
   • There are 4 types of scales:
      – Nominal
      – Ordinal
      – Interval
      – Ratio


                            © 2010 Cosmopoint     Slide 8 of 18
Nominal Scale


   •   Allows researchers to assign subjects to certain categories or group.
   •   E.g with respect the variable of gender, respondents can be
       grouped into two categories – male and female.

   •   These two groups can be assigned code numbers 1 & 2.

   •   E.g If had interviewed 200 people, and assign code number 1 to all
       male respondent and number 2 to all female respondents, the
       computer analysis of the data at the end of the survey may show the
       percentages of each group.


                                   © 2010 Cosmopoint          Slide 9 of 18
Ordinal Scale


   •   An ordinal scale not only categorizes the variables in such a way as
       to denote differences among the various categories.
   •   It rank-orders the categories in some meaningful way.
   •   Usually it will be ranked from best to worst; from first to last; and
       numbered 1,2 and so on.
   •   E.g Please rank accordingly, 1 most tasty – 5 less tasty
   •   Taste of food in fast food outlet
       Burger                         _____
       Nugget                         _____
       Hotdog                         _____
       Float                          _____
       Fries                          _____


                                   © 2010 Cosmopoint          Slide 10 of 18
Interval Scale


   •   Interval scale allows us to perform certain arithmetical operations on
       the data collected from the respondents.
   •   Allows only to qualitatively distinguish group by categorizing them
       into mutually exclusive and collectively exhaustive sets.
   •   E.g

   Strongly                                                       Strongly
   Disagree         Disagree        Normal           Agree        Agree
      1                  2             3                4             5
   The following opportunities offered by the job are very important:
   i) Interacting with others       1       2        3       4        5
   j) Serving others                1       2        3       4        5


                                   © 2010 Cosmopoint          Slide 11 of 18
Ratio Scale


   • The ratio scale measure the magnitude of
     differences between points on the scale.
   • It is also taps the proportions in the
     differences.


                     © 2010 Cosmopoint   Slide 12 of 18
Scaling Techniques Frequently Used


       –   Dichotomous scale
       –   Category scale
       –   Likert scale
       –   Numerical scales
       –   Semantic Differential scale
       –   Itemized rating scale
       –   Fixed or constant sum rating scale
       –   Stapel scale
       –   Graphic rating scale
       –   Consensus scale


   .


                                   © 2010 Cosmopoint   Slide 13 of 18

BAEB601 Chapter 3: Methodology

  • 1.
    BAEB601: REESEARCH METHODOLOGY CHAPTER3: METHODOLOGY © 2010 Cosmopoint
  • 2.
    Research Design • - A framework or blueprint for conducting the marketing research project that specifies the procedures necessary to obtain the information needed to structure and/or solve the business researchproblem. © 2010 Cosmopoint Slide 2 of 18
  • 3.
    Research Design • Design process begins by defining the business research problem. • Followed by the Approach: a conceptual framework, research questions, hypotheses, and the information needed. © 2010 Cosmopoint Slide 3 of 18
  • 4.
    Research Design • A good research design is important and necessary to ensure: • That the information collected will be relevant and useful to management • That all of the necessary information will be obtained • That the business research project will be conducted effectively and efficiently. © 2010 Cosmopoint Slide 4 of 18
  • 5.
    Theoretical Framework • Theoretical framework is the foundation on which the entire research project is based. It is a logically developed, described, and elaborated network of association among variables deemed relevant to the problem situation and identified through such as interview, observation, and survey. • It is the important step in the research process. © 2010 Cosmopoint Slide 5 of 18
  • 6.
    Component of TheoreticalFramework • The variables considered relevant to the study should be clearly identified and labeled in the discussions. • The study should state how two or more variables are related to one another. Is there any relationship? • Should be clear explanation between independent variables and dependent variables. • A schematic diagram of the theoretical framework should be given so that the reader can see and easily comprehend the therized relationship. © 2010 Cosmopoint Slide 6 of 18
  • 7.
    Schematic diagram fortheoretical framework Communication among cockpit members Communication between ground control and cockpit Air safety violation Decentralization Training of cockpit crew Independent variable Dependent variable © 2010 Cosmopoint Slide 7 of 18
  • 8.
    MEASUREMENT OF VARIABLES • Measurement of variables in the theoretical framework is an integral part of research and an important aspect of research design. • There are 4 types of scales: – Nominal – Ordinal – Interval – Ratio © 2010 Cosmopoint Slide 8 of 18
  • 9.
    Nominal Scale • Allows researchers to assign subjects to certain categories or group. • E.g with respect the variable of gender, respondents can be grouped into two categories – male and female. • These two groups can be assigned code numbers 1 & 2. • E.g If had interviewed 200 people, and assign code number 1 to all male respondent and number 2 to all female respondents, the computer analysis of the data at the end of the survey may show the percentages of each group. © 2010 Cosmopoint Slide 9 of 18
  • 10.
    Ordinal Scale • An ordinal scale not only categorizes the variables in such a way as to denote differences among the various categories. • It rank-orders the categories in some meaningful way. • Usually it will be ranked from best to worst; from first to last; and numbered 1,2 and so on. • E.g Please rank accordingly, 1 most tasty – 5 less tasty • Taste of food in fast food outlet Burger _____ Nugget _____ Hotdog _____ Float _____ Fries _____ © 2010 Cosmopoint Slide 10 of 18
  • 11.
    Interval Scale • Interval scale allows us to perform certain arithmetical operations on the data collected from the respondents. • Allows only to qualitatively distinguish group by categorizing them into mutually exclusive and collectively exhaustive sets. • E.g Strongly Strongly Disagree Disagree Normal Agree Agree 1 2 3 4 5 The following opportunities offered by the job are very important: i) Interacting with others 1 2 3 4 5 j) Serving others 1 2 3 4 5 © 2010 Cosmopoint Slide 11 of 18
  • 12.
    Ratio Scale • The ratio scale measure the magnitude of differences between points on the scale. • It is also taps the proportions in the differences. © 2010 Cosmopoint Slide 12 of 18
  • 13.
    Scaling Techniques FrequentlyUsed – Dichotomous scale – Category scale – Likert scale – Numerical scales – Semantic Differential scale – Itemized rating scale – Fixed or constant sum rating scale – Stapel scale – Graphic rating scale – Consensus scale . © 2010 Cosmopoint Slide 13 of 18