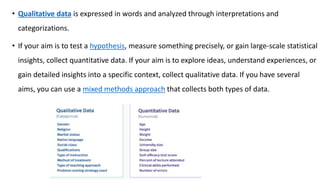
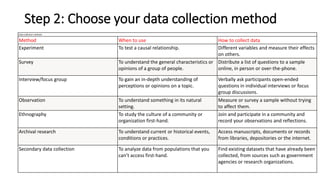
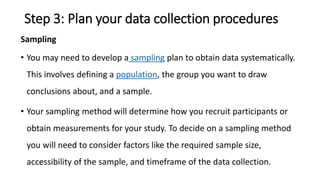
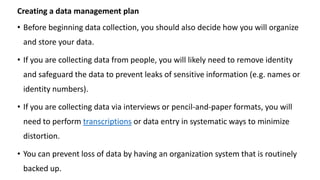
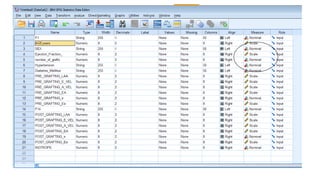
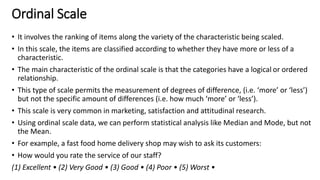
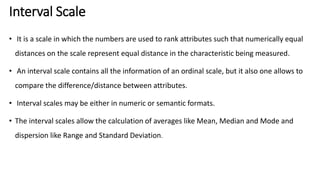
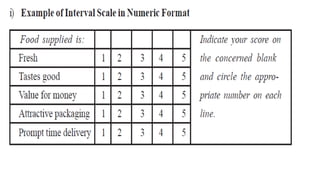
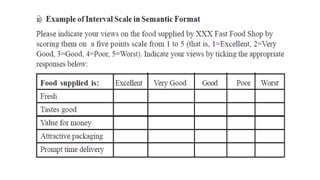
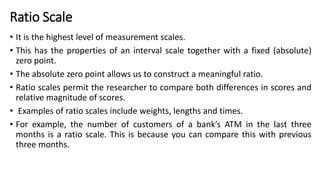
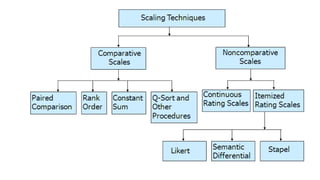
This document discusses data collection methods. It begins by defining data collection as the systematic process of gathering observations or measurements. It then outlines the main steps in data collection: 1) defining the research aim, 2) choosing a data collection method such as experiments, surveys, interviews etc., and 3) planning data collection procedures such as sampling and standardizing. It also discusses different measurement scales such as nominal, ordinal, interval and ratio scales that are used to quantify variables. Finally, it covers scaling techniques including comparative scales like paired comparisons and ranking as well as non-comparative scales like Likert scales.

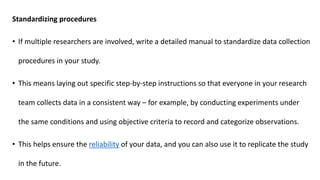


![PERI-PROSTHETIC FRACTURE NAIL-PLATE CONSTRUCT [NPC].pptx](https://cdn.slidesharecdn.com/ss_thumbnails/drarunkumardrmohamedashrafperiprostheticfrasturenail-plateconstructnpc-260209164459-7e9d15a1-thumbnail.jpg?width=640&height=640&fit=bounds)


![ONFH[AVN HIP] -TRIPLE REGIME -A NOVAL SURGICAL CONCEPT .pptx](https://cdn.slidesharecdn.com/ss_thumbnails/onfhavnhip2026koaconcalicutdrgokuldevdrmashraf-260210064517-213ec005-thumbnail.jpg?width=640&height=640&fit=bounds)

![CTEV [ clubfoot] DR ARUN LAL ,DR MOHAMED ASHRAF travancore medical college k...](https://cdn.slidesharecdn.com/ss_thumbnails/ctevclubfootdrarunlaldrmohamedashraftravancoremedicalcollegekollamkeralaindia-260208063247-18fc466c-thumbnail.jpg?width=640&height=640&fit=bounds)


