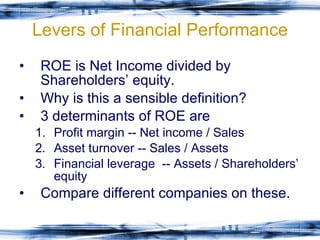
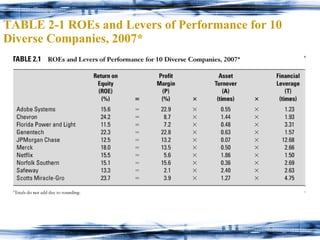
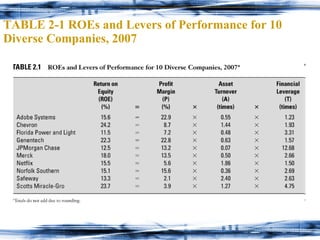
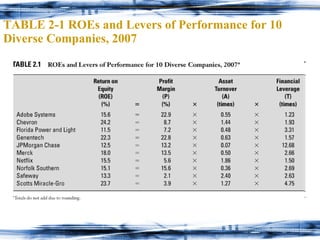
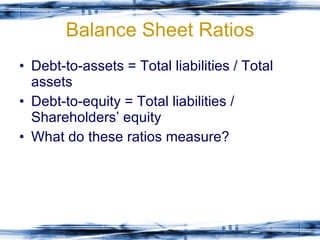
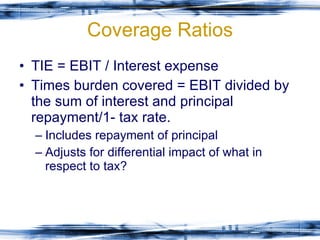
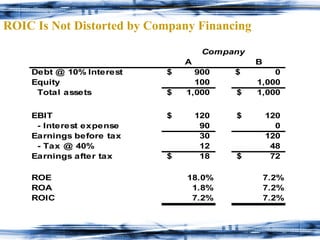
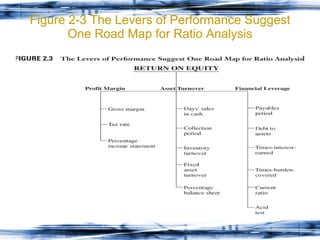
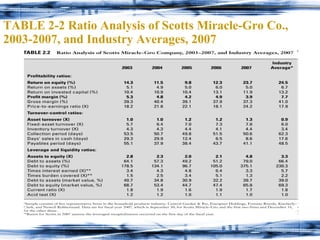
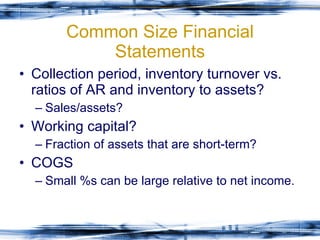
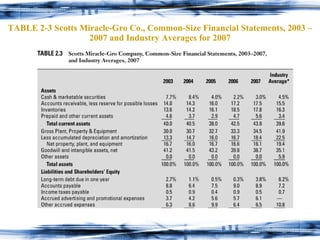
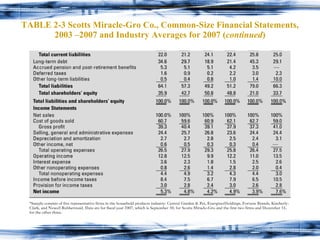
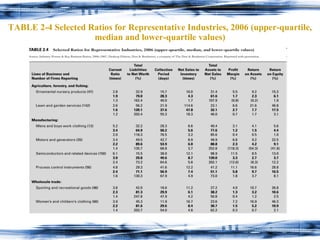
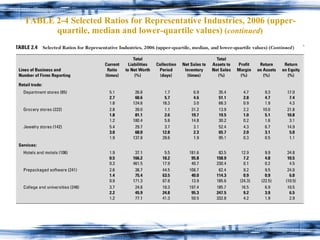
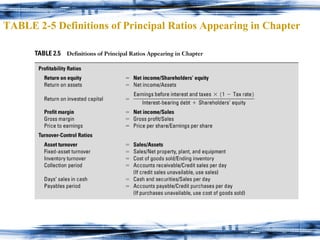
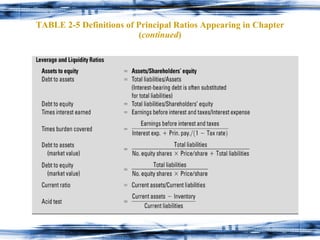
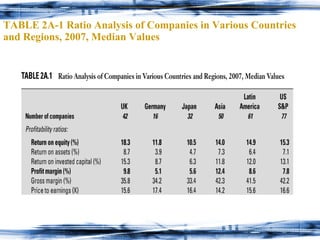
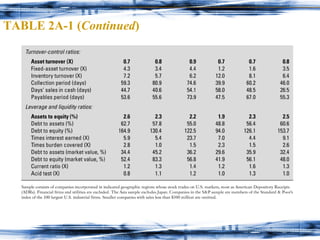
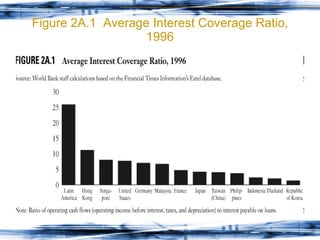
Evaluating Financial Performance CHAPTER 2 McGraw-Hill/Irwin Copyright © 2009 by The McGraw-Hill Companies, Inc. All rights reserved.
Introduction Analogy to flight cockpit. Indicators and levers.
Levers of Financial Performance ROE is Net Income divided by Shareholders’ equity. Why is this a sensible definition? 3 determinants of ROE are Profit margin -- Net income / Sales Asset turnover -- Sales / Assets Financial leverage  -- Assets / Shareholders’ equity Compare different companies on these.
TABLE 2-1 ROEs and Levers of Performance for 10 Diverse Companies, 2007*
Comparisons Differences in ROE across firms is less than differences in components. Why? Role of competition? Is there any reason why profit margin and asset returns are negatively related?
ROA How defined? Net income / Assets What does this measure? Net income + interest / Assets?
Gross Margin Gross Profit / Sales Gross profit = ? Are COGS variable or fixed? Why is it important to distinguish between variable and fixed costs?
Asset Turnover Take another look at Table 2-1. Which companies have high asset turnovers? Which is likely to be more sensitive to external events, current assets or fixed assets?
TABLE 2-1 ROEs and Levers of Performance for 10 Diverse Companies, 2007
What is a self-liquidating loan?  What happens to AR and inventory when sales go up? What happens to AR and inventory when sales go down? What does a ratio like AR/Sales tell us? Collection period (DSO)?
Inventory Turns COGS / Ending inventory What are the turns?
Days’ Sales in Cash Cash + Securities / Sales per day What does this ratio measure? Cash as a substitute?
Payables Period AP / Credit purchases per day COGS as a proxy for Credit purchases. Inventory changes do what? Labor costs do what?
Fixed Asset Turnover Sales / Net PP&E Capital intensity? What’s the wheel analogy?
Financial Leverage What does increased financial leverage do to ROE? Is increased leverage a good thing? Florida Power vs. Netflix and Genentech in Table 2-1? JPMorgan Chase? Have a look, and describe what you see, along with an explanation.
TABLE 2-1 ROEs and Levers of Performance for 10 Diverse Companies, 2007
Balance Sheet Ratios Debt-to-assets = Total liabilities / Total assets Debt-to-equity = Total liabilities / Shareholders’ equity What do these ratios measure?
Coverage Ratios TIE = EBIT / Interest expense Times burden covered = EBIT divided by the sum of interest and principal repayment/1- tax rate. Includes repayment of principal Adjusts for differential impact of what in respect to tax?
Which coverage ratio is more important? How much coverage is enough? Cash, borrowing capacity, salable assets, business risk
Market Value Leverage Ratios D/E and D/A What do they represent? Coverage ratios? Growth prospects and future coverage potential? Rollover risk?
Liquidity Ratios Current ratio = Current Assets / Current Liabilities Acid test removes inventory from current assets to yield the quick ratio.
Is ROE a Reliable Yardstick? Timing Forward looking and long-term perspective? Risk Impact of leverage ROIC = EBIT(1-Tax rate) / Interest Bearing Debt + Equity AP excluded Value Book value vs. market value Earnings yield, inverse of P/E Back to ROIC.
ROIC Is Not Distorted by Company Financing
ROE or Market Price? Which is the better way to measure financial performance? Value creation for investors involves market values. Line of sight? Asymmetric information? External effects, economy, other stocks, etc.?
Scatter Plots Price-to-book vs. ROE (weighted average) Figures 2-1 and 2-2 coming up. Slope and dispersion (R-squared)?
FIGURE 2-1 Market Value to Book Value of Equity versus Return on Equity for 37 Household Products and Related Companies
FIGURE 2-2 Market to Book Value of Equity versus Return on Equity for 87 Large Corporations
Using Ratios Effectively Ratio values need to be understood in context. Usually, no “correct” values for ratios. Rely on rule of thumb assessment techniques, such as comps and own time series changes.
Figure 2-3 The Levers of Performance Suggest One Road Map for Ratio Analysis
Scotts Miracle-Gro Time series of Scotts ROE? Recap in 2007? Quality? ROIC? Profit margin? Puzzle? Gross margin? How strong a brand?
Asset Turnover Asset turnover. Low or high? Good or bad? Fixed asset turnover? Inventory turnover? Collection period? Days’ sales in cash?
Leverage and Liquidity Ratios? Impact of recap? TIE or TBurdenCovered? Compare Scotts to industry averages: see next slide.
TABLE 2-2 Ratio Analysis of Scotts Miracle-Gro Co.,  2003-2007, and Industry Averages, 2007
Common Size Financial Statements Collection period, inventory turnover vs. ratios of AR and inventory to assets? Sales/assets? Working capital?  Fraction of assets that are short-term? COGS Small %s can be large relative to net income.
TABLE 2-3 Scotts Miracle-Gro Co., Common-Size Financial Statements, 2003 –2007 and Industry Averages for 2007
TABLE 2-3 Scotts Miracle-Gro Co., Common-Size Financial Statements, 2003 –2007 and Industry Averages for 2007 ( continued )
Opportunities for Cash? A challenge? Examine statement of cash flows, contrasting cash flows from operations to cash flows from investment. Excess cash? Recap + distribution to shareholders?
TABLE 2-4 Selected Ratios for Representative Industries, 2006 (upper-quartile, median and lower-quartile values)
TABLE 2-4 Selected Ratios for Representative Industries, 2006 (upper-quartile, median and lower-quartile values)  ( continued )
TABLE 2-5 Definitions of Principal Ratios Appearing in Chapter
TABLE 2-5 Definitions of Principal Ratios Appearing in Chapter ( continued )
Appendix International Differences In the upcoming table, look at the UK, Germany and Japan. Asset turns and profit margins in Asia and Latin America? Japanese collection periods, payables periods, and  keiretsu . Leverage and liquidity across the globe?
Public Companies Indebtedness in Latin America vs. U.S., Europe, and Japan? Indebtedness in Korea, Thailand, Indonesia? Controlling families, state-owned banks, and the state Use of banks to foster top-down directed development
TABLE 2A-1 Ratio Analysis of Companies in Various Countries  and Regions, 2007, Median Values
TABLE 2A-1 ( Continued )
Figure 2A.1  Average Interest Coverage Ratio, 1996
IFAS International Financial Accounting Standards. 2005, Europe adopts IFAS. Post Enron and WorldCom, U.S. will adopt IFAS. Consolidated balance sheets vs. those of parent, expensing R&D, fair value accounting. Principles vs. rules.

Chap002

  • 1.
    Evaluating Financial PerformanceCHAPTER 2 McGraw-Hill/Irwin Copyright © 2009 by The McGraw-Hill Companies, Inc. All rights reserved.
  • 2.
    Introduction Analogy toflight cockpit. Indicators and levers.
  • 3.
    Levers of FinancialPerformance ROE is Net Income divided by Shareholders’ equity. Why is this a sensible definition? 3 determinants of ROE are Profit margin -- Net income / Sales Asset turnover -- Sales / Assets Financial leverage -- Assets / Shareholders’ equity Compare different companies on these.
  • 4.
    TABLE 2-1 ROEsand Levers of Performance for 10 Diverse Companies, 2007*
  • 5.
    Comparisons Differences inROE across firms is less than differences in components. Why? Role of competition? Is there any reason why profit margin and asset returns are negatively related?
  • 6.
    ROA How defined?Net income / Assets What does this measure? Net income + interest / Assets?
  • 7.
    Gross Margin GrossProfit / Sales Gross profit = ? Are COGS variable or fixed? Why is it important to distinguish between variable and fixed costs?
  • 8.
    Asset Turnover Takeanother look at Table 2-1. Which companies have high asset turnovers? Which is likely to be more sensitive to external events, current assets or fixed assets?
  • 9.
    TABLE 2-1 ROEsand Levers of Performance for 10 Diverse Companies, 2007
  • 10.
    What is aself-liquidating loan? What happens to AR and inventory when sales go up? What happens to AR and inventory when sales go down? What does a ratio like AR/Sales tell us? Collection period (DSO)?
  • 11.
    Inventory Turns COGS/ Ending inventory What are the turns?
  • 12.
    Days’ Sales inCash Cash + Securities / Sales per day What does this ratio measure? Cash as a substitute?
  • 13.
    Payables Period AP/ Credit purchases per day COGS as a proxy for Credit purchases. Inventory changes do what? Labor costs do what?
  • 14.
    Fixed Asset TurnoverSales / Net PP&E Capital intensity? What’s the wheel analogy?
  • 15.
    Financial Leverage Whatdoes increased financial leverage do to ROE? Is increased leverage a good thing? Florida Power vs. Netflix and Genentech in Table 2-1? JPMorgan Chase? Have a look, and describe what you see, along with an explanation.
  • 16.
    TABLE 2-1 ROEsand Levers of Performance for 10 Diverse Companies, 2007
  • 17.
    Balance Sheet RatiosDebt-to-assets = Total liabilities / Total assets Debt-to-equity = Total liabilities / Shareholders’ equity What do these ratios measure?
  • 18.
    Coverage Ratios TIE= EBIT / Interest expense Times burden covered = EBIT divided by the sum of interest and principal repayment/1- tax rate. Includes repayment of principal Adjusts for differential impact of what in respect to tax?
  • 19.
    Which coverage ratiois more important? How much coverage is enough? Cash, borrowing capacity, salable assets, business risk
  • 20.
    Market Value LeverageRatios D/E and D/A What do they represent? Coverage ratios? Growth prospects and future coverage potential? Rollover risk?
  • 21.
    Liquidity Ratios Currentratio = Current Assets / Current Liabilities Acid test removes inventory from current assets to yield the quick ratio.
  • 22.
    Is ROE aReliable Yardstick? Timing Forward looking and long-term perspective? Risk Impact of leverage ROIC = EBIT(1-Tax rate) / Interest Bearing Debt + Equity AP excluded Value Book value vs. market value Earnings yield, inverse of P/E Back to ROIC.
  • 23.
    ROIC Is NotDistorted by Company Financing
  • 24.
    ROE or MarketPrice? Which is the better way to measure financial performance? Value creation for investors involves market values. Line of sight? Asymmetric information? External effects, economy, other stocks, etc.?
  • 25.
    Scatter Plots Price-to-bookvs. ROE (weighted average) Figures 2-1 and 2-2 coming up. Slope and dispersion (R-squared)?
  • 26.
    FIGURE 2-1 MarketValue to Book Value of Equity versus Return on Equity for 37 Household Products and Related Companies
  • 27.
    FIGURE 2-2 Marketto Book Value of Equity versus Return on Equity for 87 Large Corporations
  • 28.
    Using Ratios EffectivelyRatio values need to be understood in context. Usually, no “correct” values for ratios. Rely on rule of thumb assessment techniques, such as comps and own time series changes.
  • 29.
    Figure 2-3 TheLevers of Performance Suggest One Road Map for Ratio Analysis
  • 30.
    Scotts Miracle-Gro Timeseries of Scotts ROE? Recap in 2007? Quality? ROIC? Profit margin? Puzzle? Gross margin? How strong a brand?
  • 31.
    Asset Turnover Assetturnover. Low or high? Good or bad? Fixed asset turnover? Inventory turnover? Collection period? Days’ sales in cash?
  • 32.
    Leverage and LiquidityRatios? Impact of recap? TIE or TBurdenCovered? Compare Scotts to industry averages: see next slide.
  • 33.
    TABLE 2-2 RatioAnalysis of Scotts Miracle-Gro Co., 2003-2007, and Industry Averages, 2007
  • 34.
    Common Size FinancialStatements Collection period, inventory turnover vs. ratios of AR and inventory to assets? Sales/assets? Working capital? Fraction of assets that are short-term? COGS Small %s can be large relative to net income.
  • 35.
    TABLE 2-3 ScottsMiracle-Gro Co., Common-Size Financial Statements, 2003 –2007 and Industry Averages for 2007
  • 36.
    TABLE 2-3 ScottsMiracle-Gro Co., Common-Size Financial Statements, 2003 –2007 and Industry Averages for 2007 ( continued )
  • 37.
    Opportunities for Cash?A challenge? Examine statement of cash flows, contrasting cash flows from operations to cash flows from investment. Excess cash? Recap + distribution to shareholders?
  • 38.
    TABLE 2-4 SelectedRatios for Representative Industries, 2006 (upper-quartile, median and lower-quartile values)
  • 39.
    TABLE 2-4 SelectedRatios for Representative Industries, 2006 (upper-quartile, median and lower-quartile values) ( continued )
  • 40.
    TABLE 2-5 Definitionsof Principal Ratios Appearing in Chapter
  • 41.
    TABLE 2-5 Definitionsof Principal Ratios Appearing in Chapter ( continued )
  • 42.
    Appendix International DifferencesIn the upcoming table, look at the UK, Germany and Japan. Asset turns and profit margins in Asia and Latin America? Japanese collection periods, payables periods, and keiretsu . Leverage and liquidity across the globe?
  • 43.
    Public Companies Indebtednessin Latin America vs. U.S., Europe, and Japan? Indebtedness in Korea, Thailand, Indonesia? Controlling families, state-owned banks, and the state Use of banks to foster top-down directed development
  • 44.
    TABLE 2A-1 RatioAnalysis of Companies in Various Countries and Regions, 2007, Median Values
  • 45.
    TABLE 2A-1 (Continued )
  • 46.
    Figure 2A.1 Average Interest Coverage Ratio, 1996
  • 47.
    IFAS International FinancialAccounting Standards. 2005, Europe adopts IFAS. Post Enron and WorldCom, U.S. will adopt IFAS. Consolidated balance sheets vs. those of parent, expensing R&D, fair value accounting. Principles vs. rules.