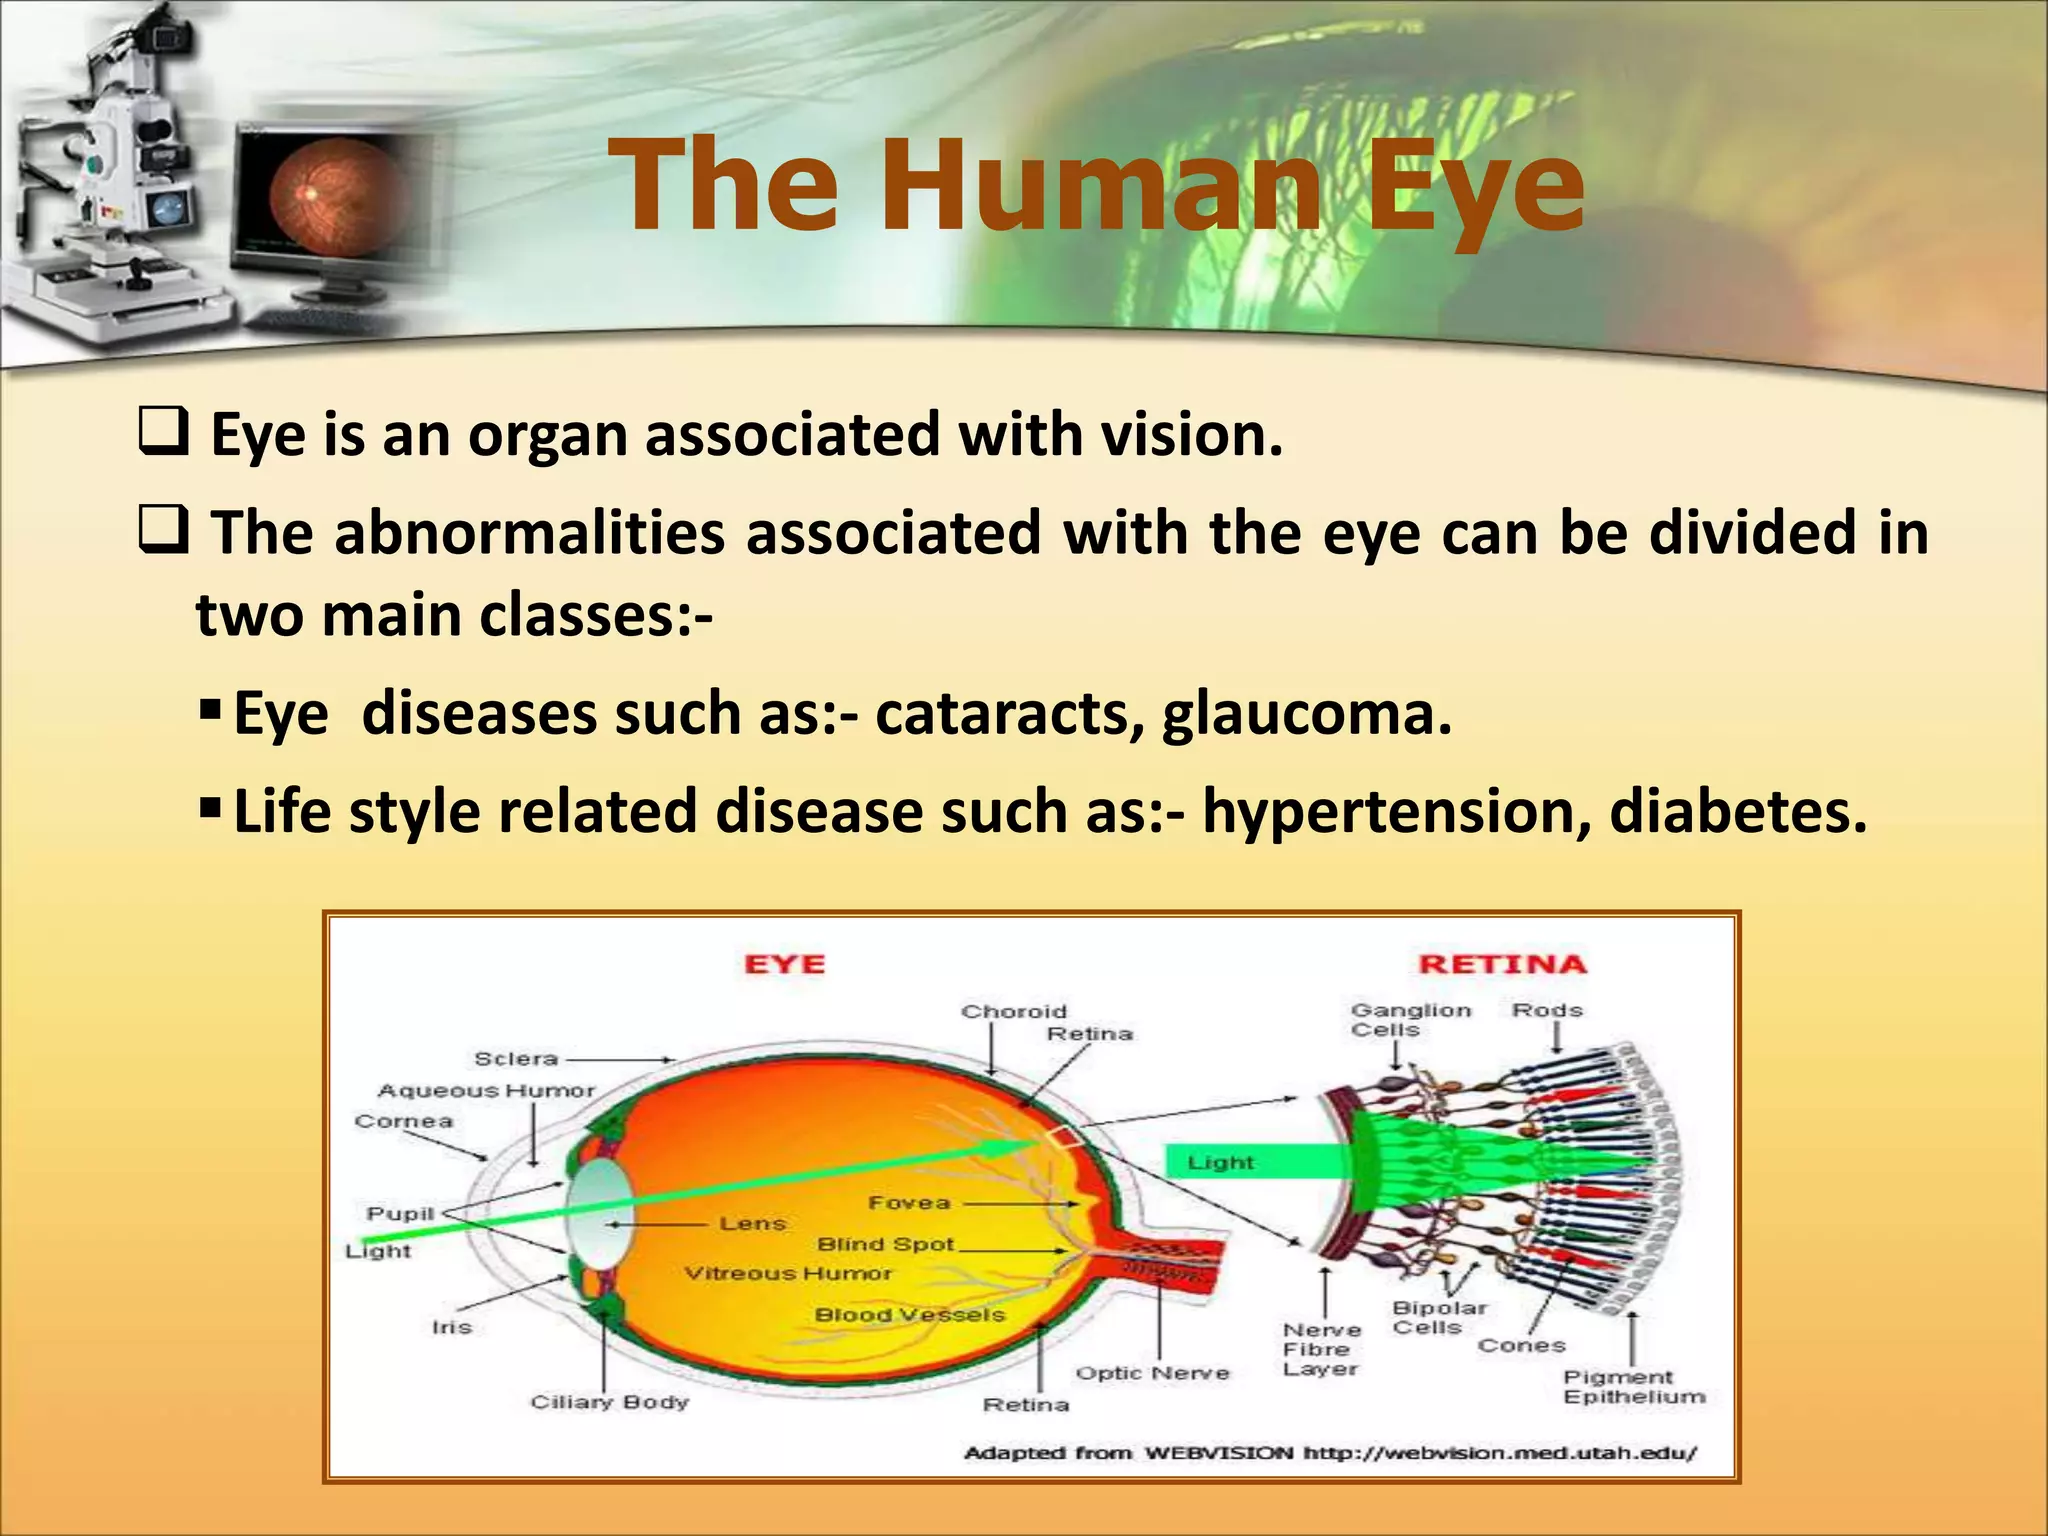
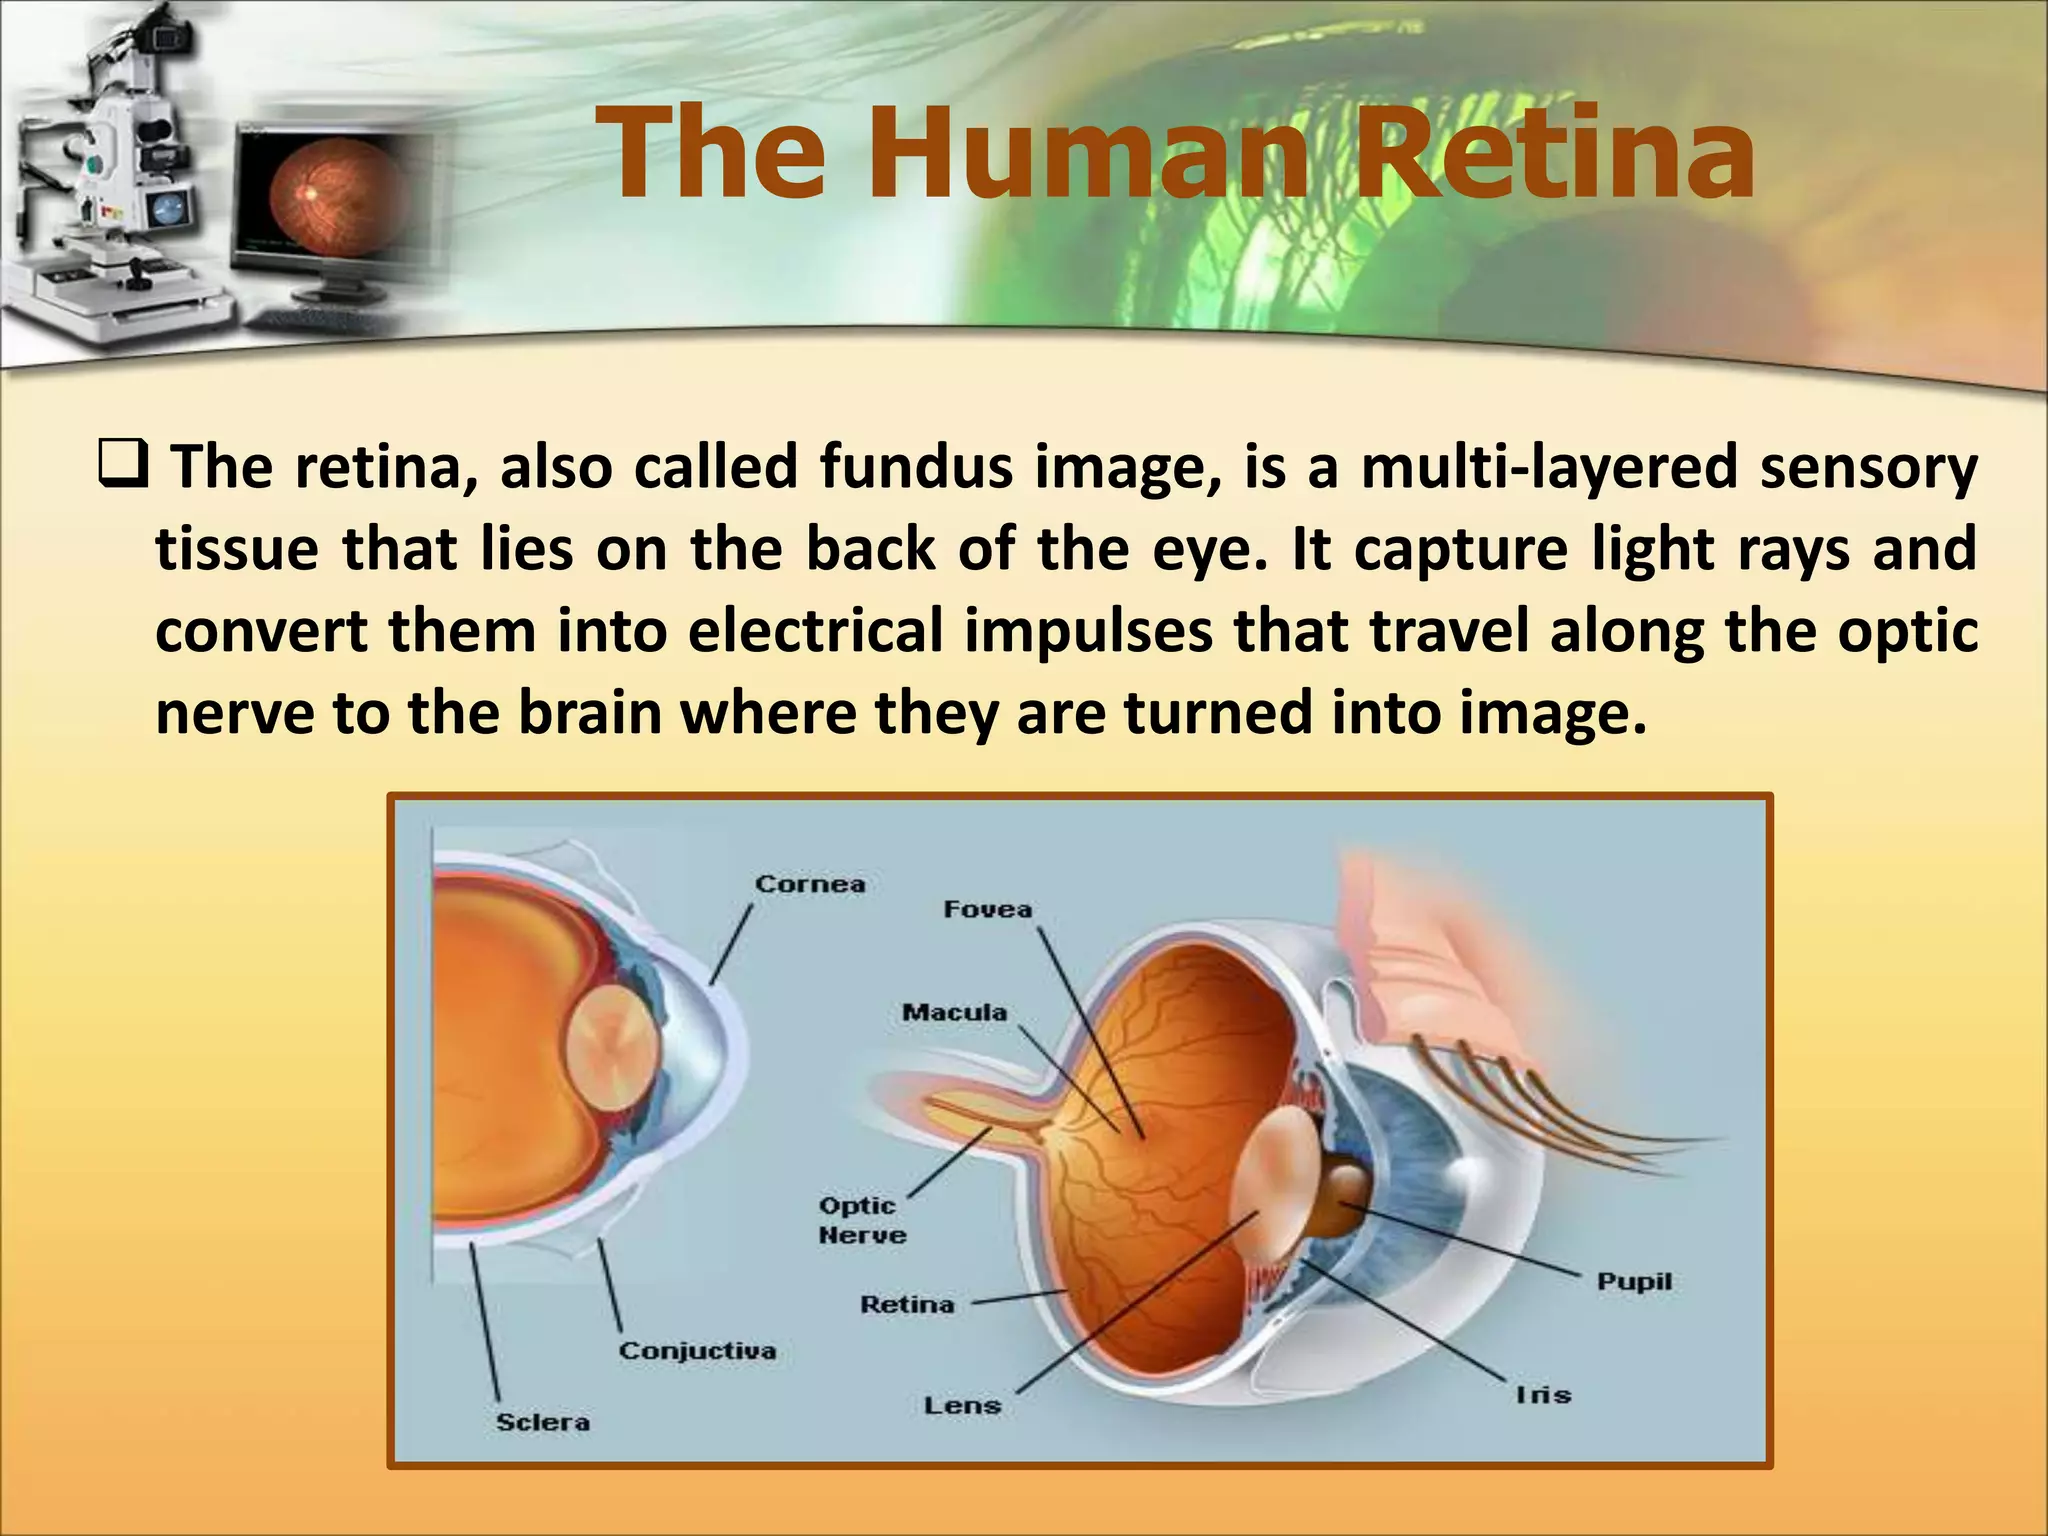
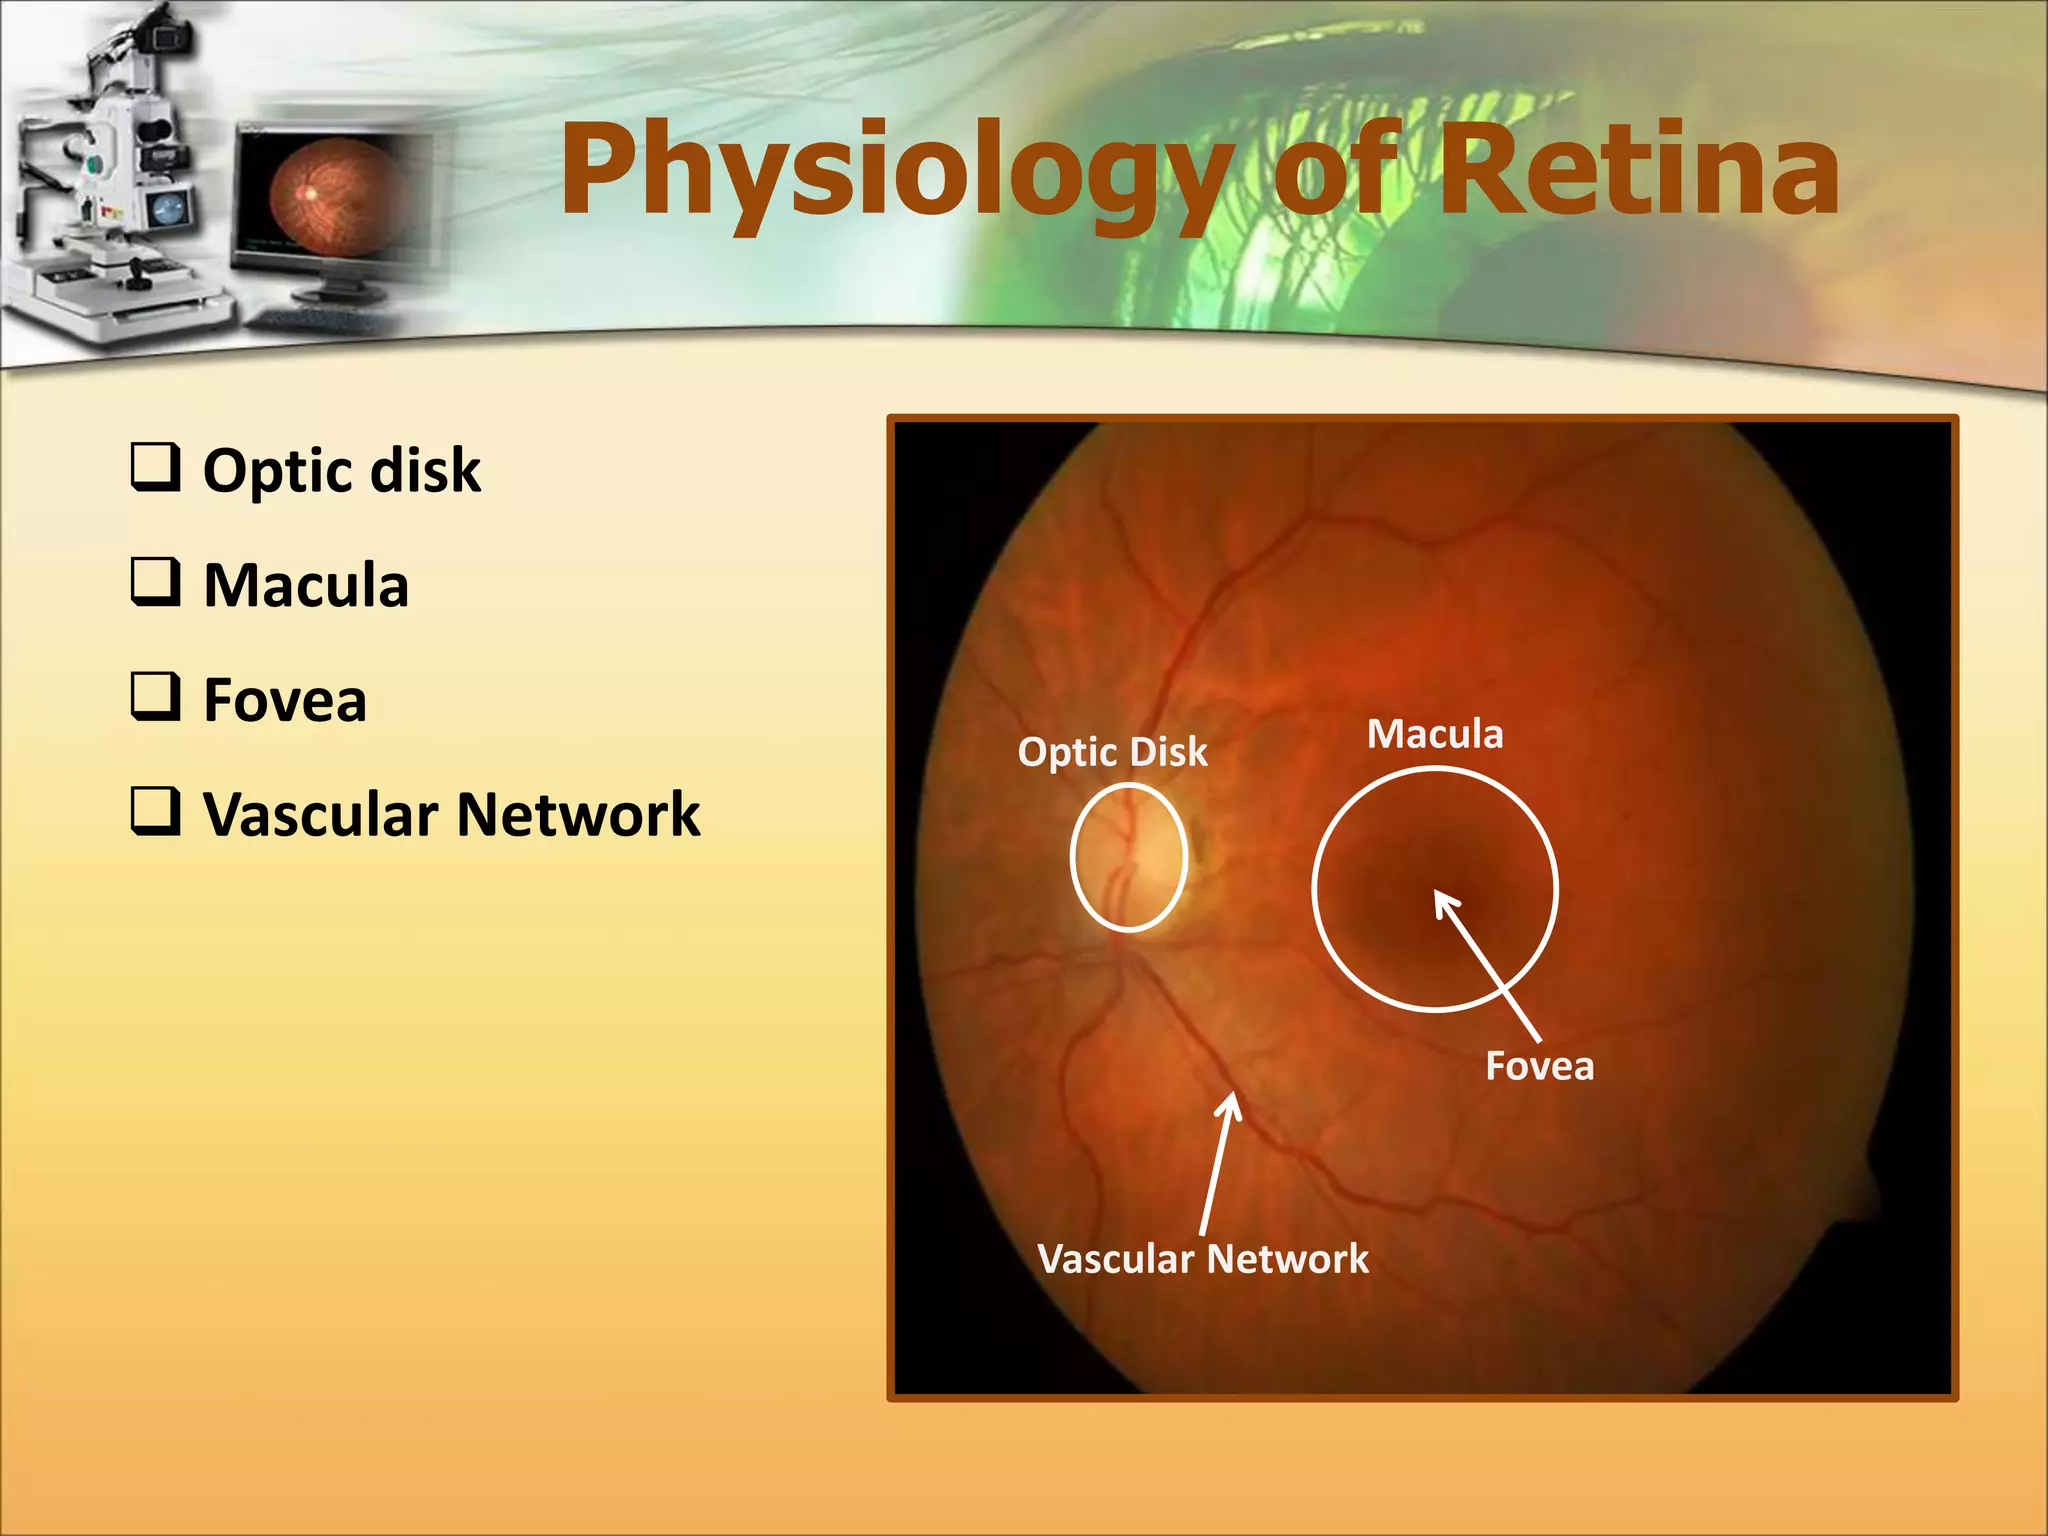
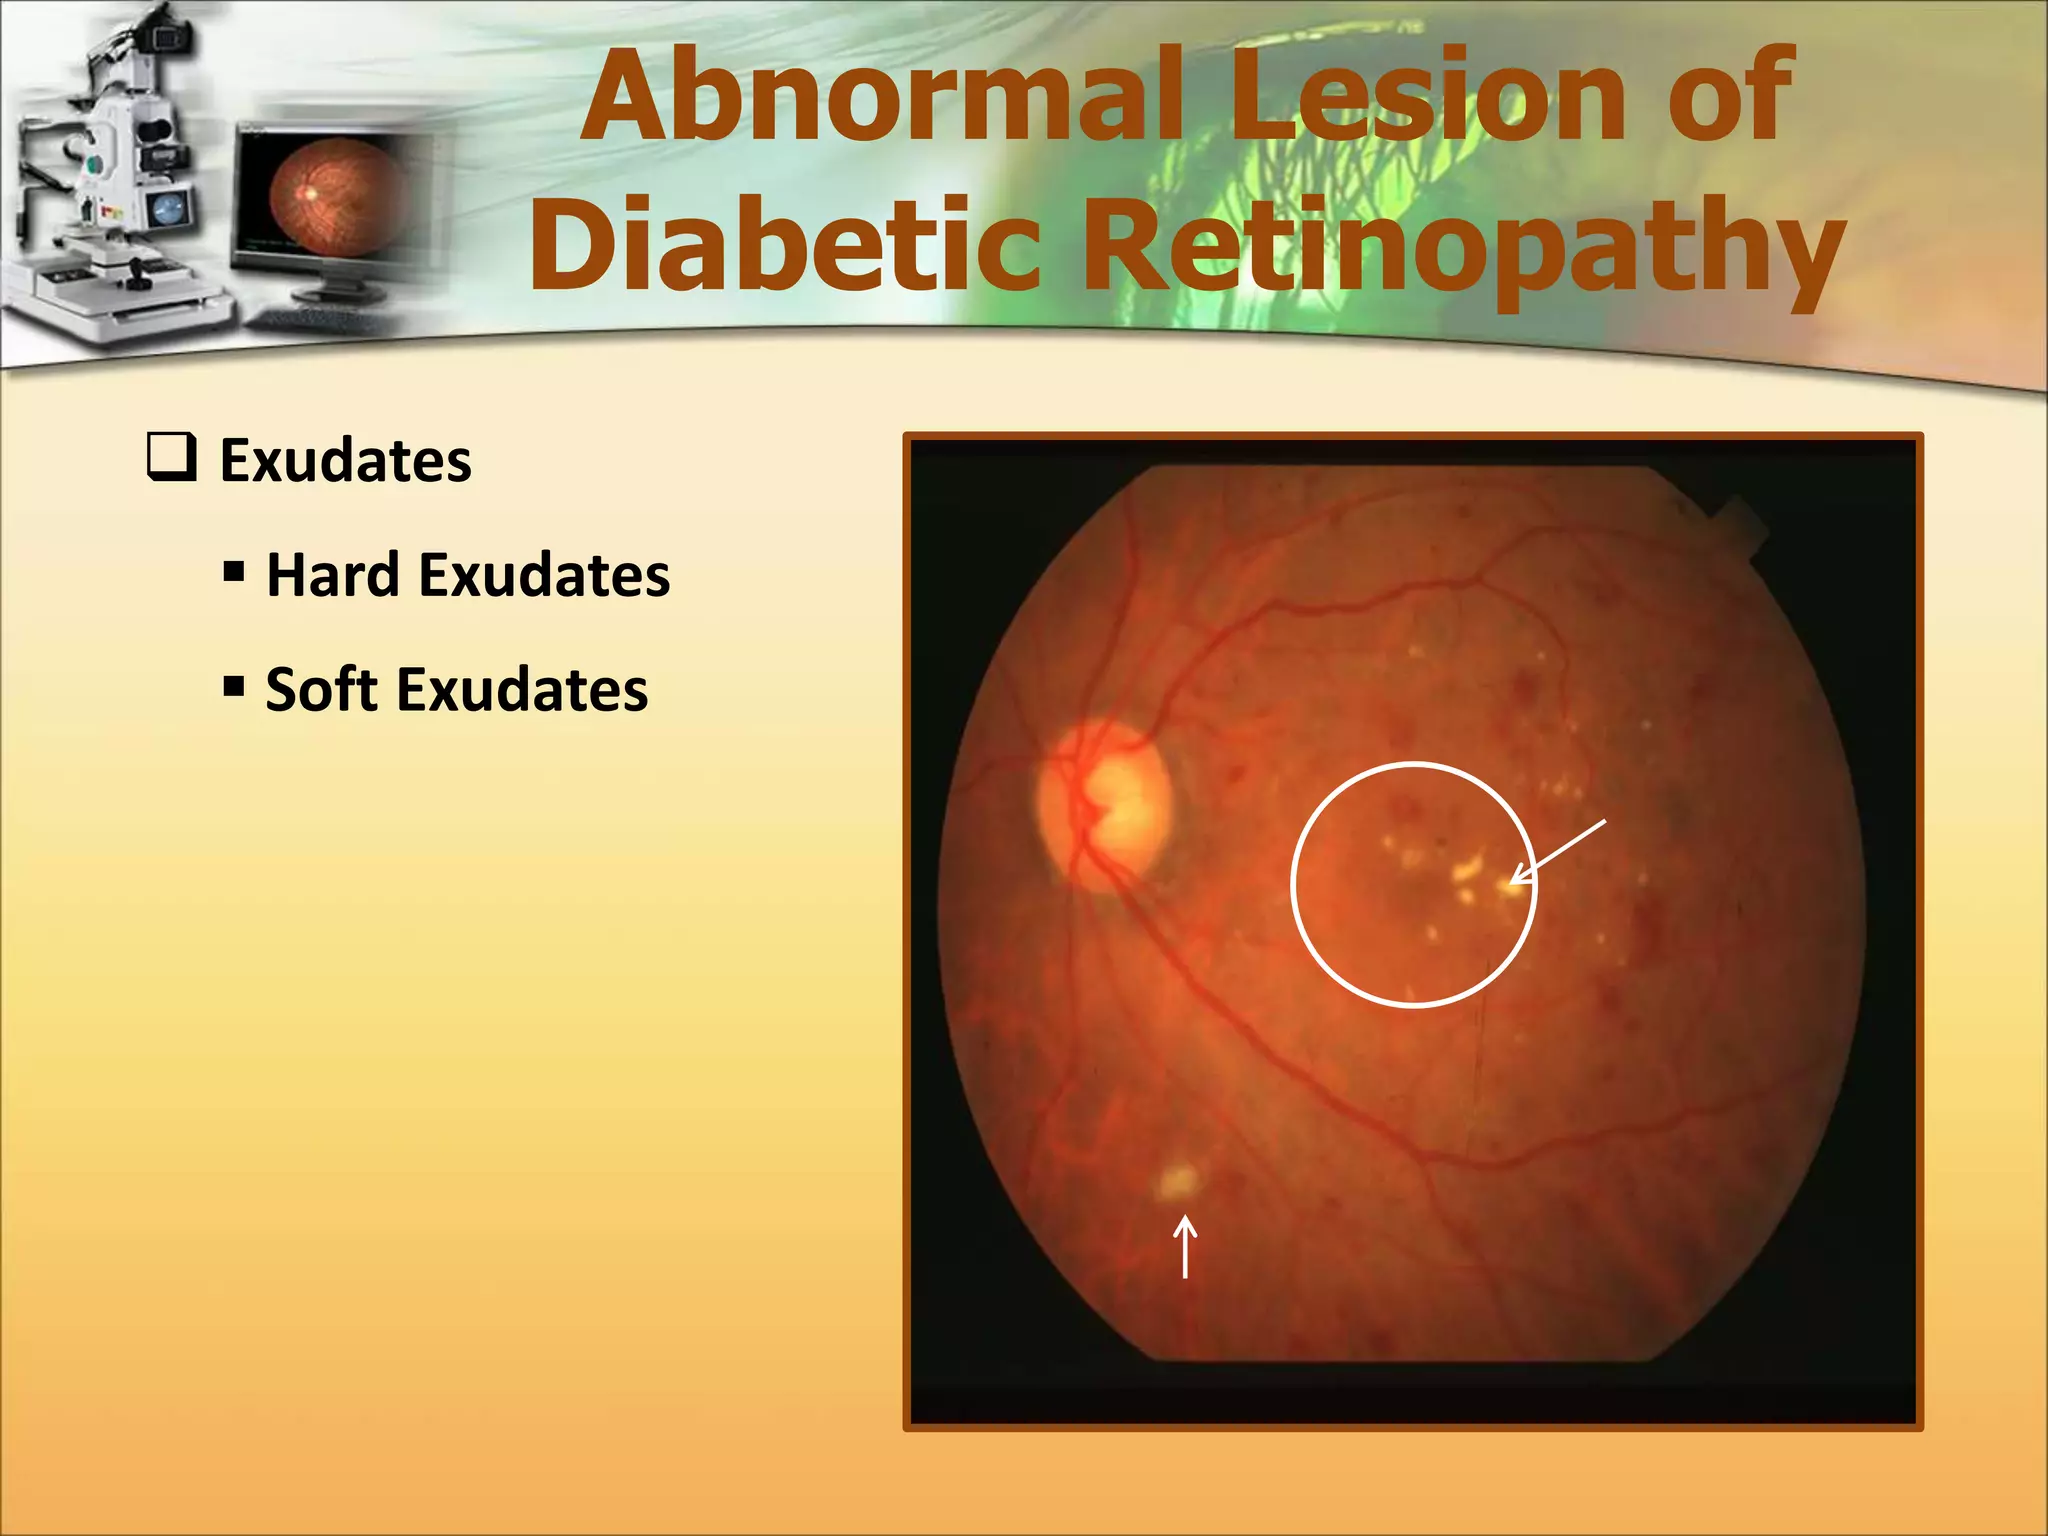
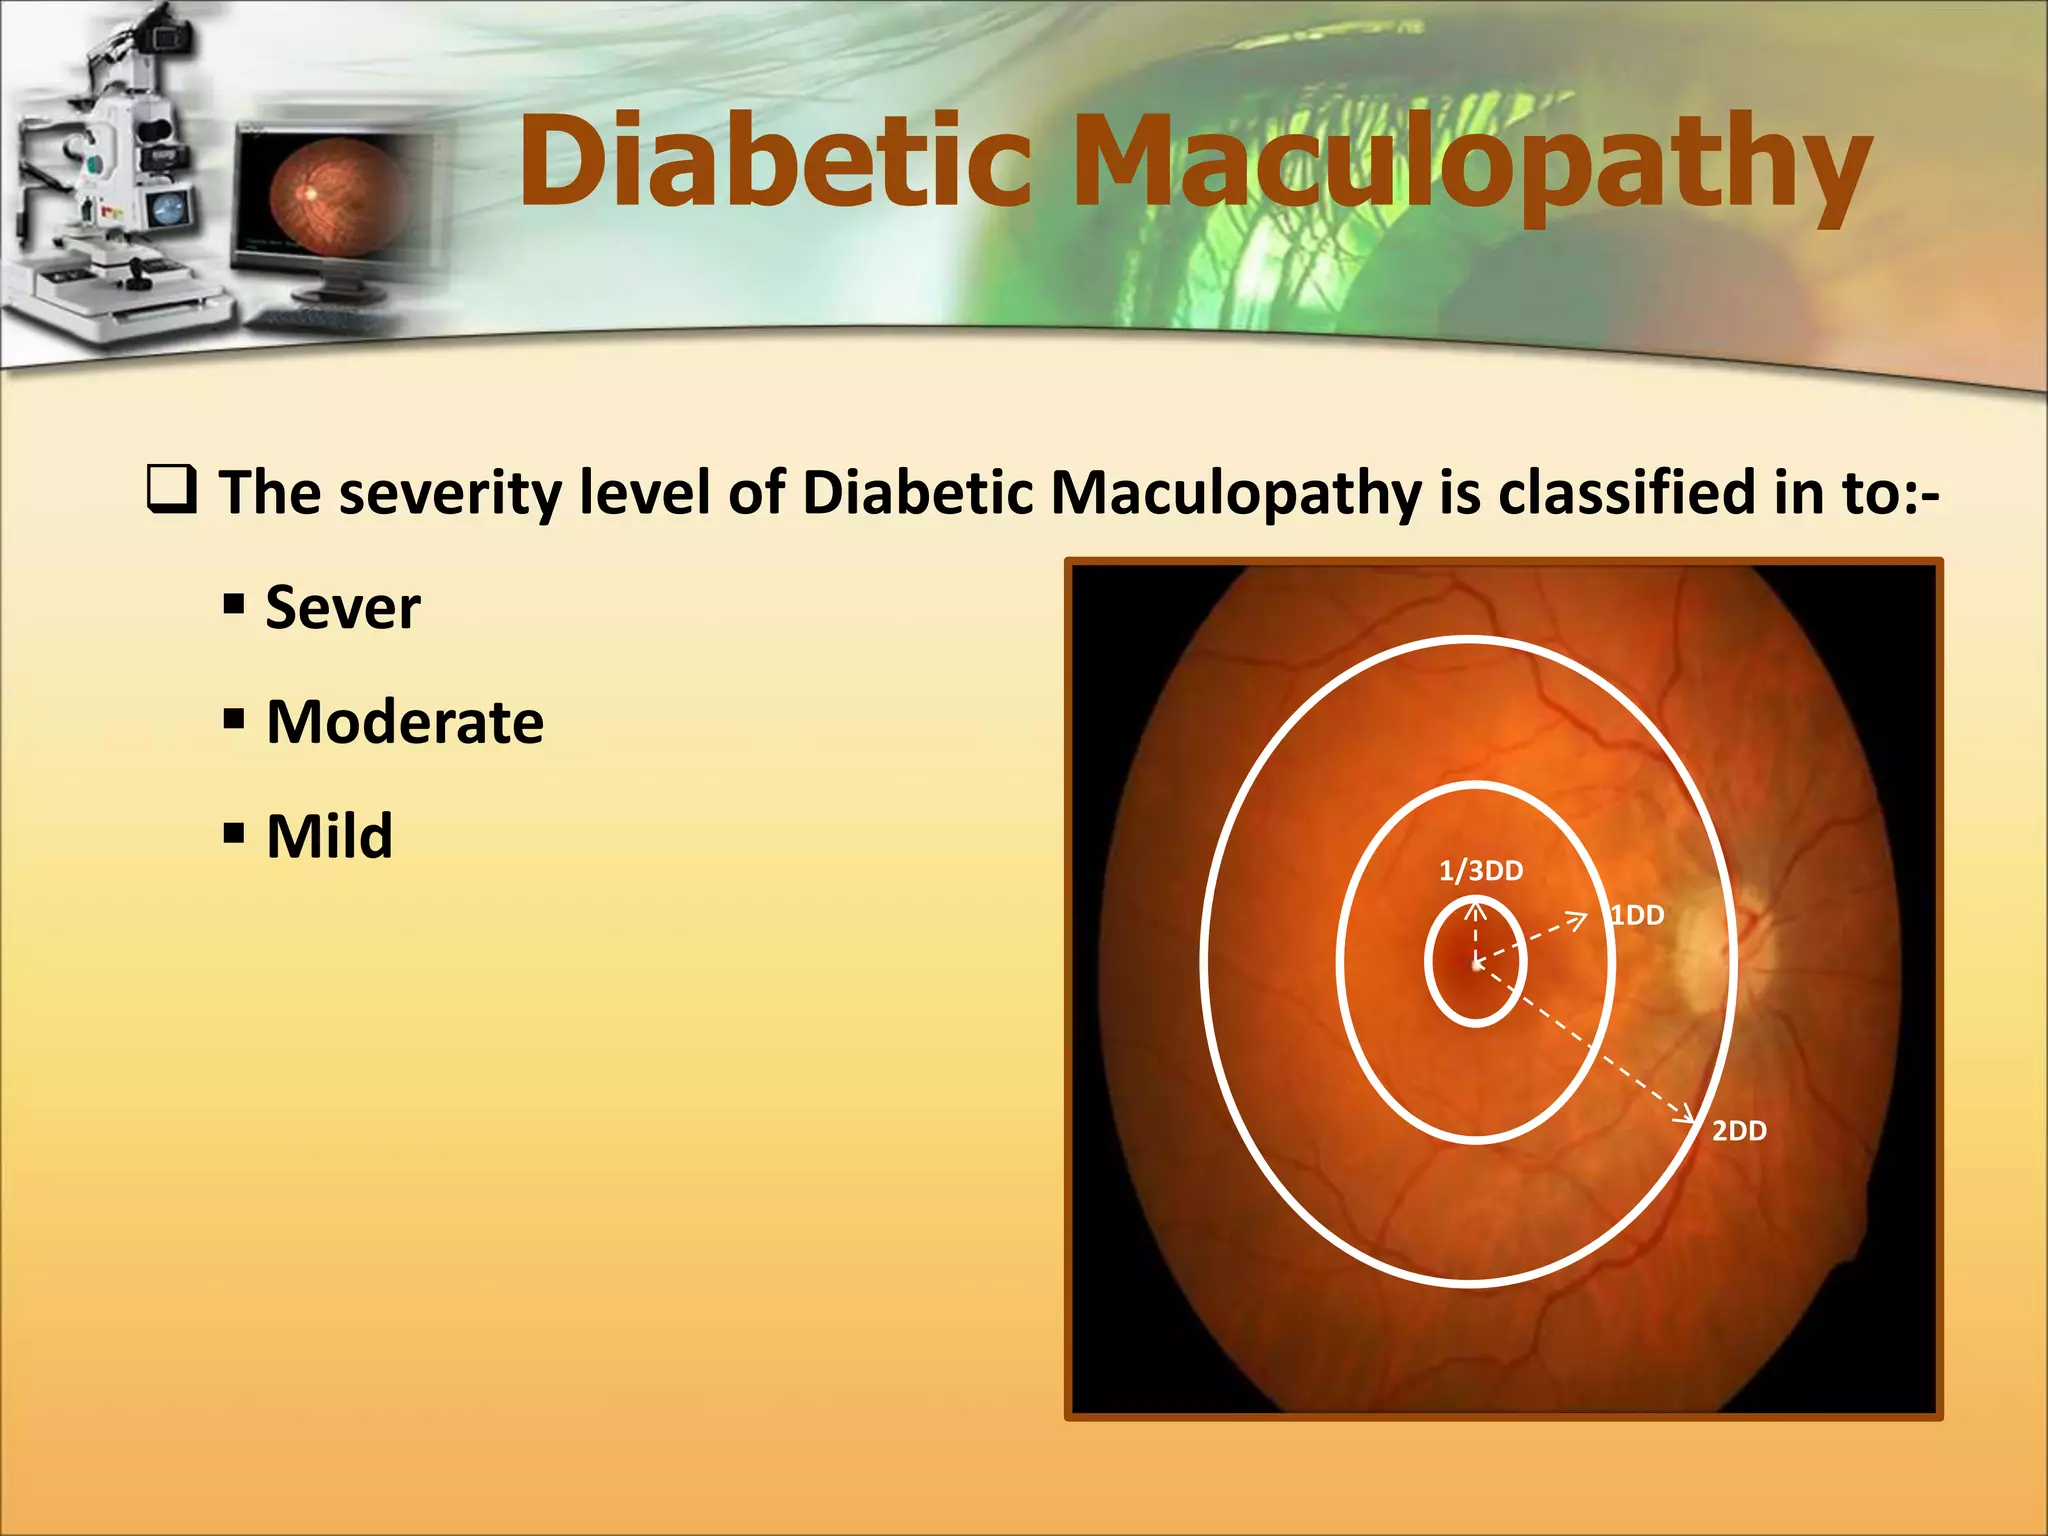
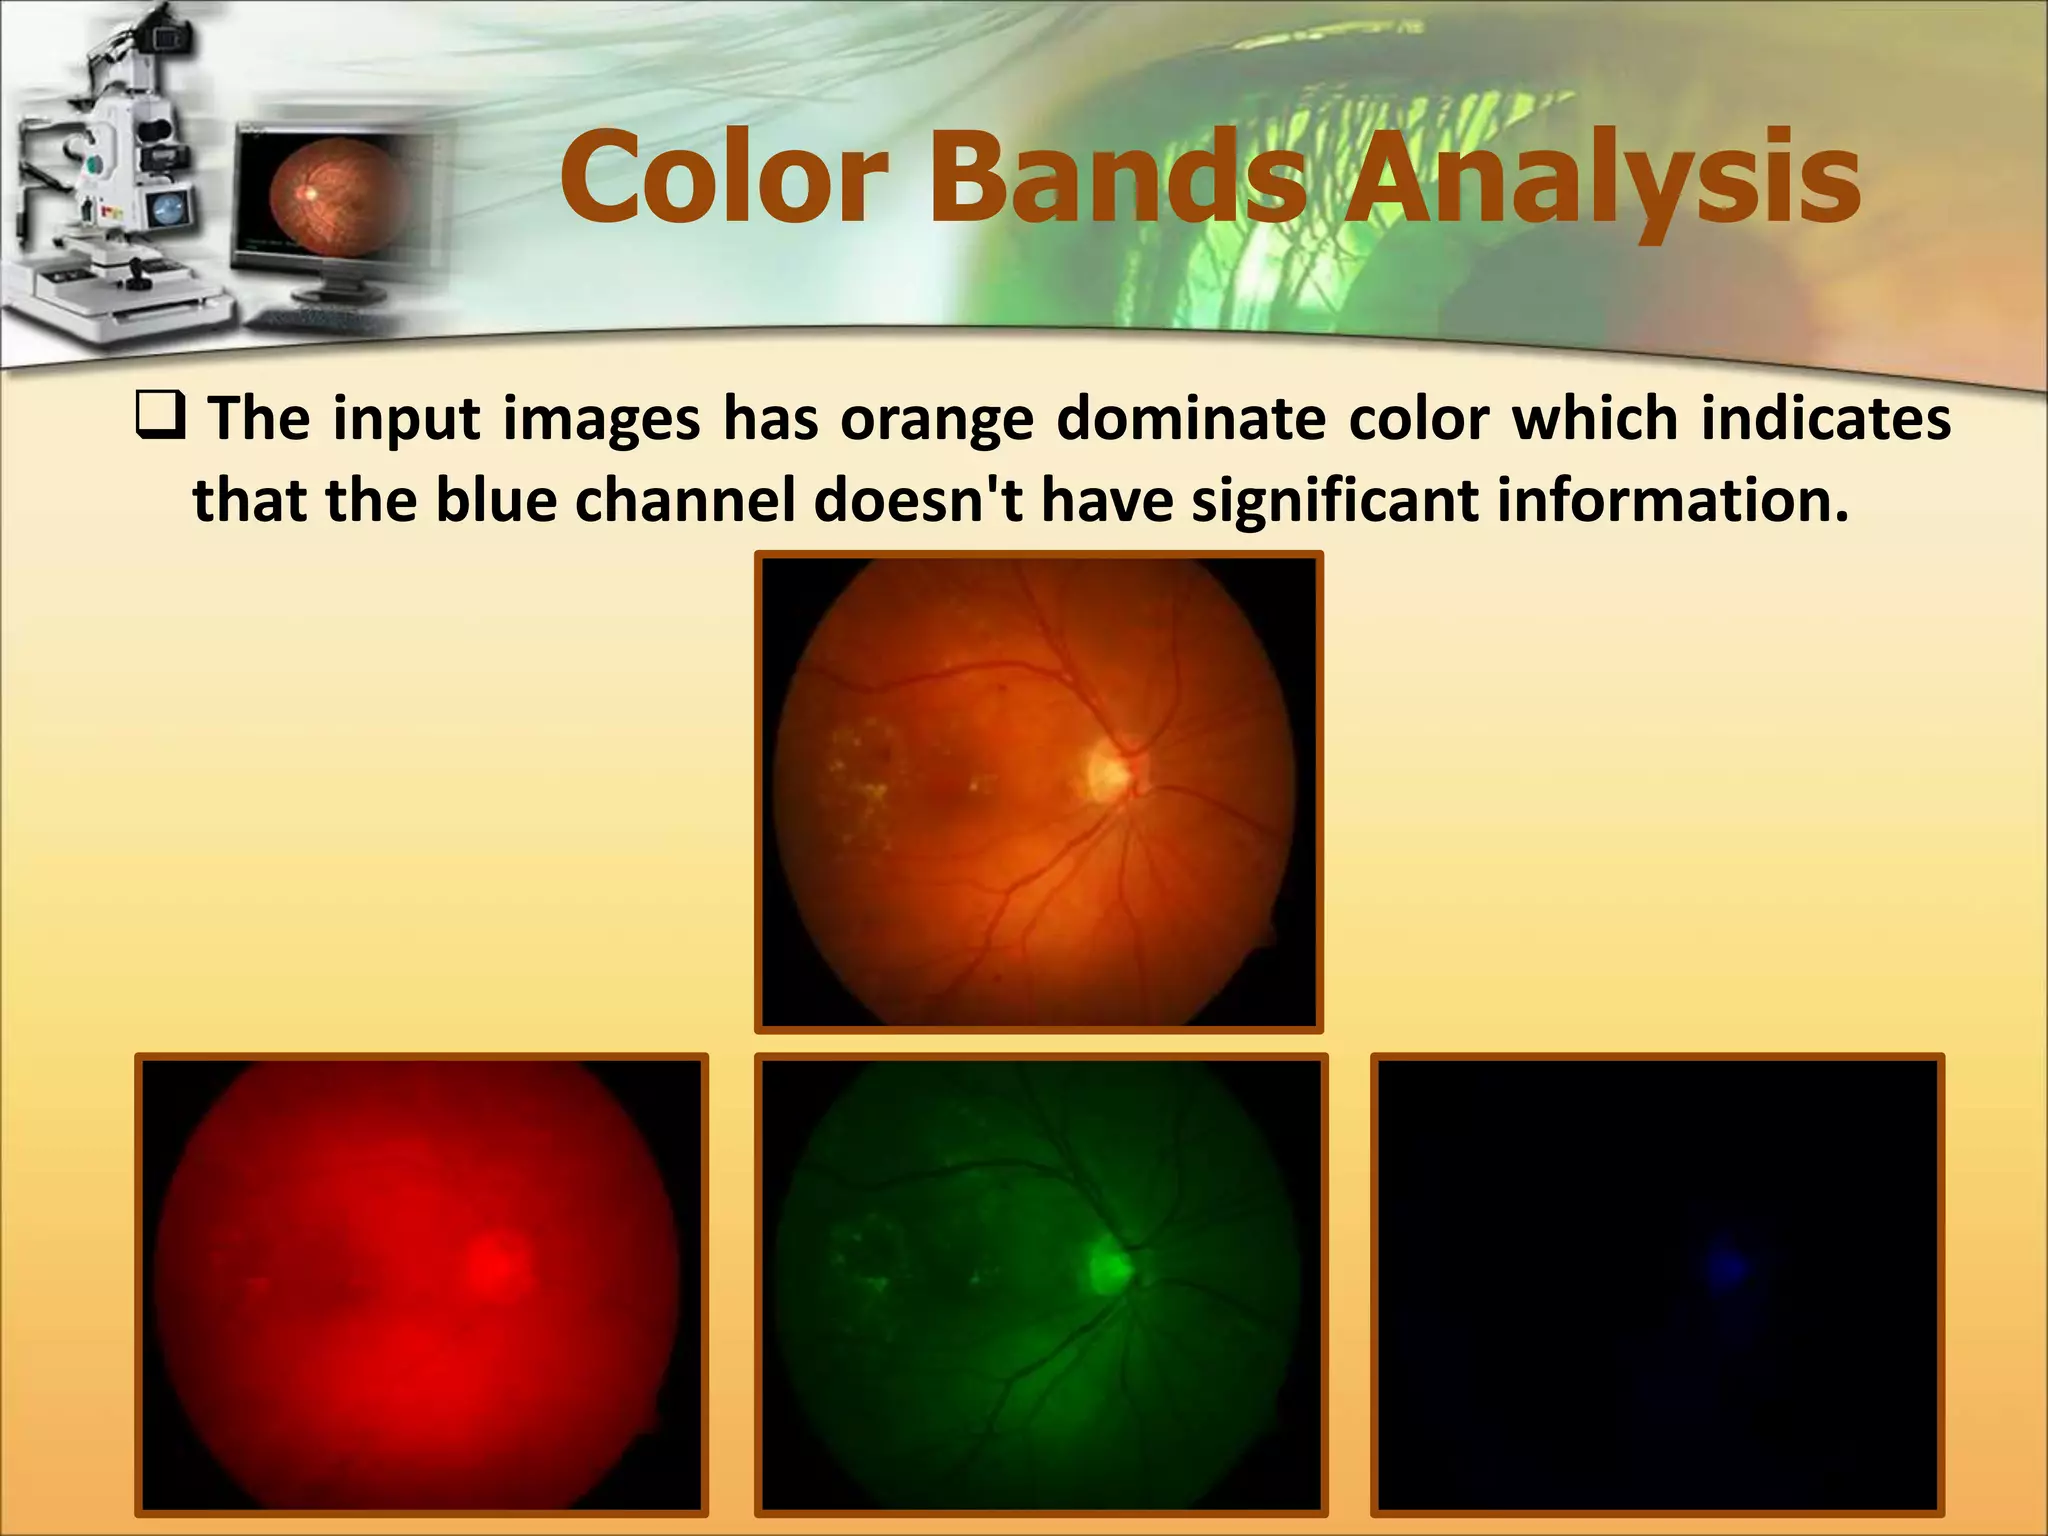
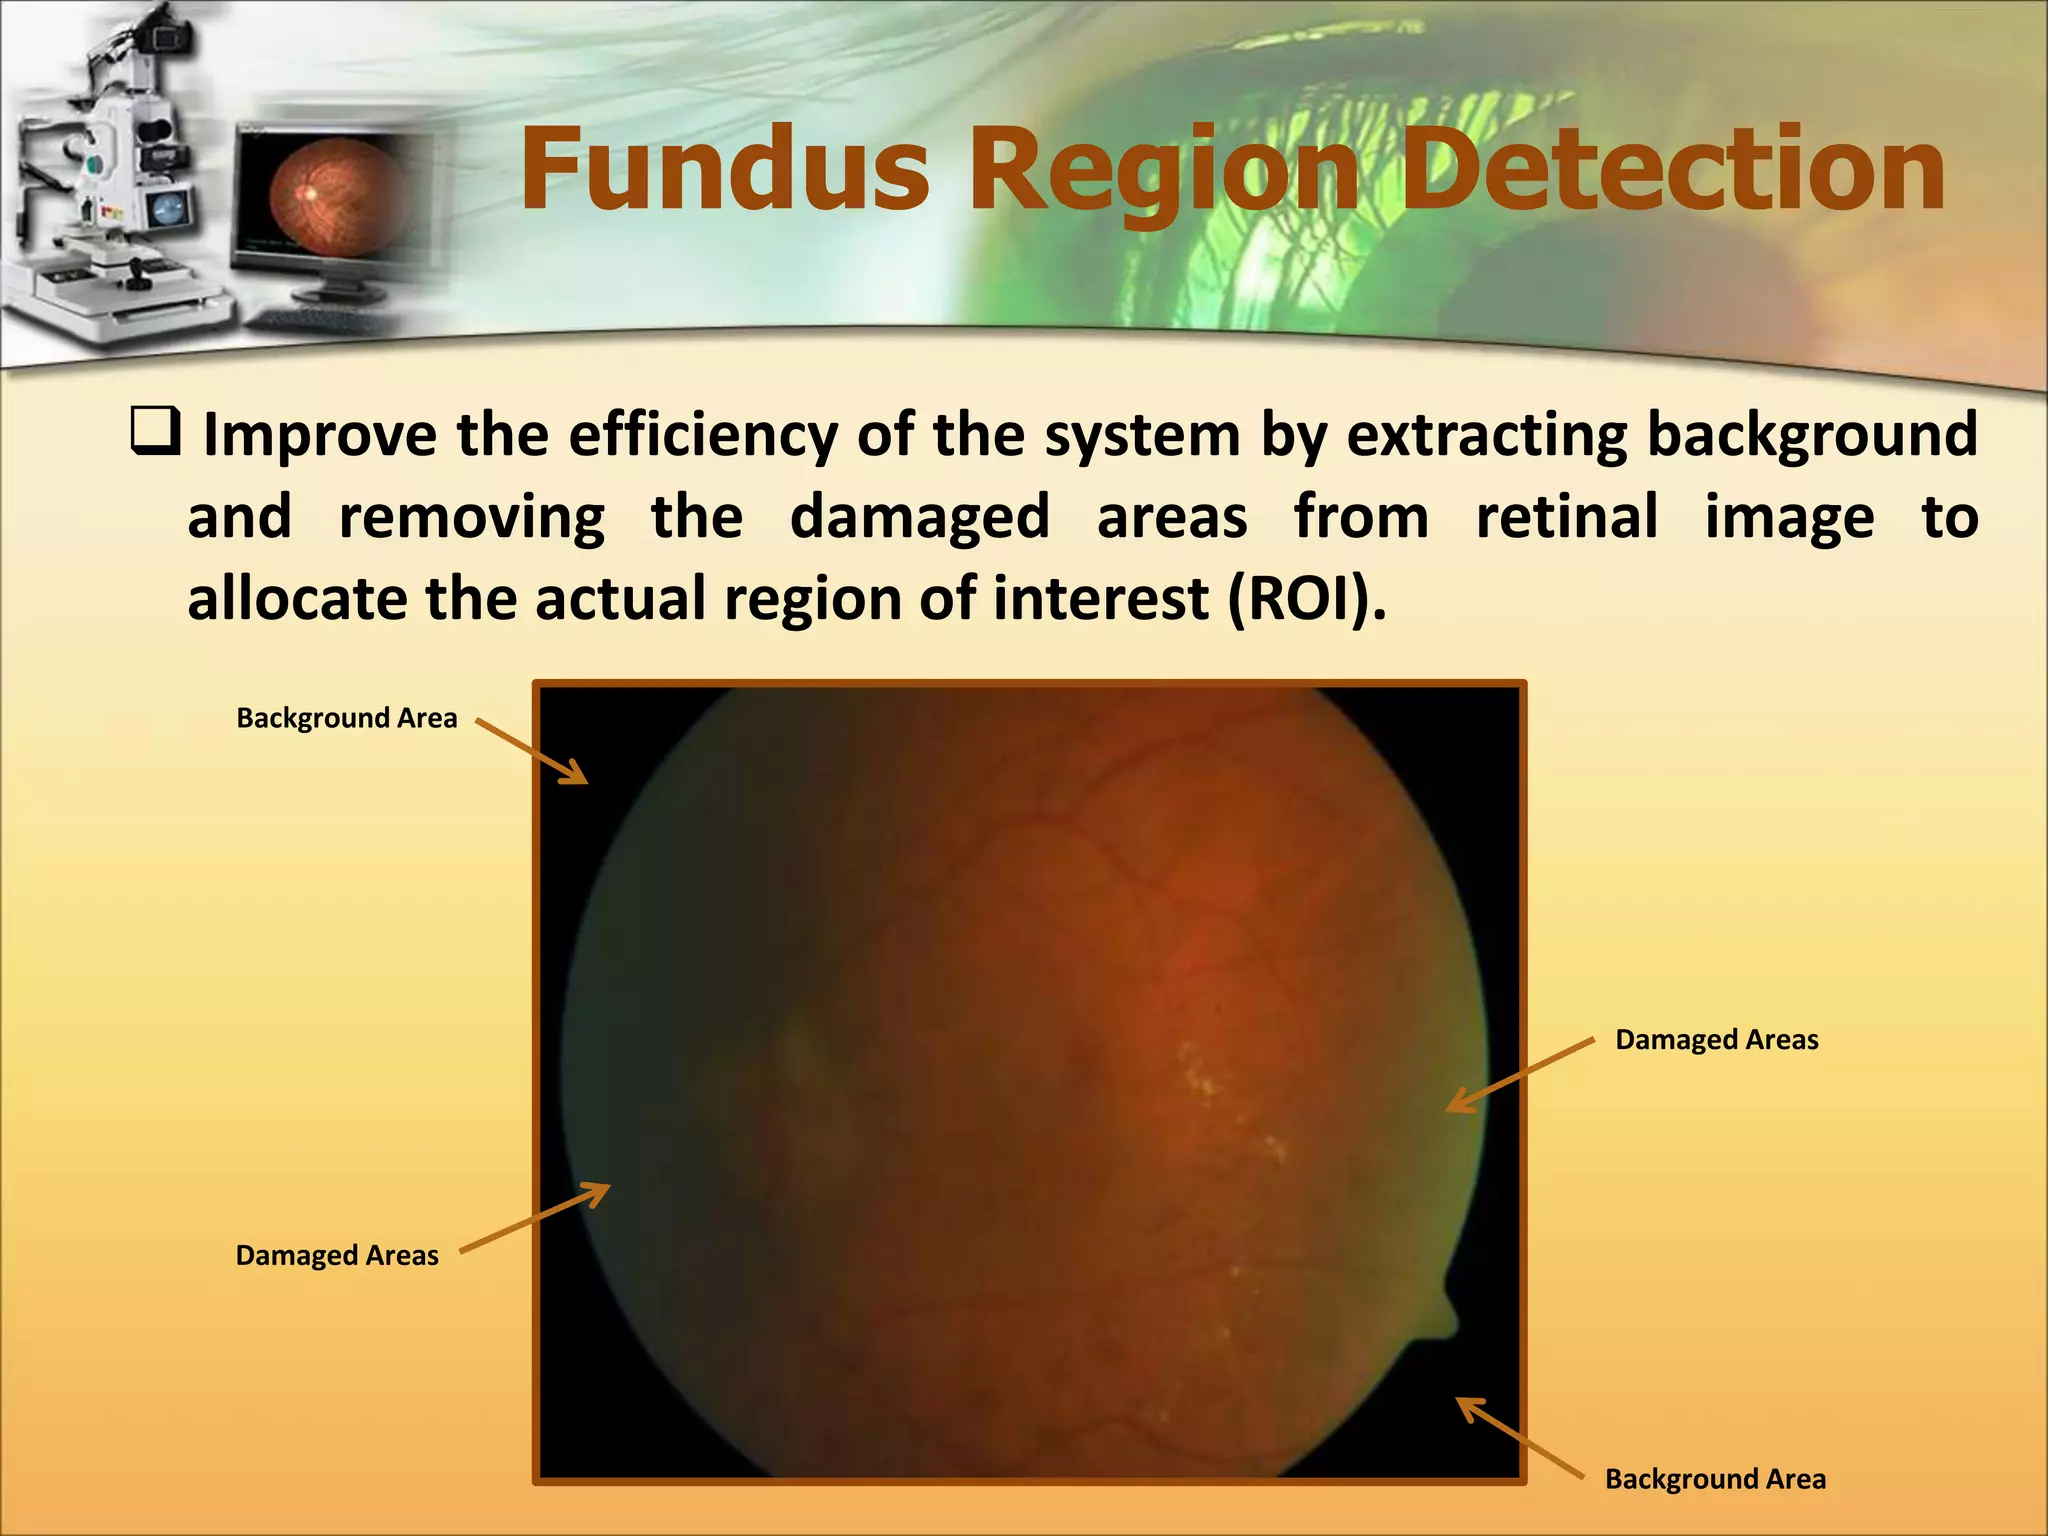
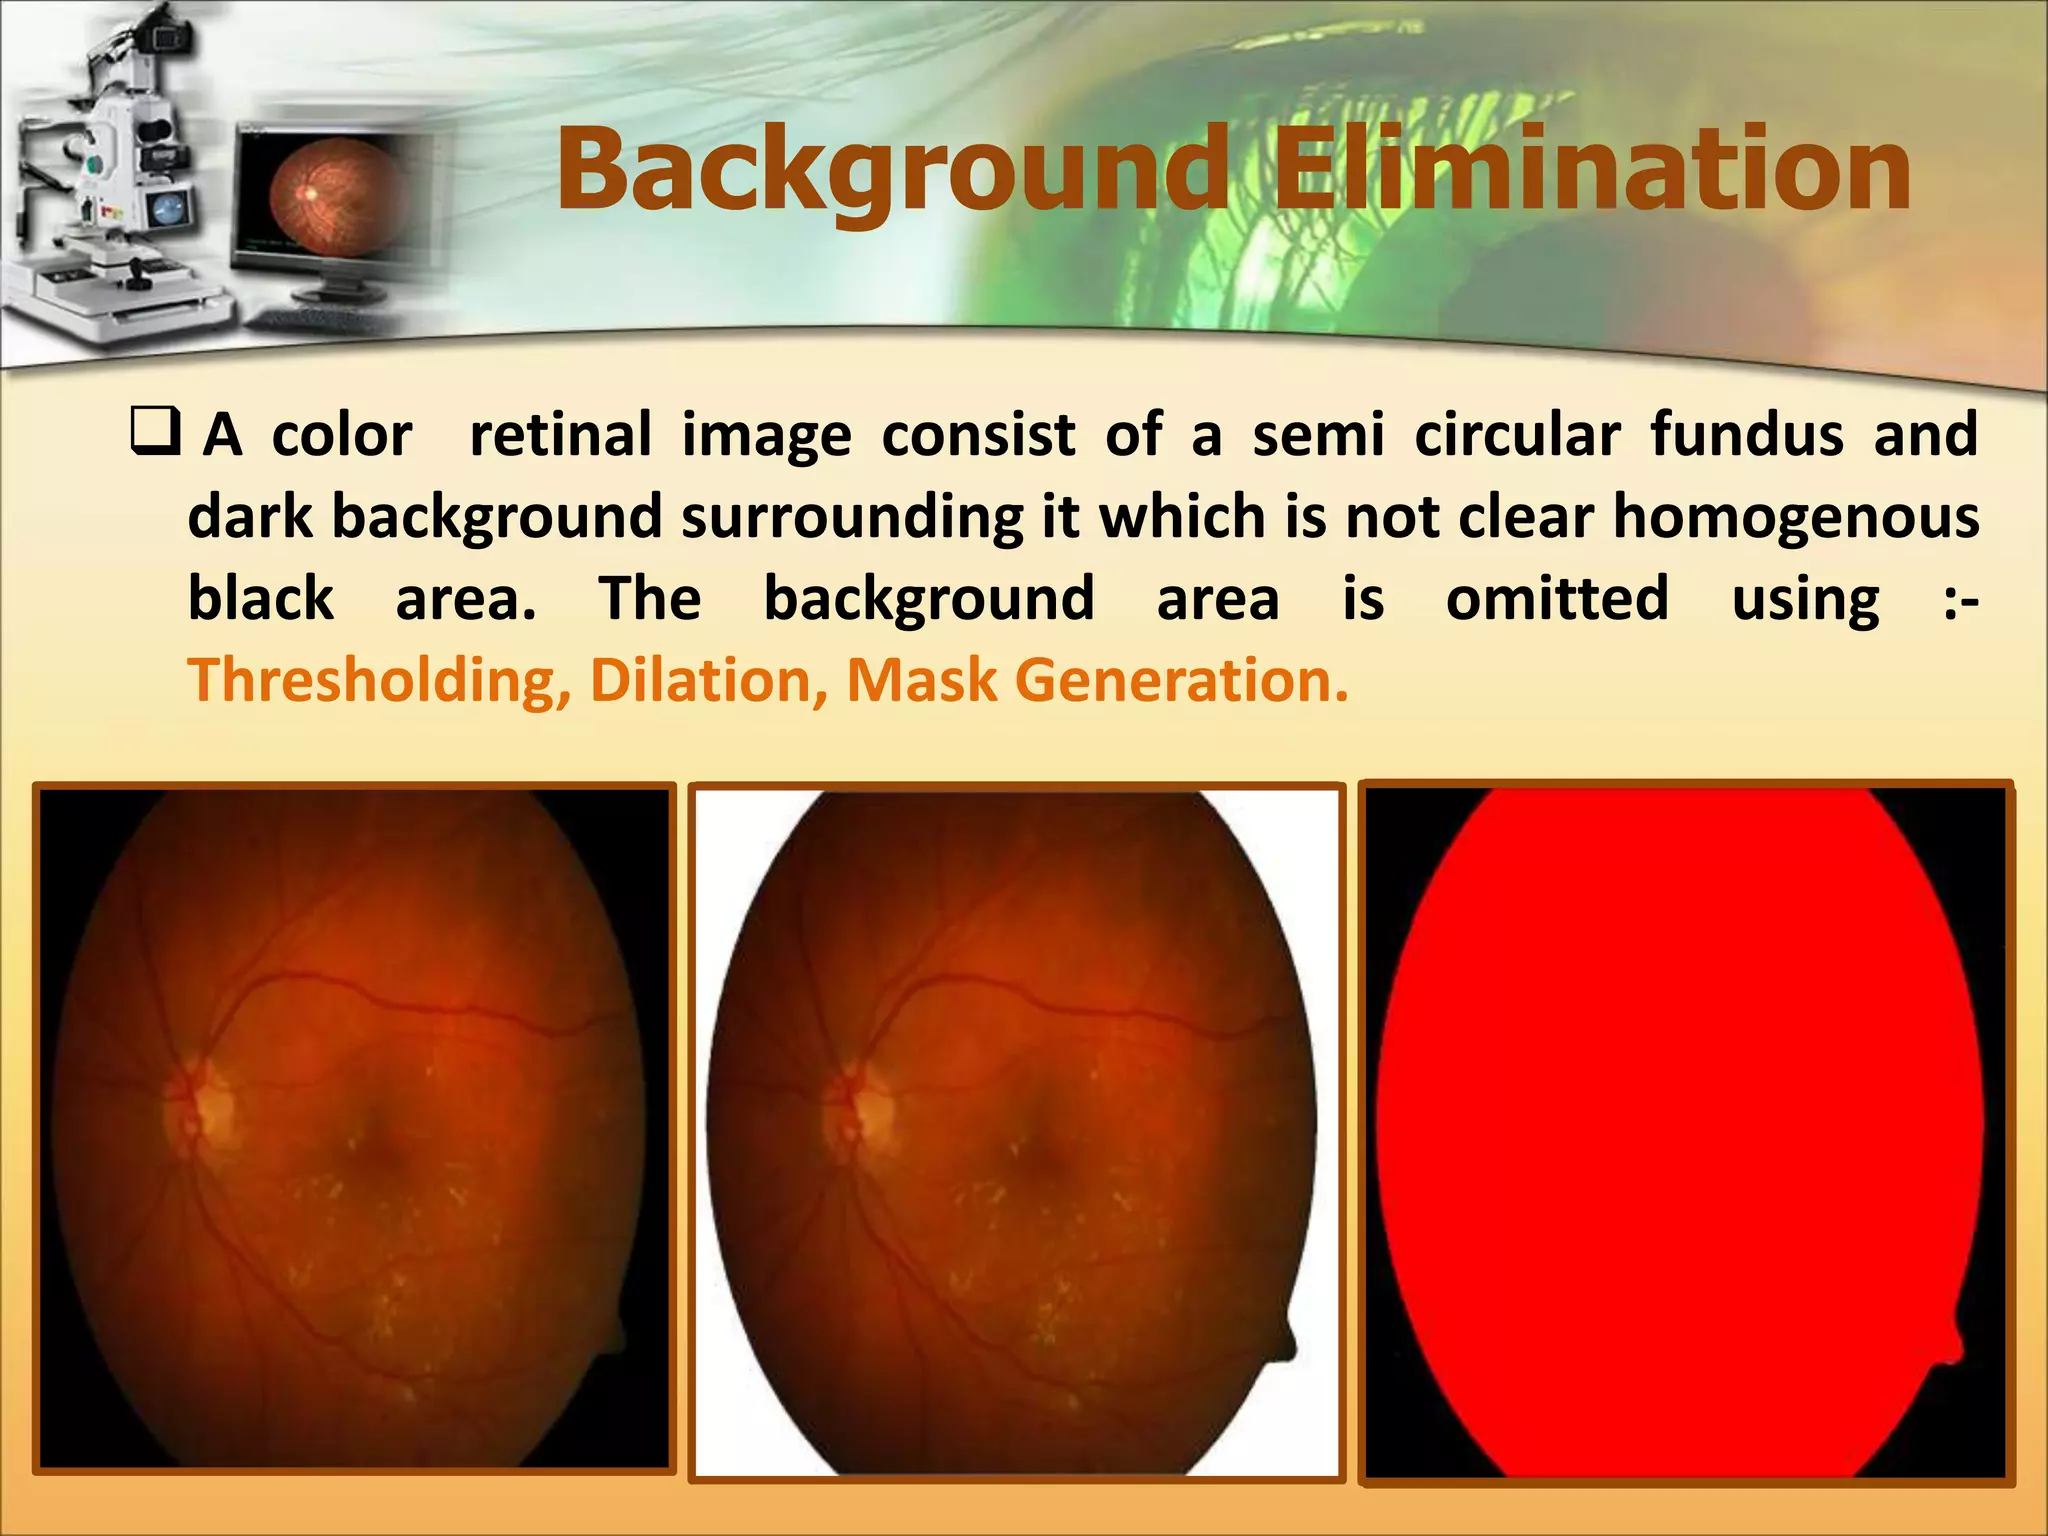
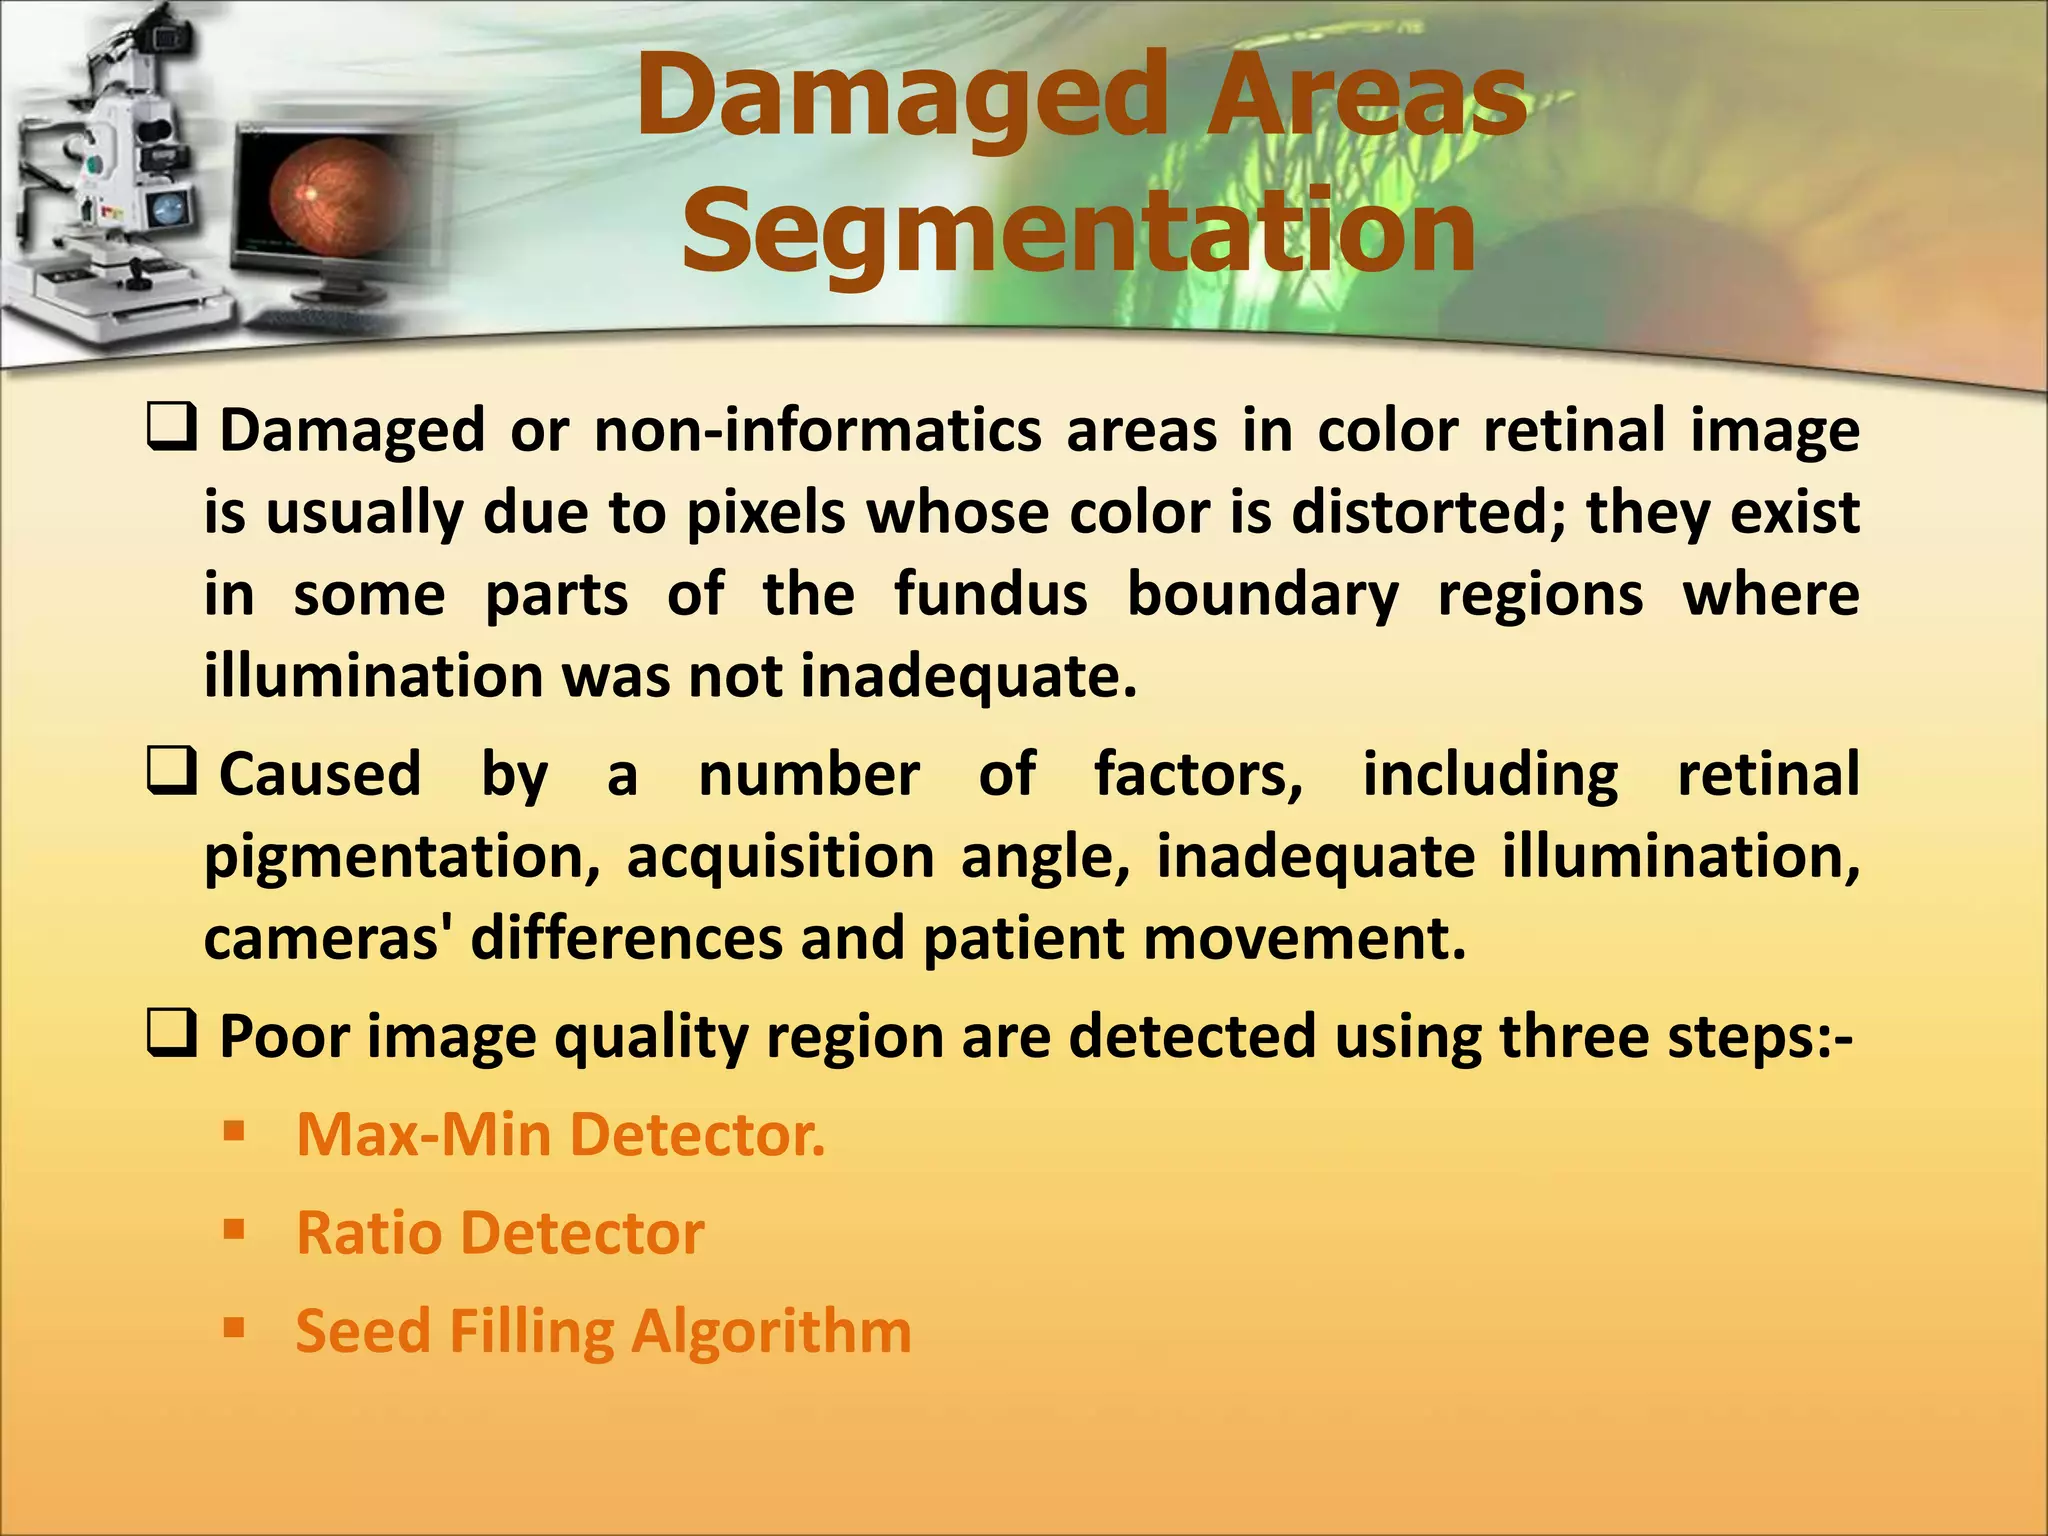
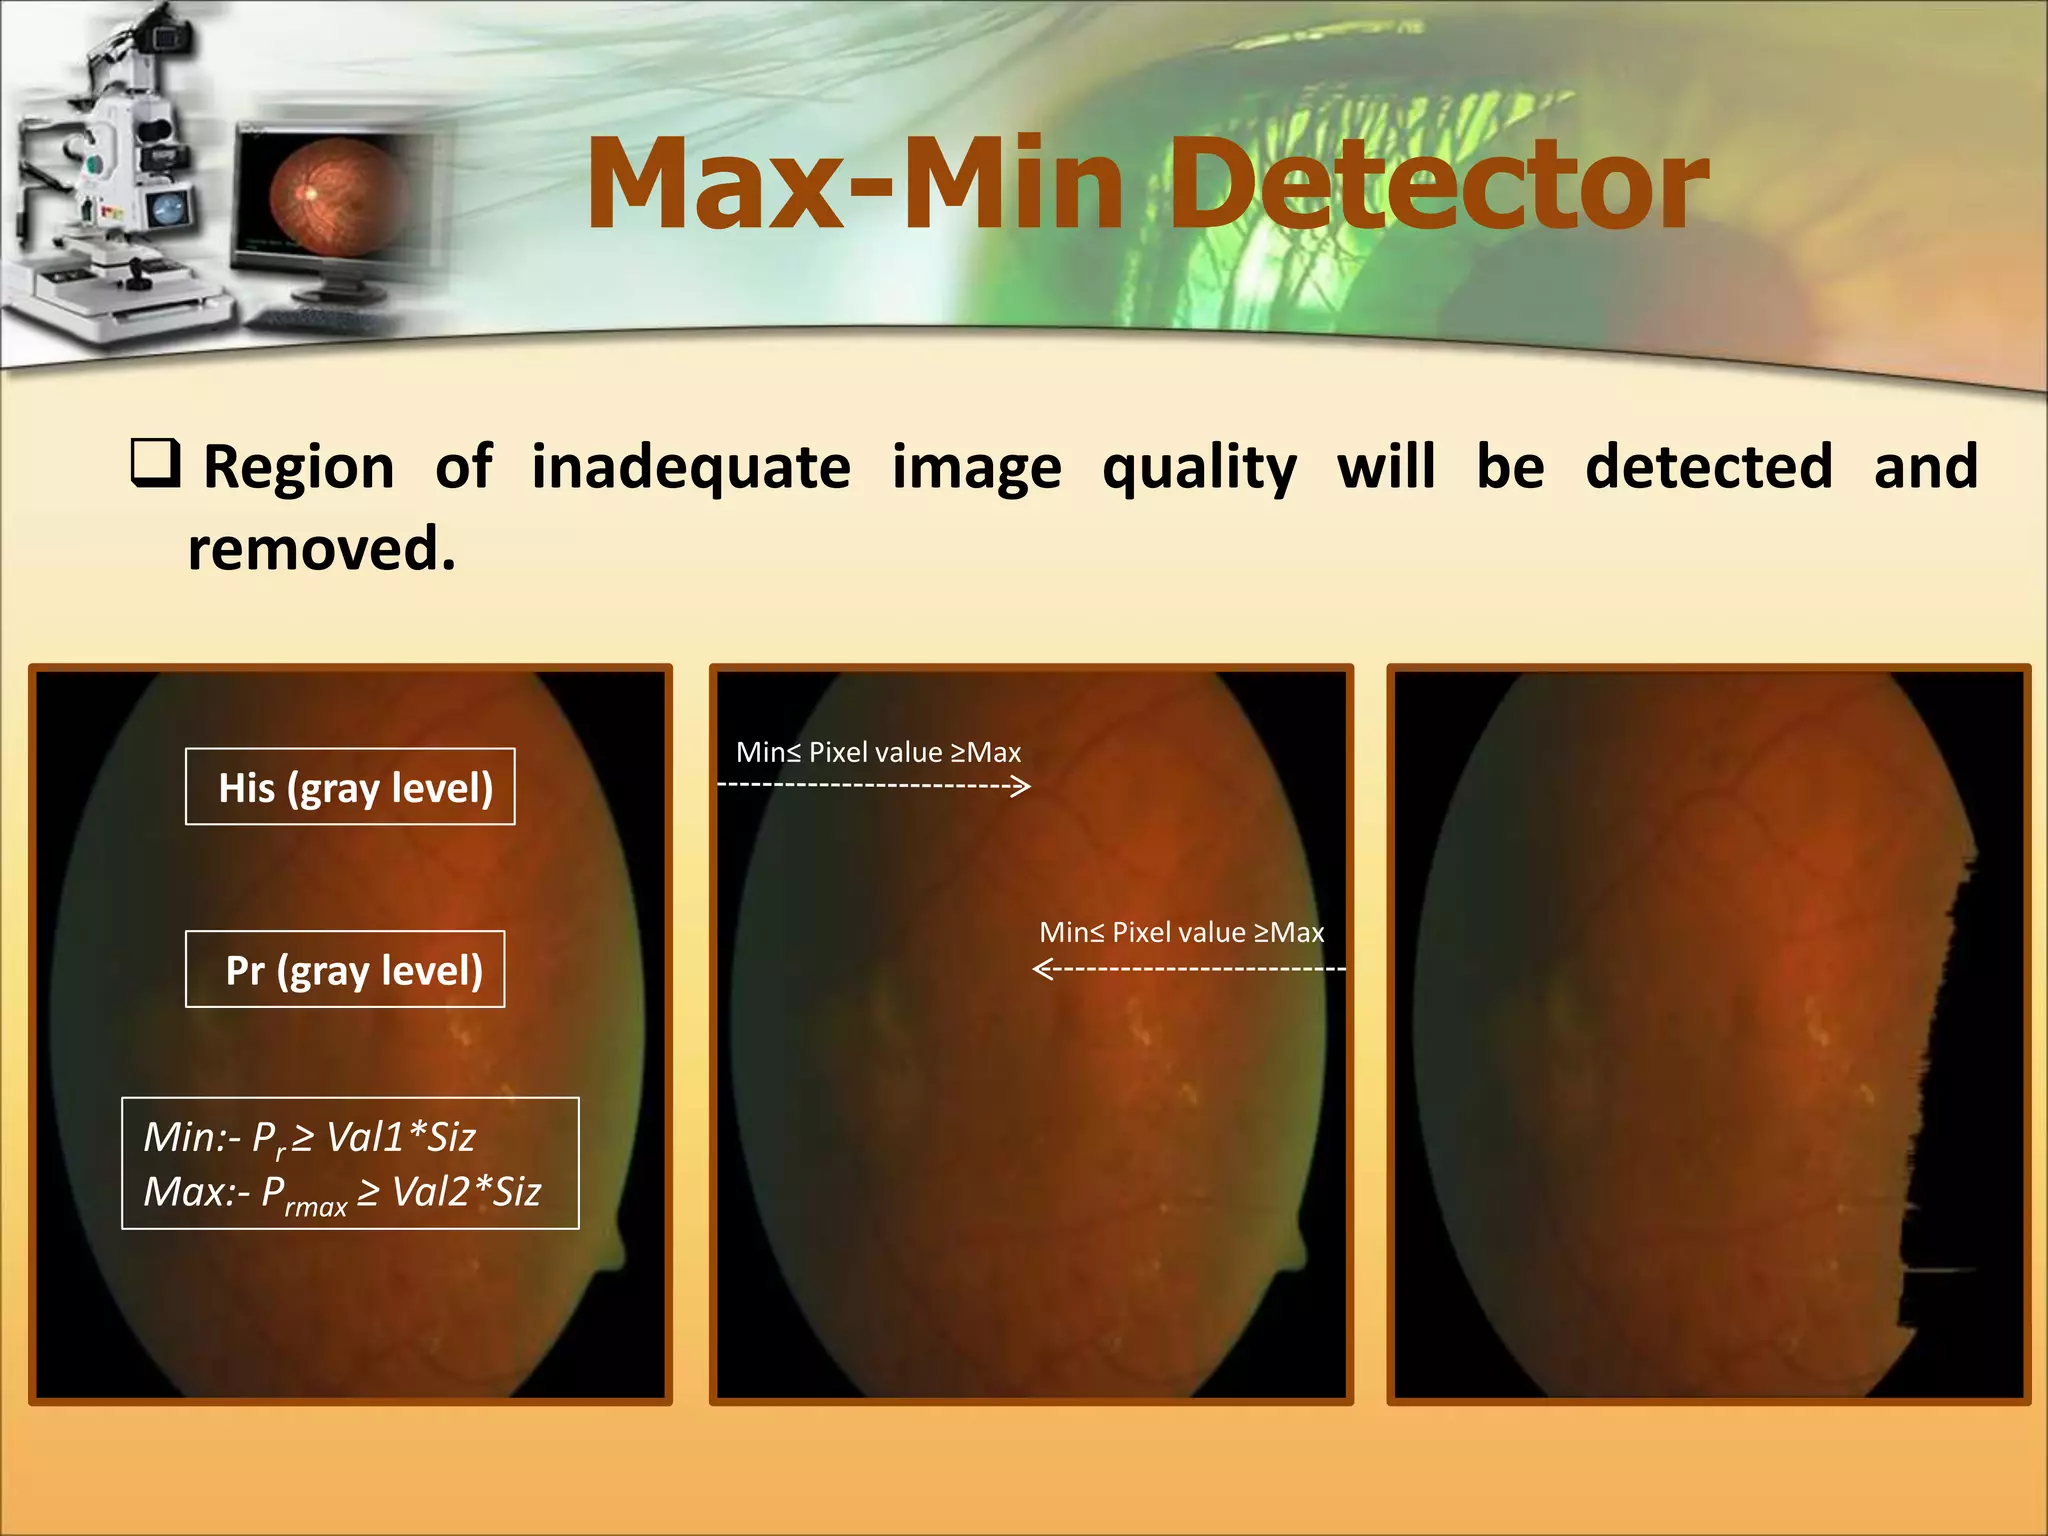
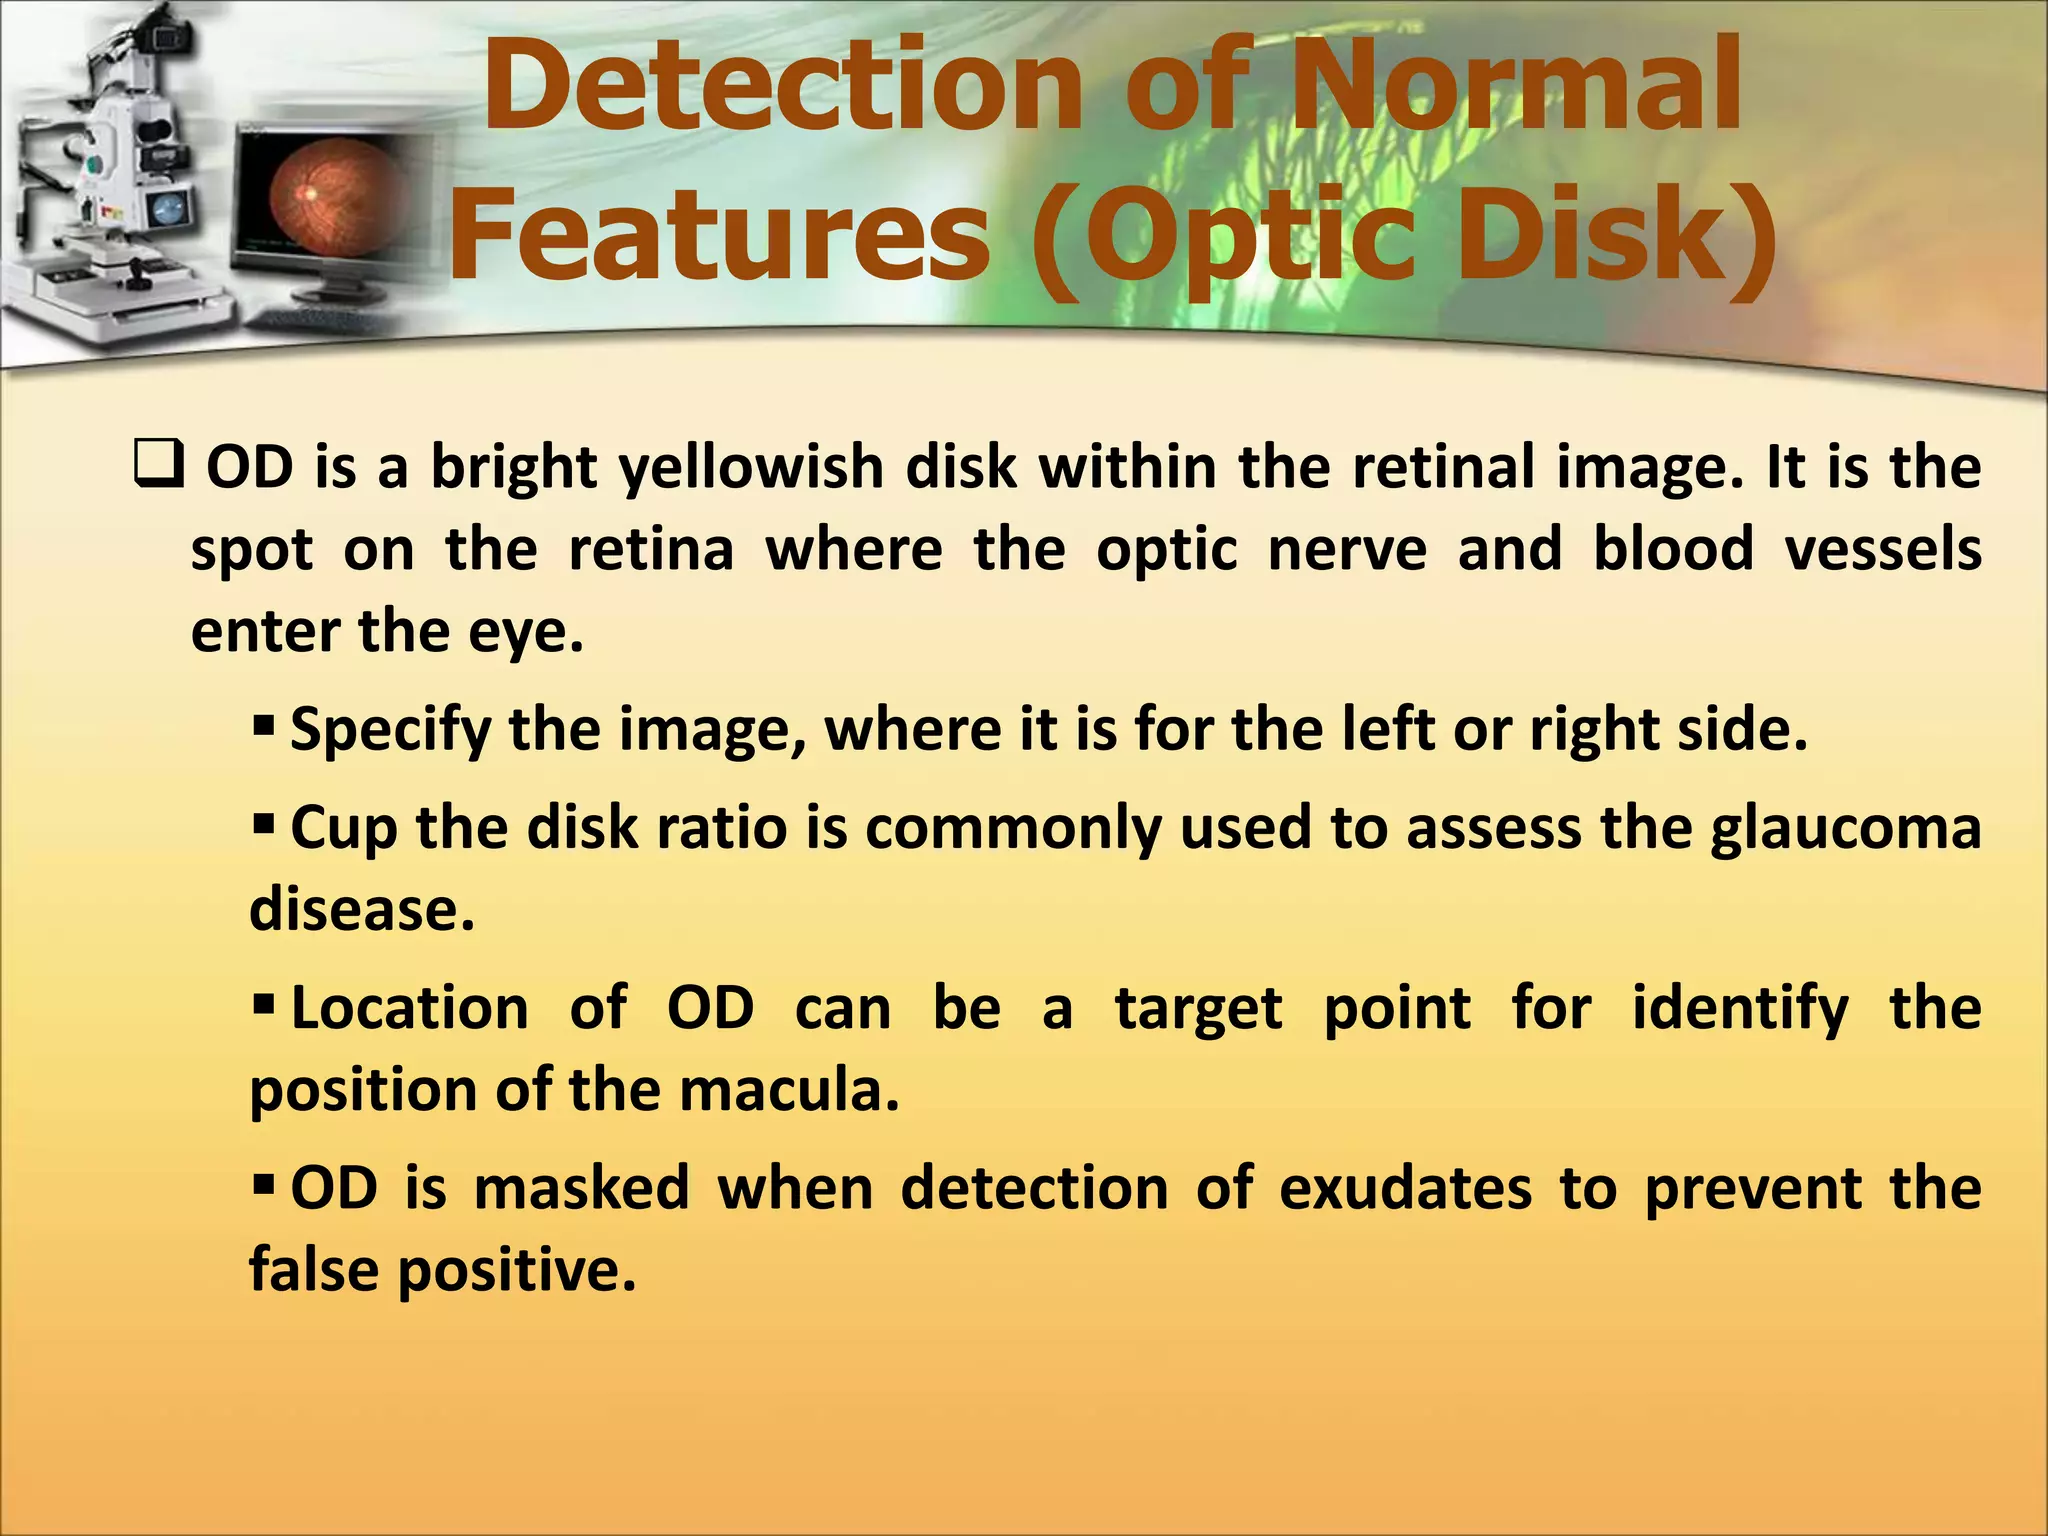
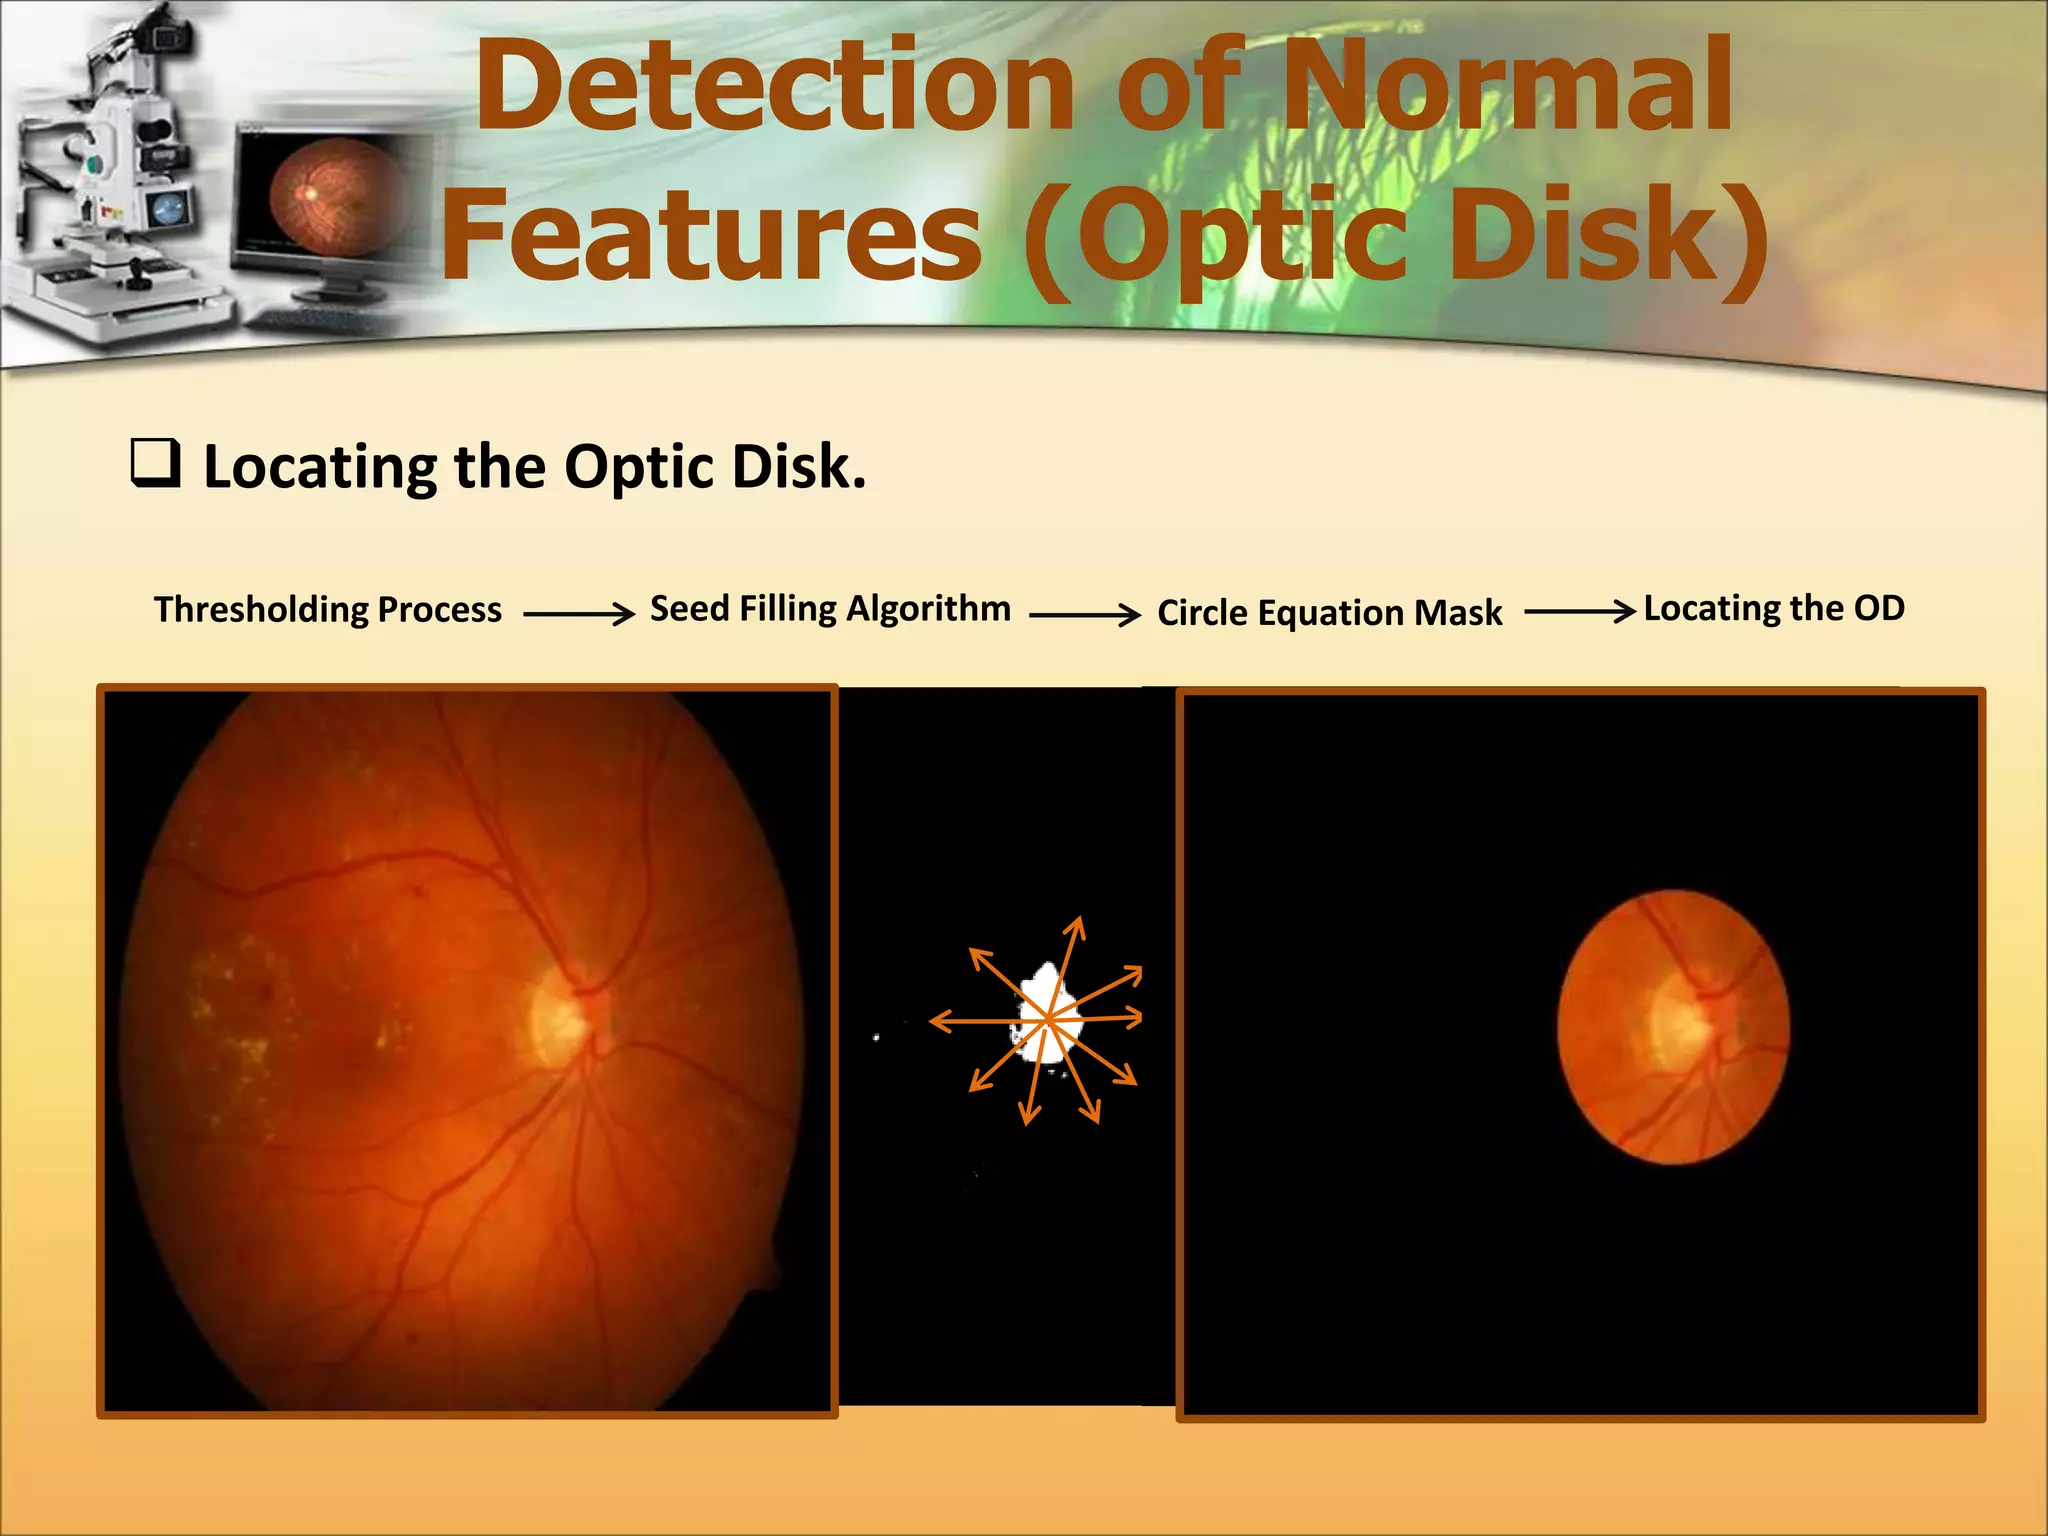
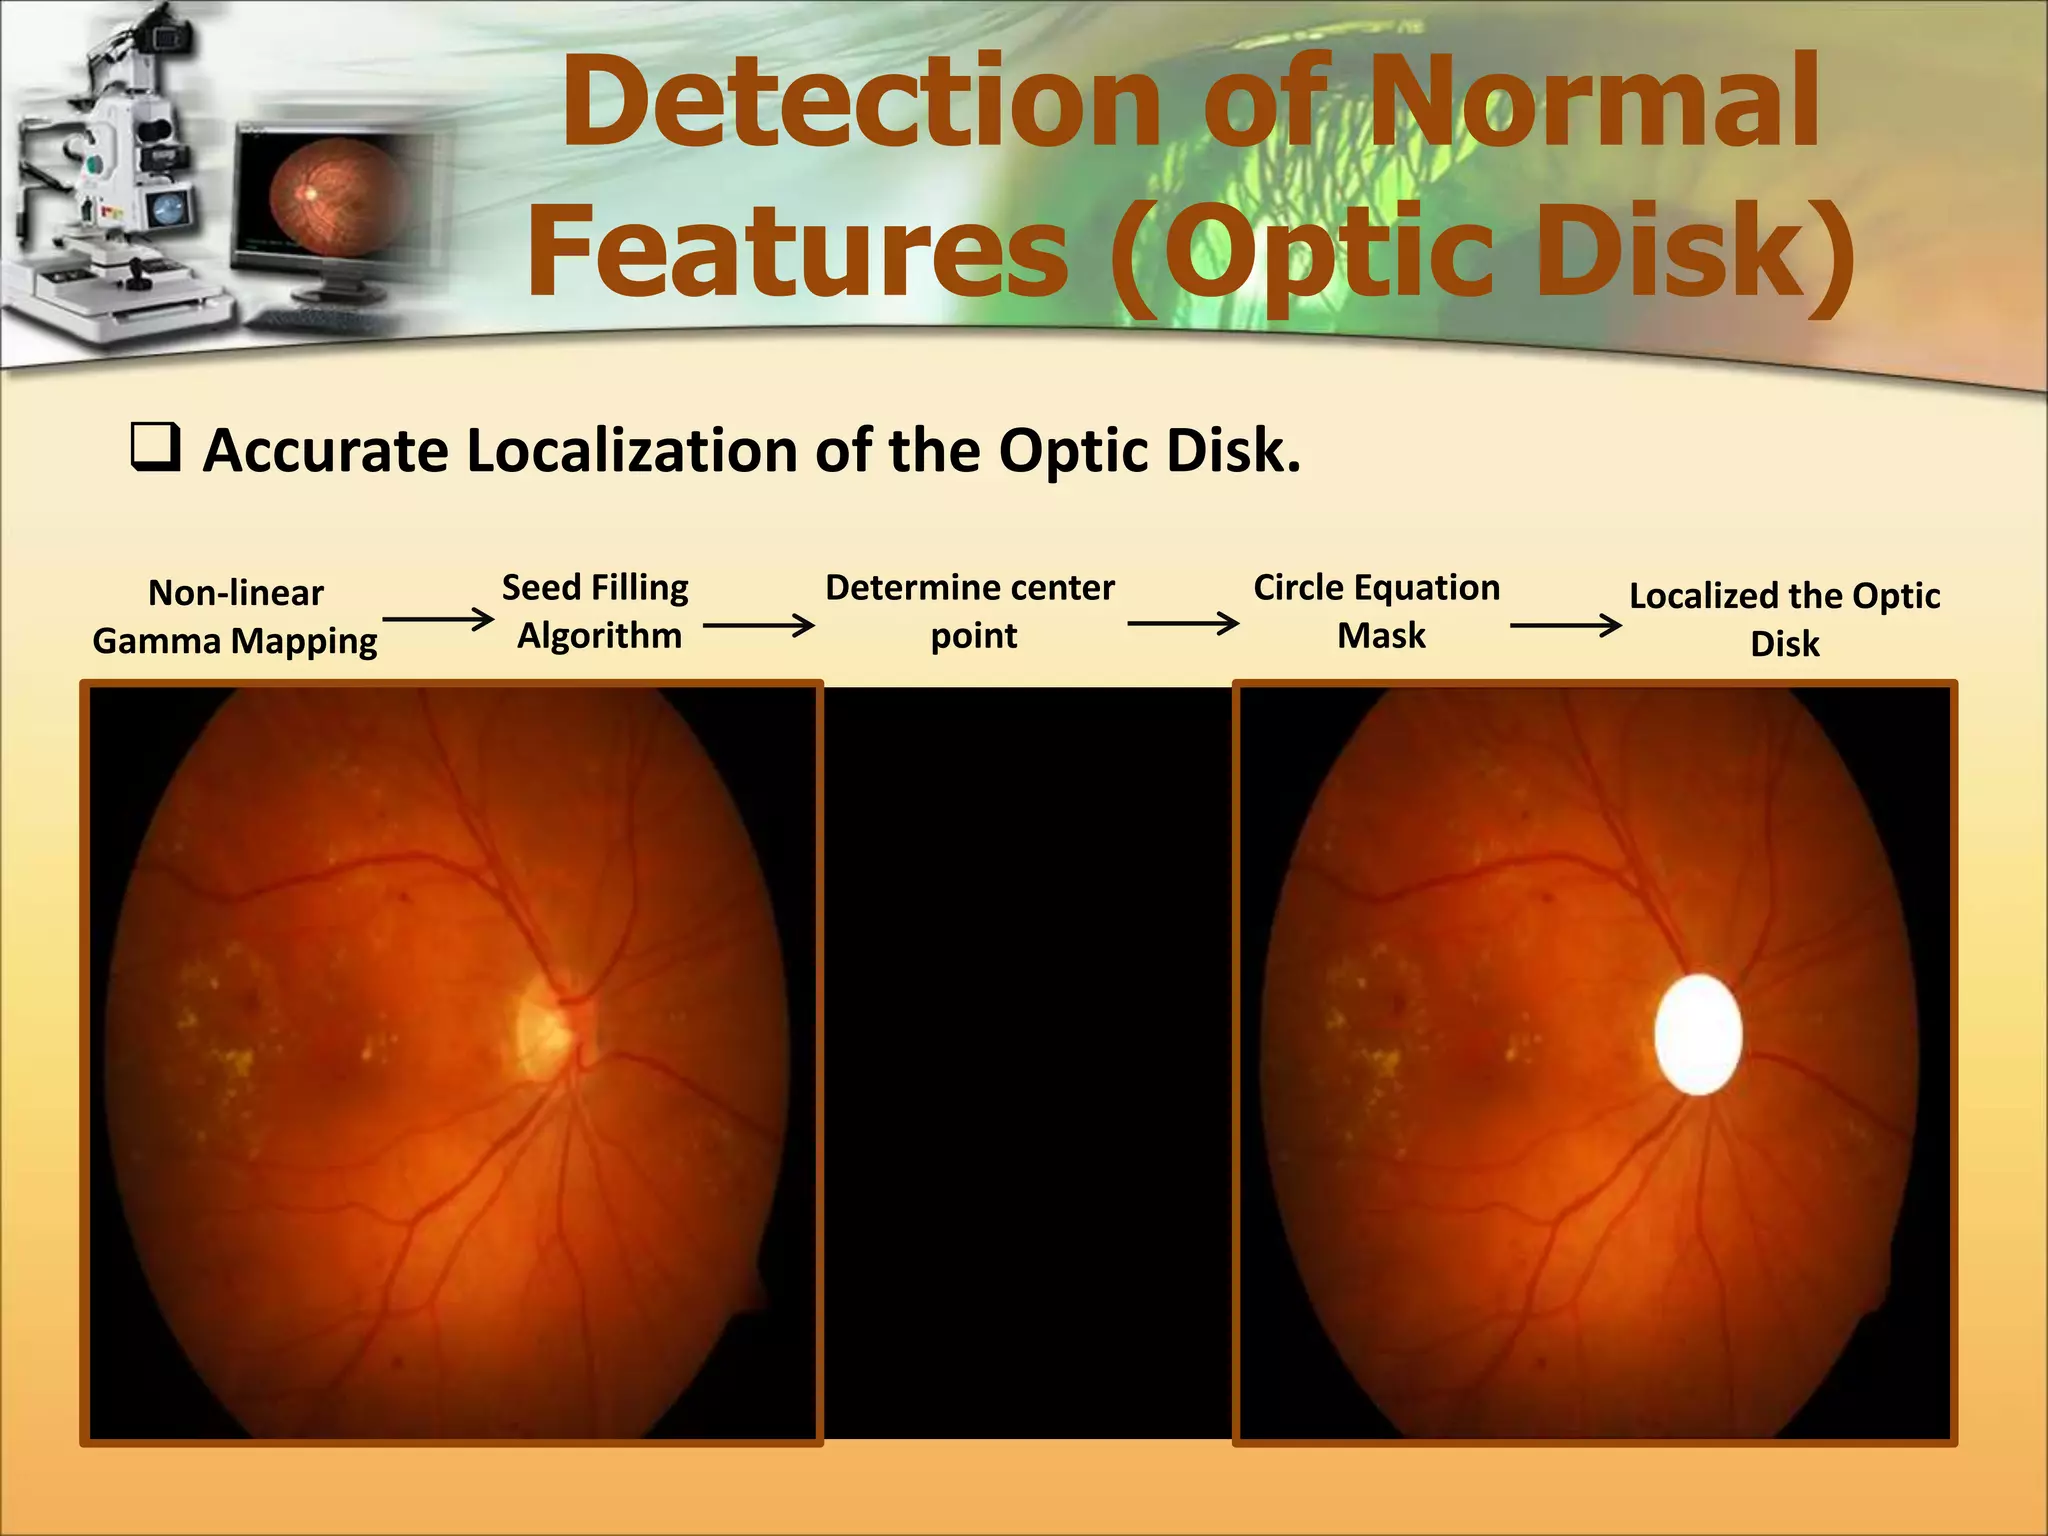
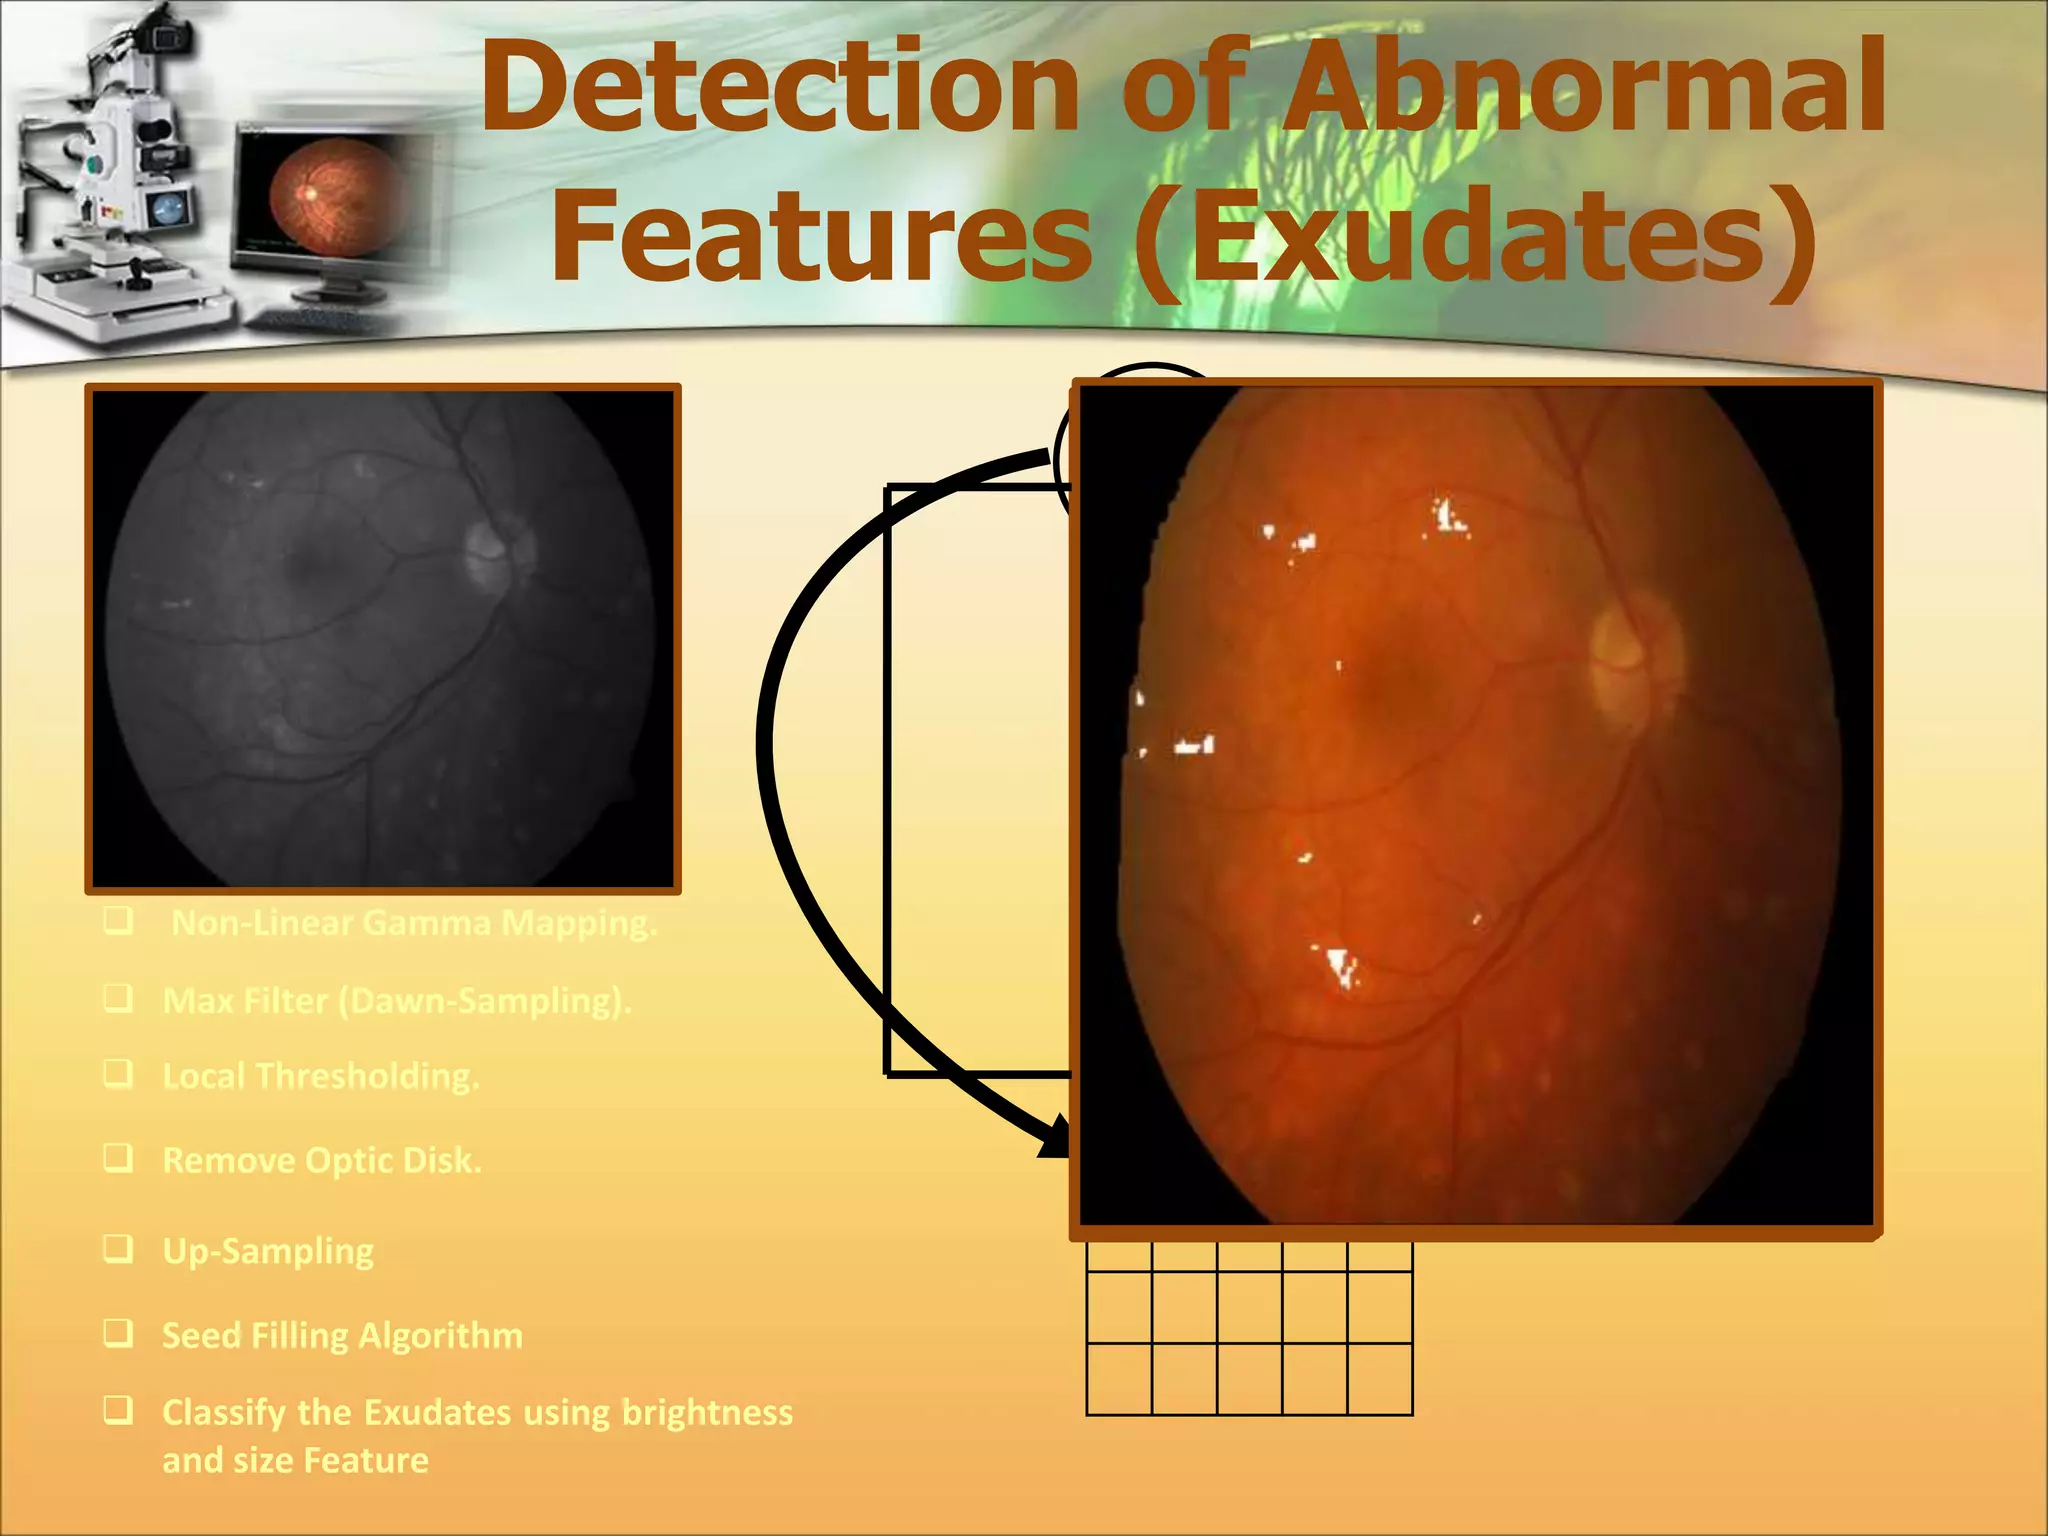
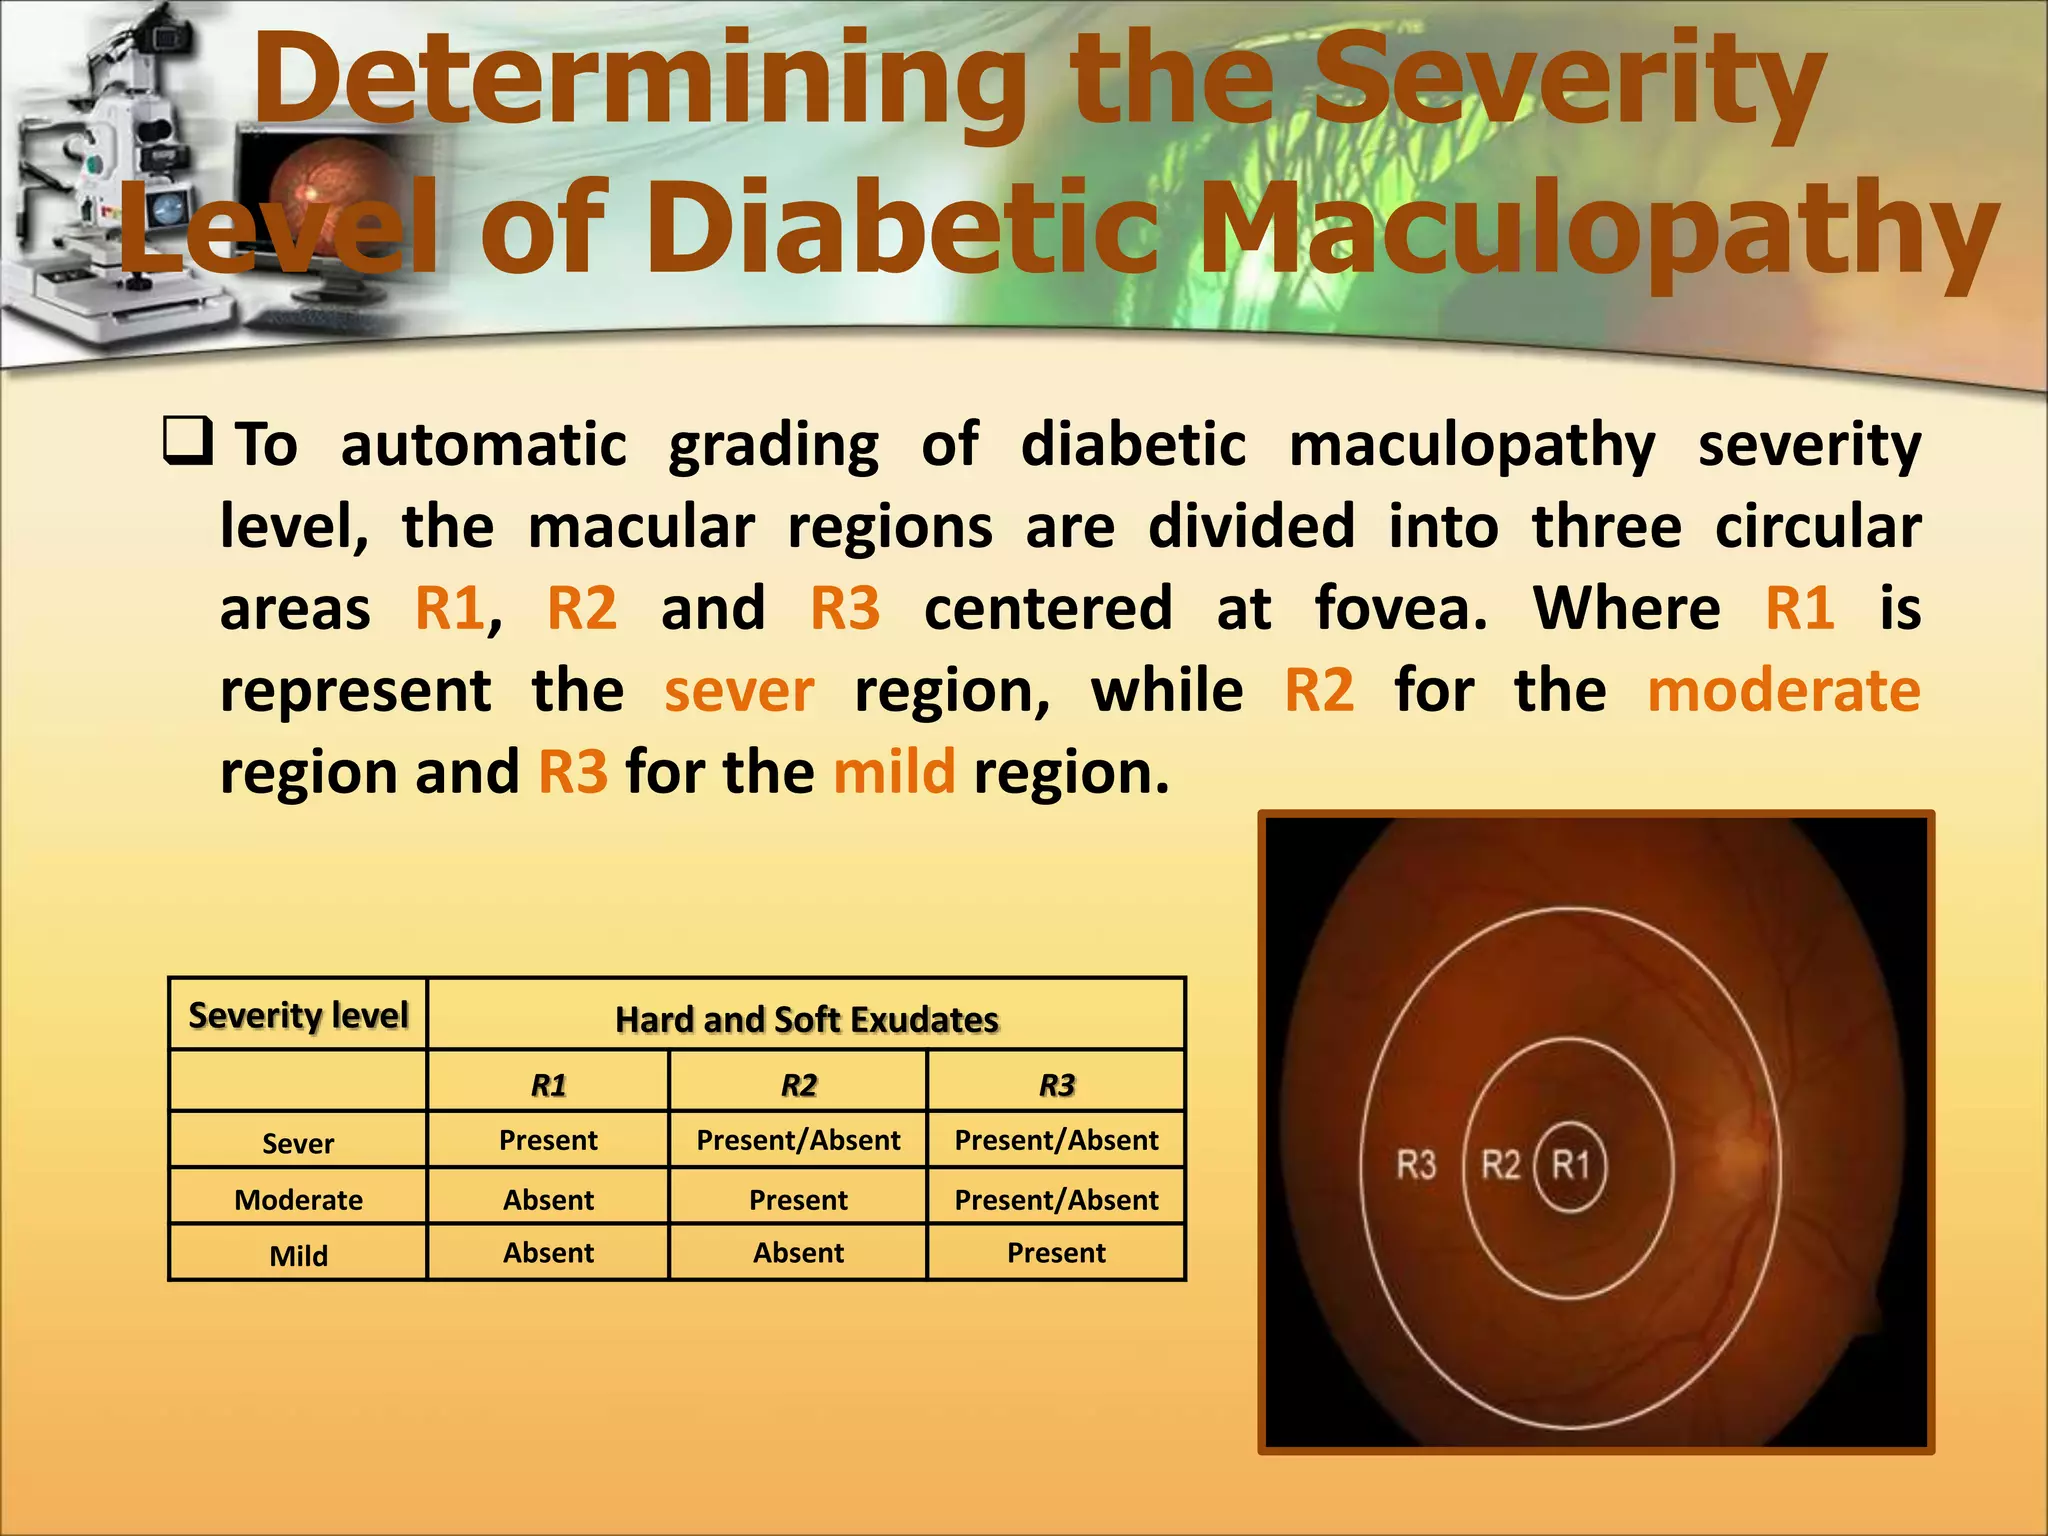
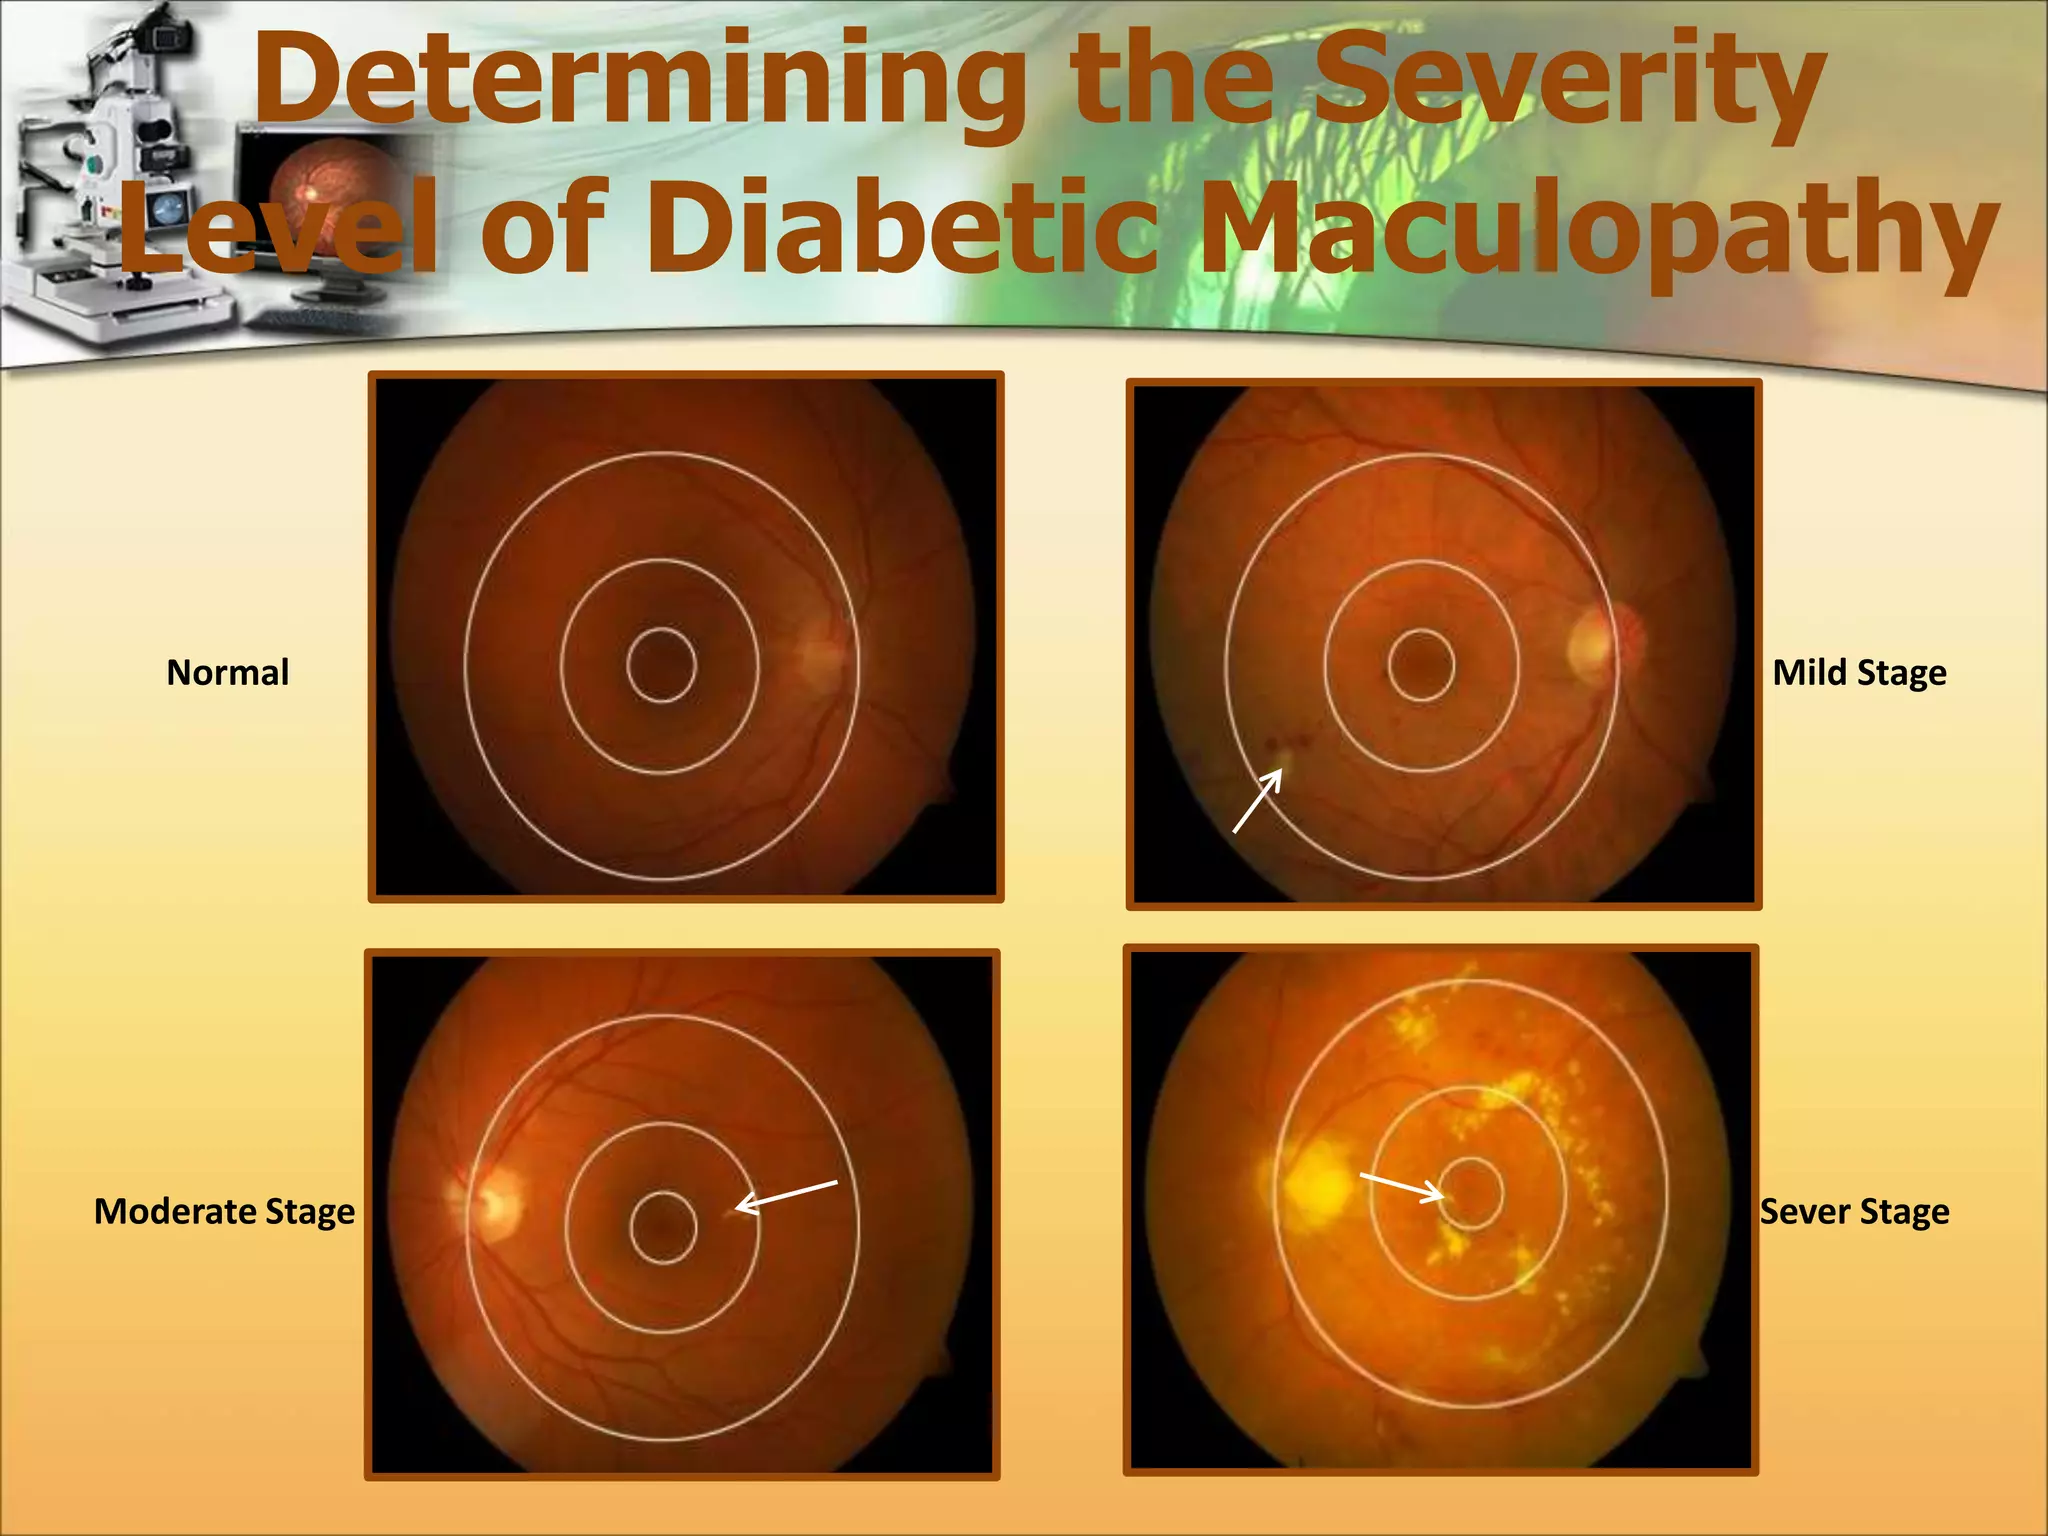
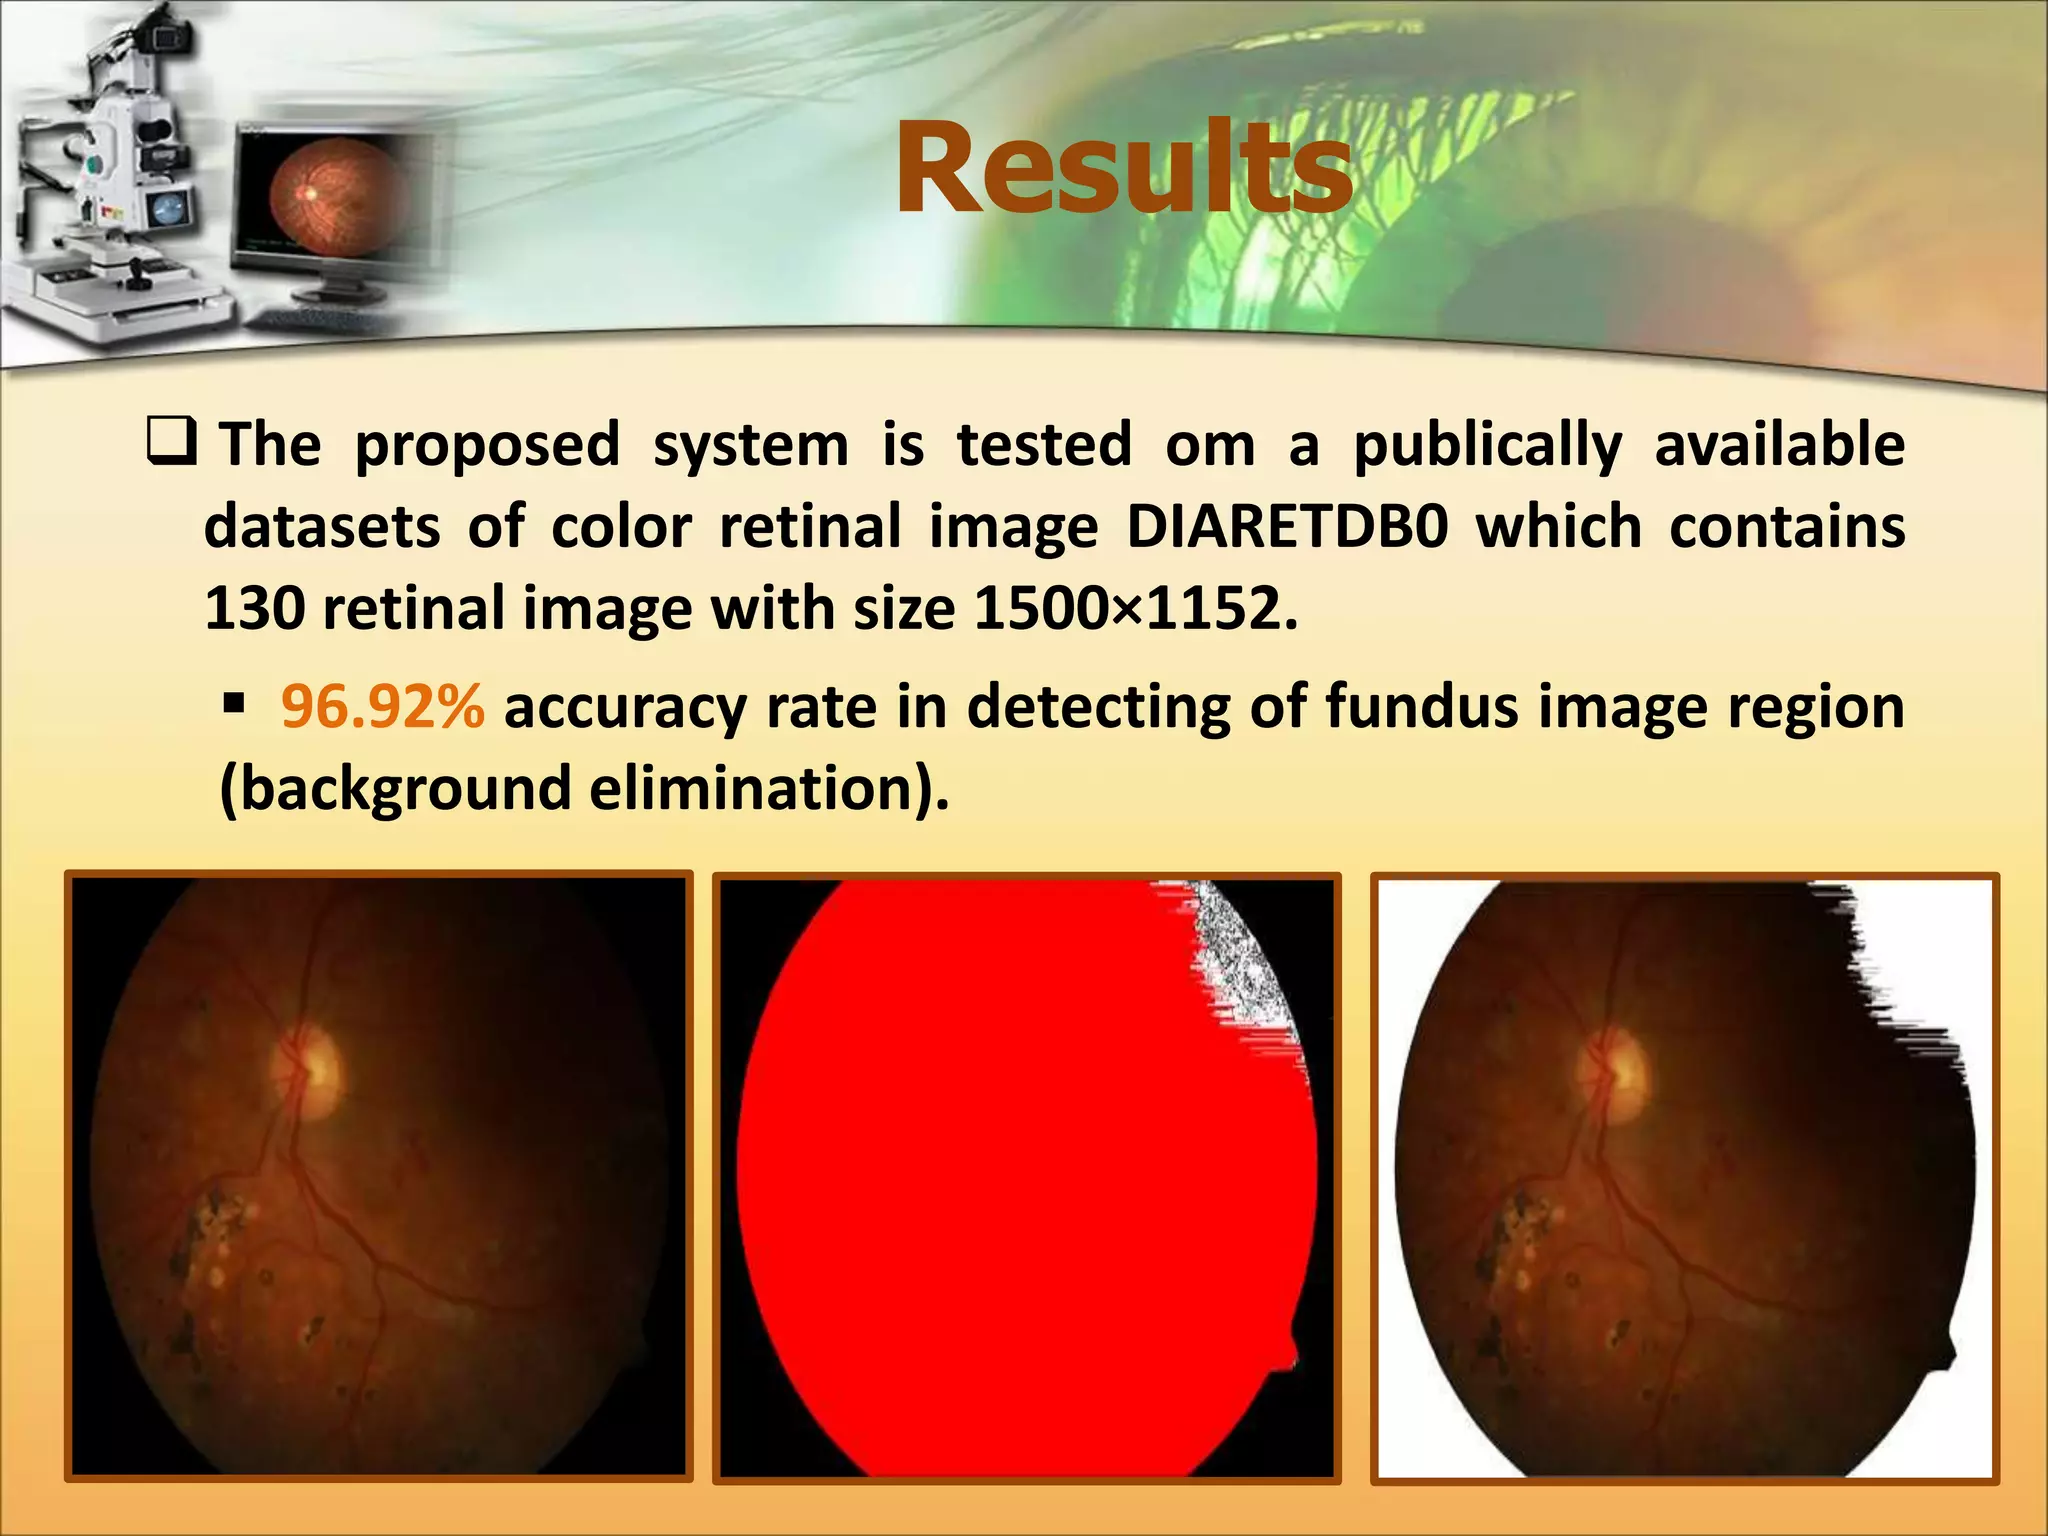
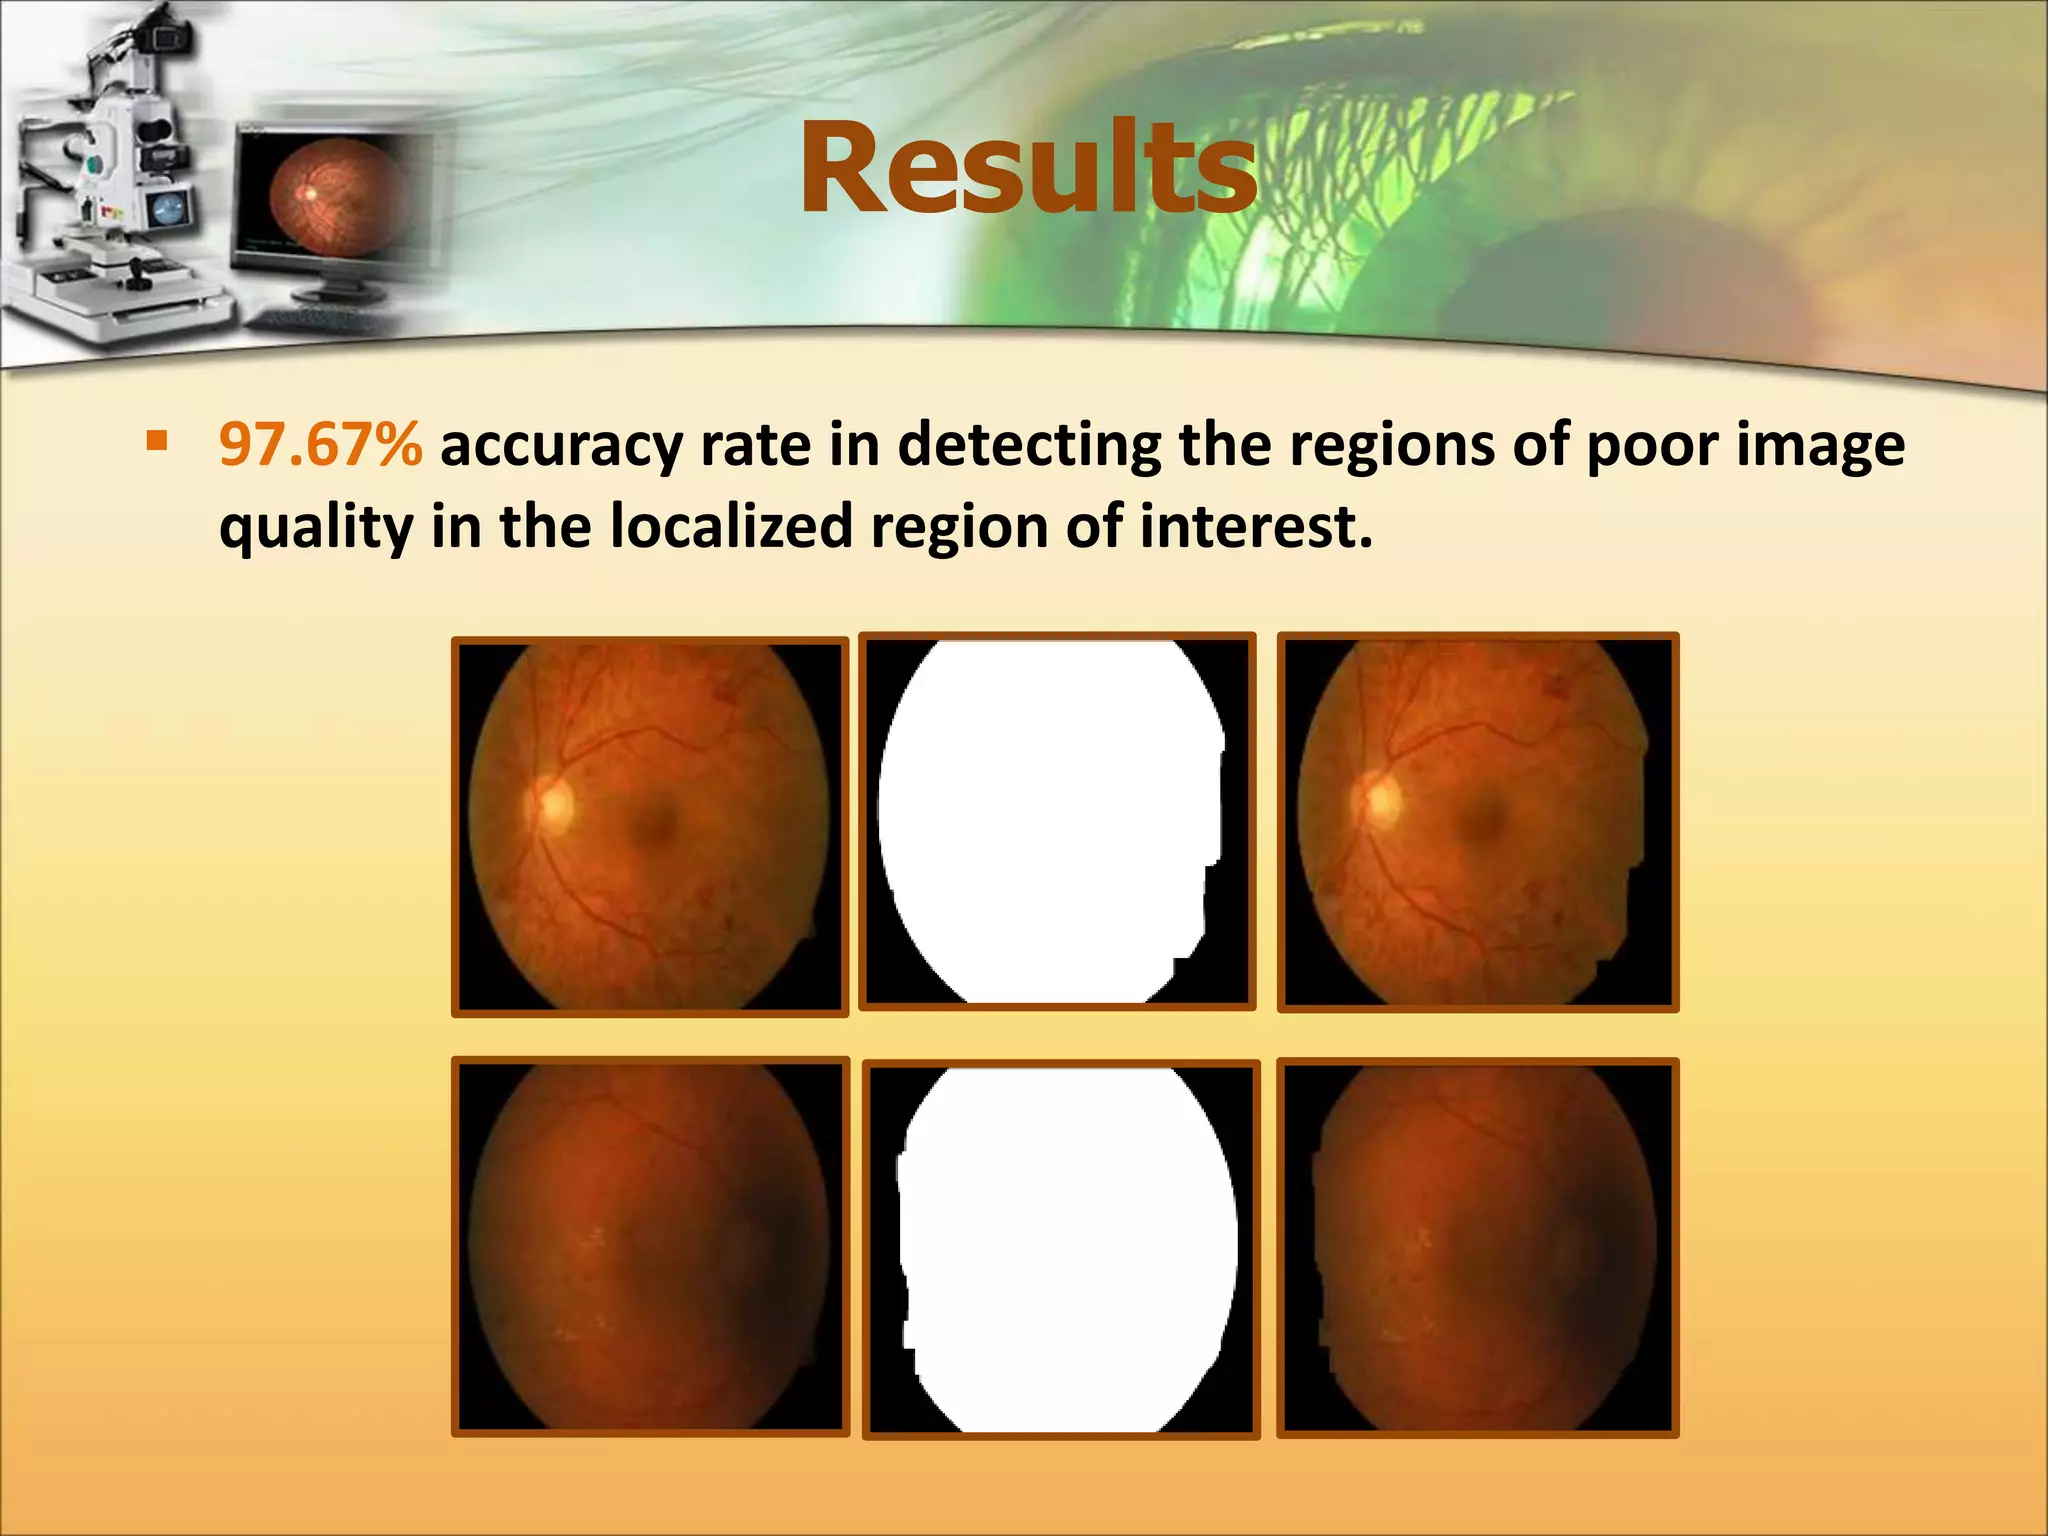
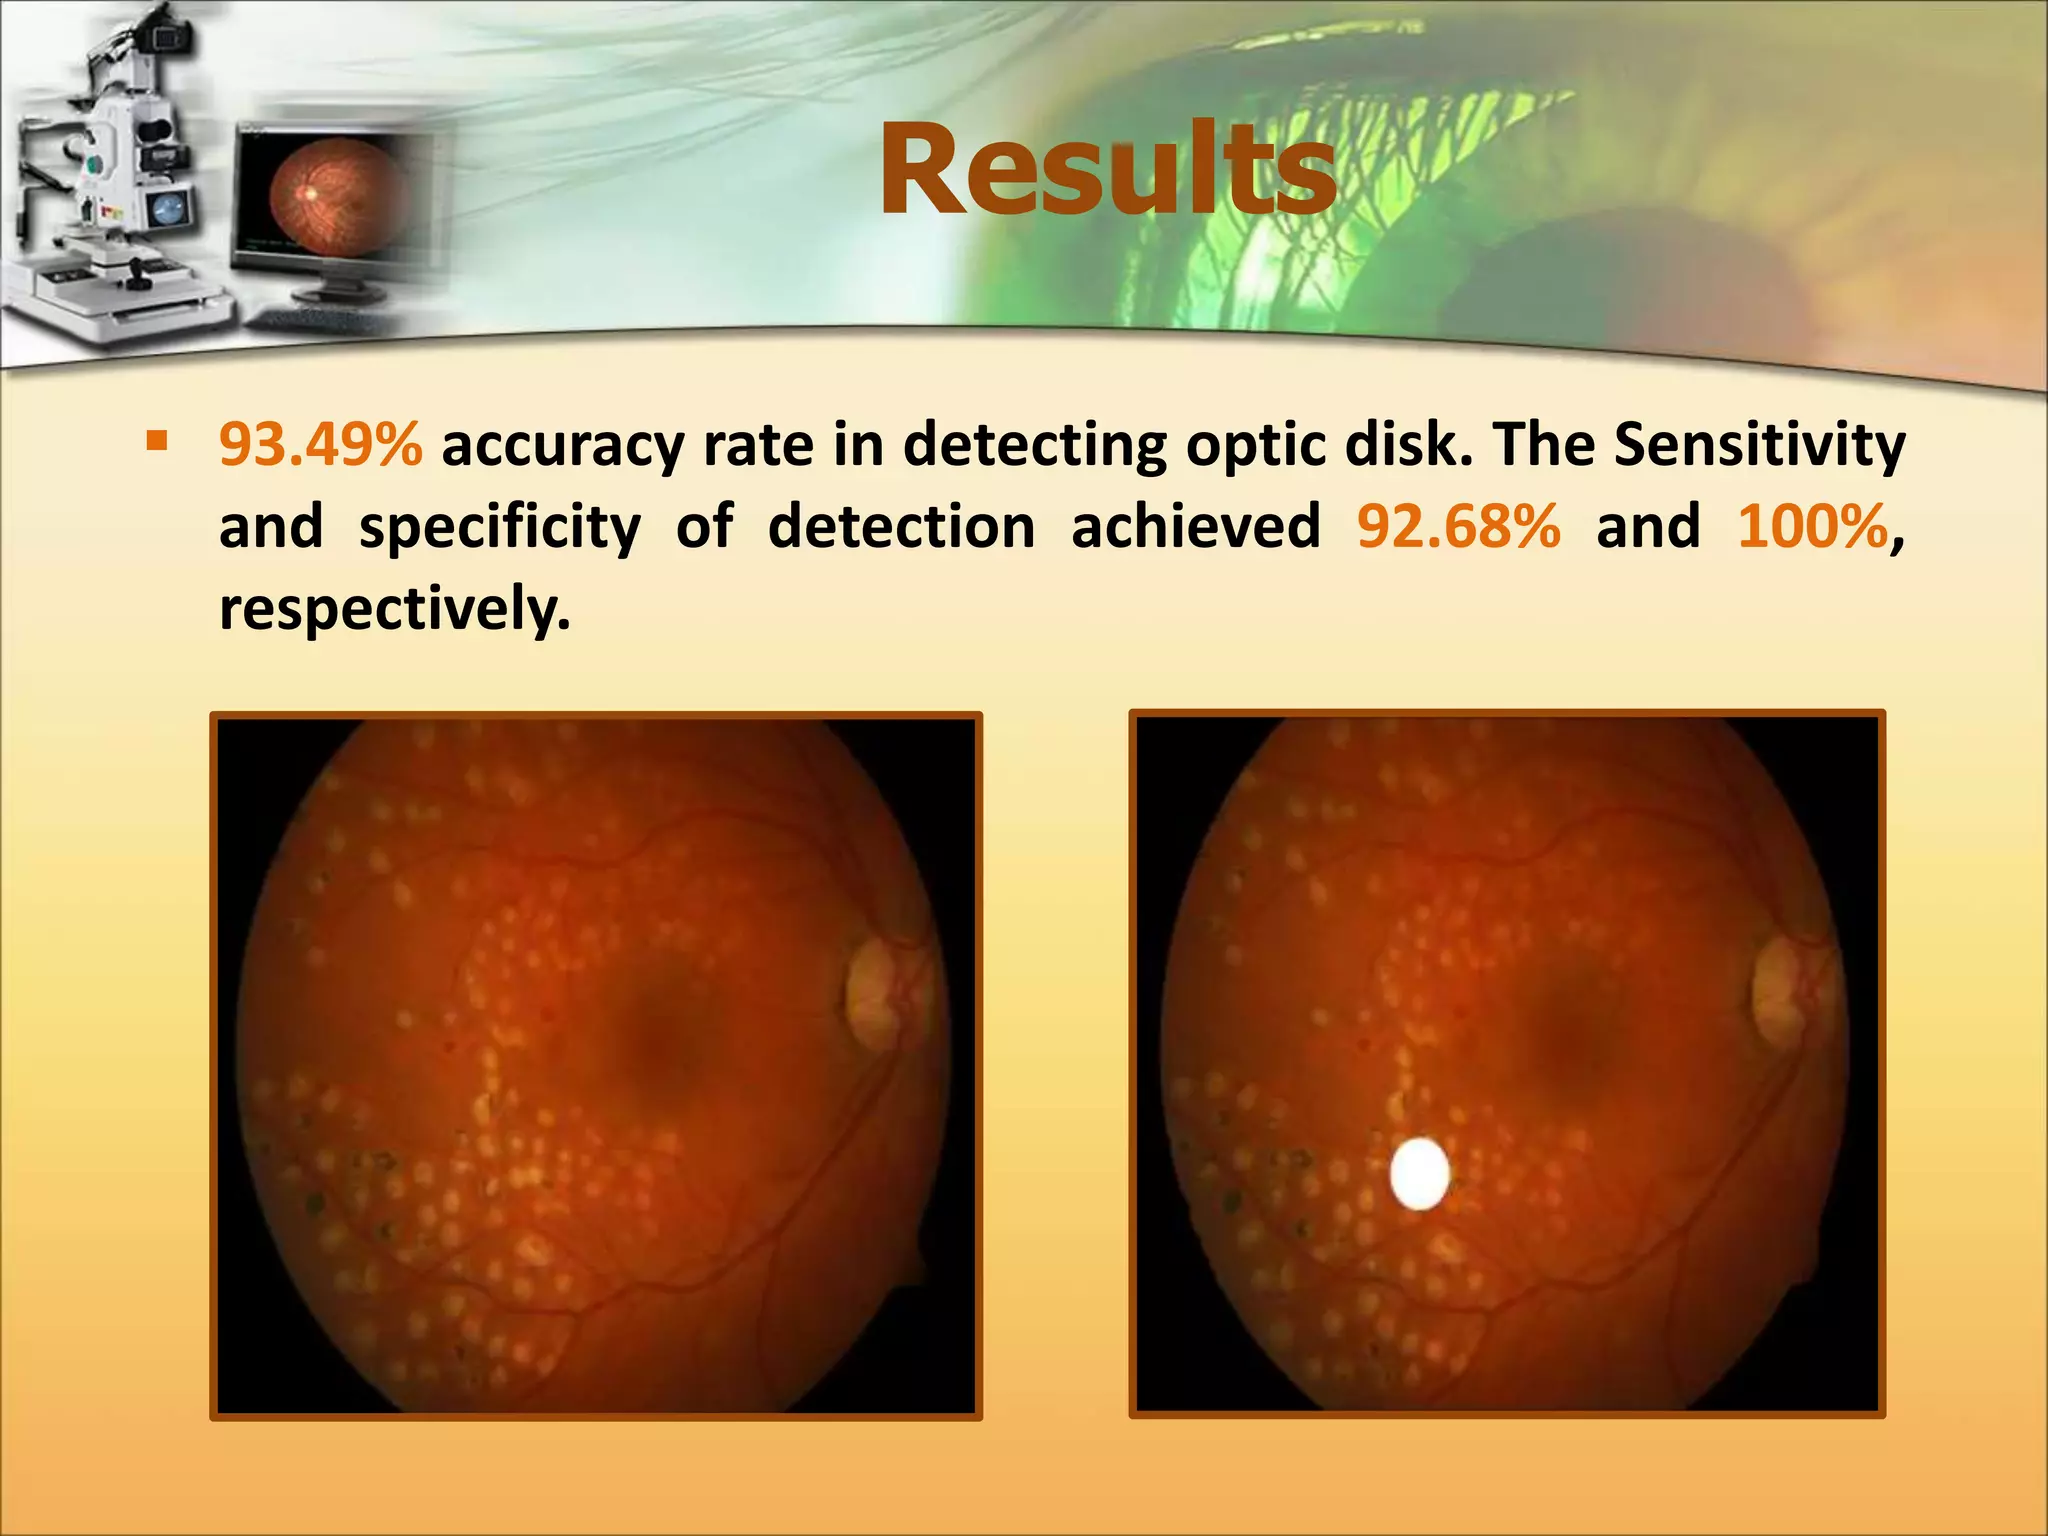
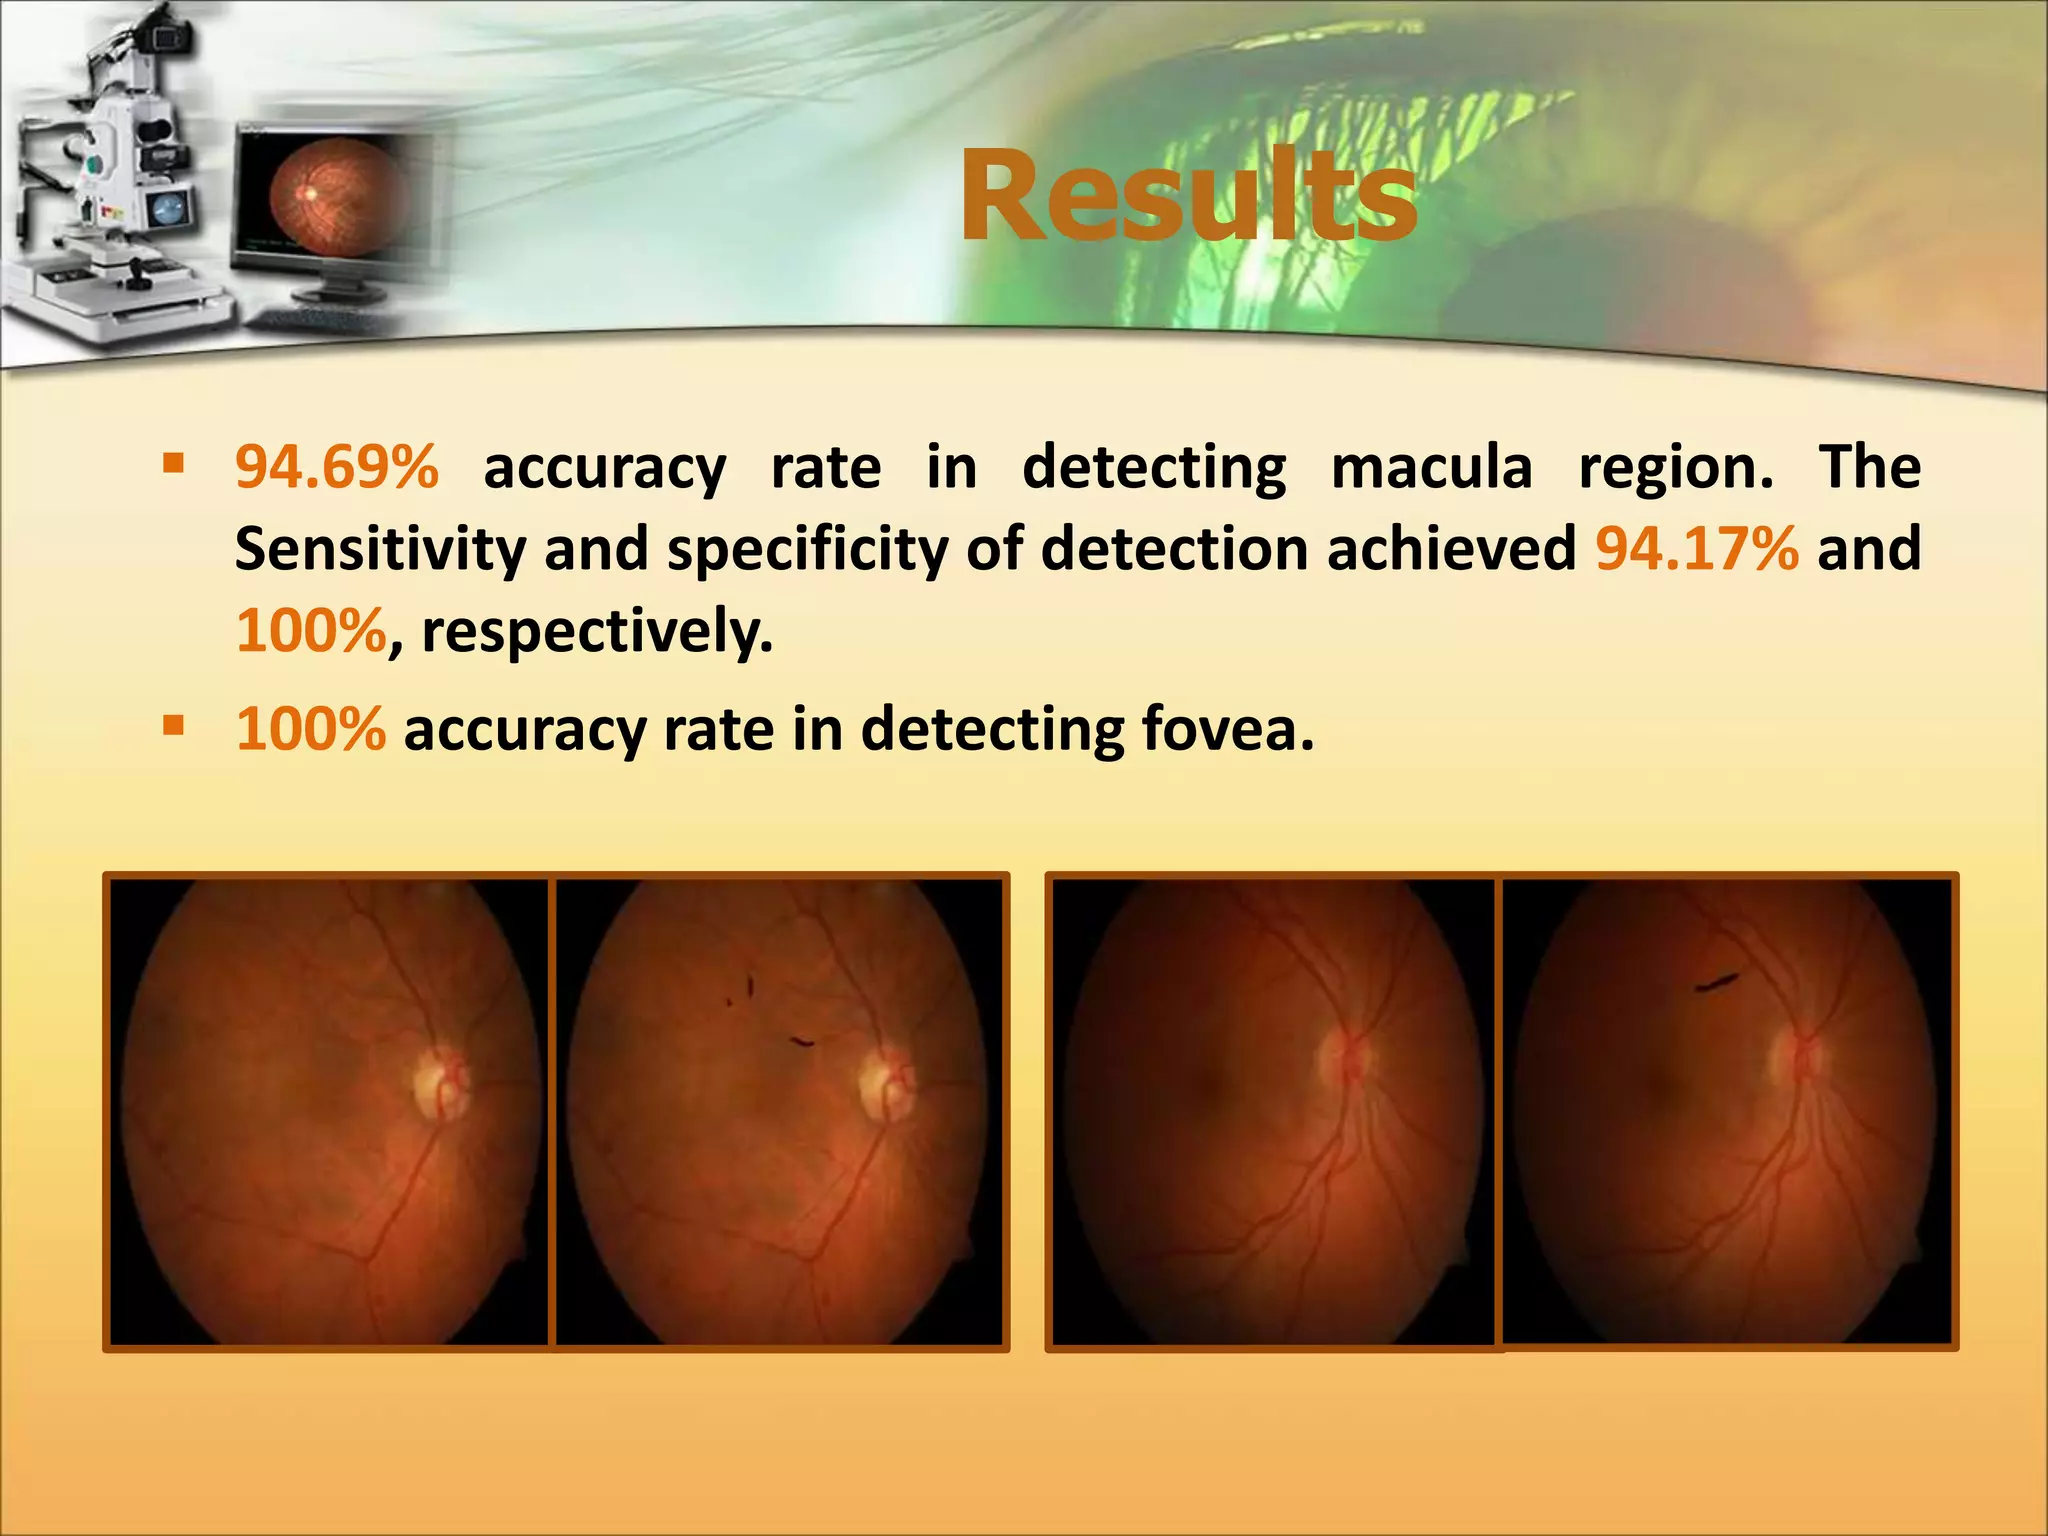
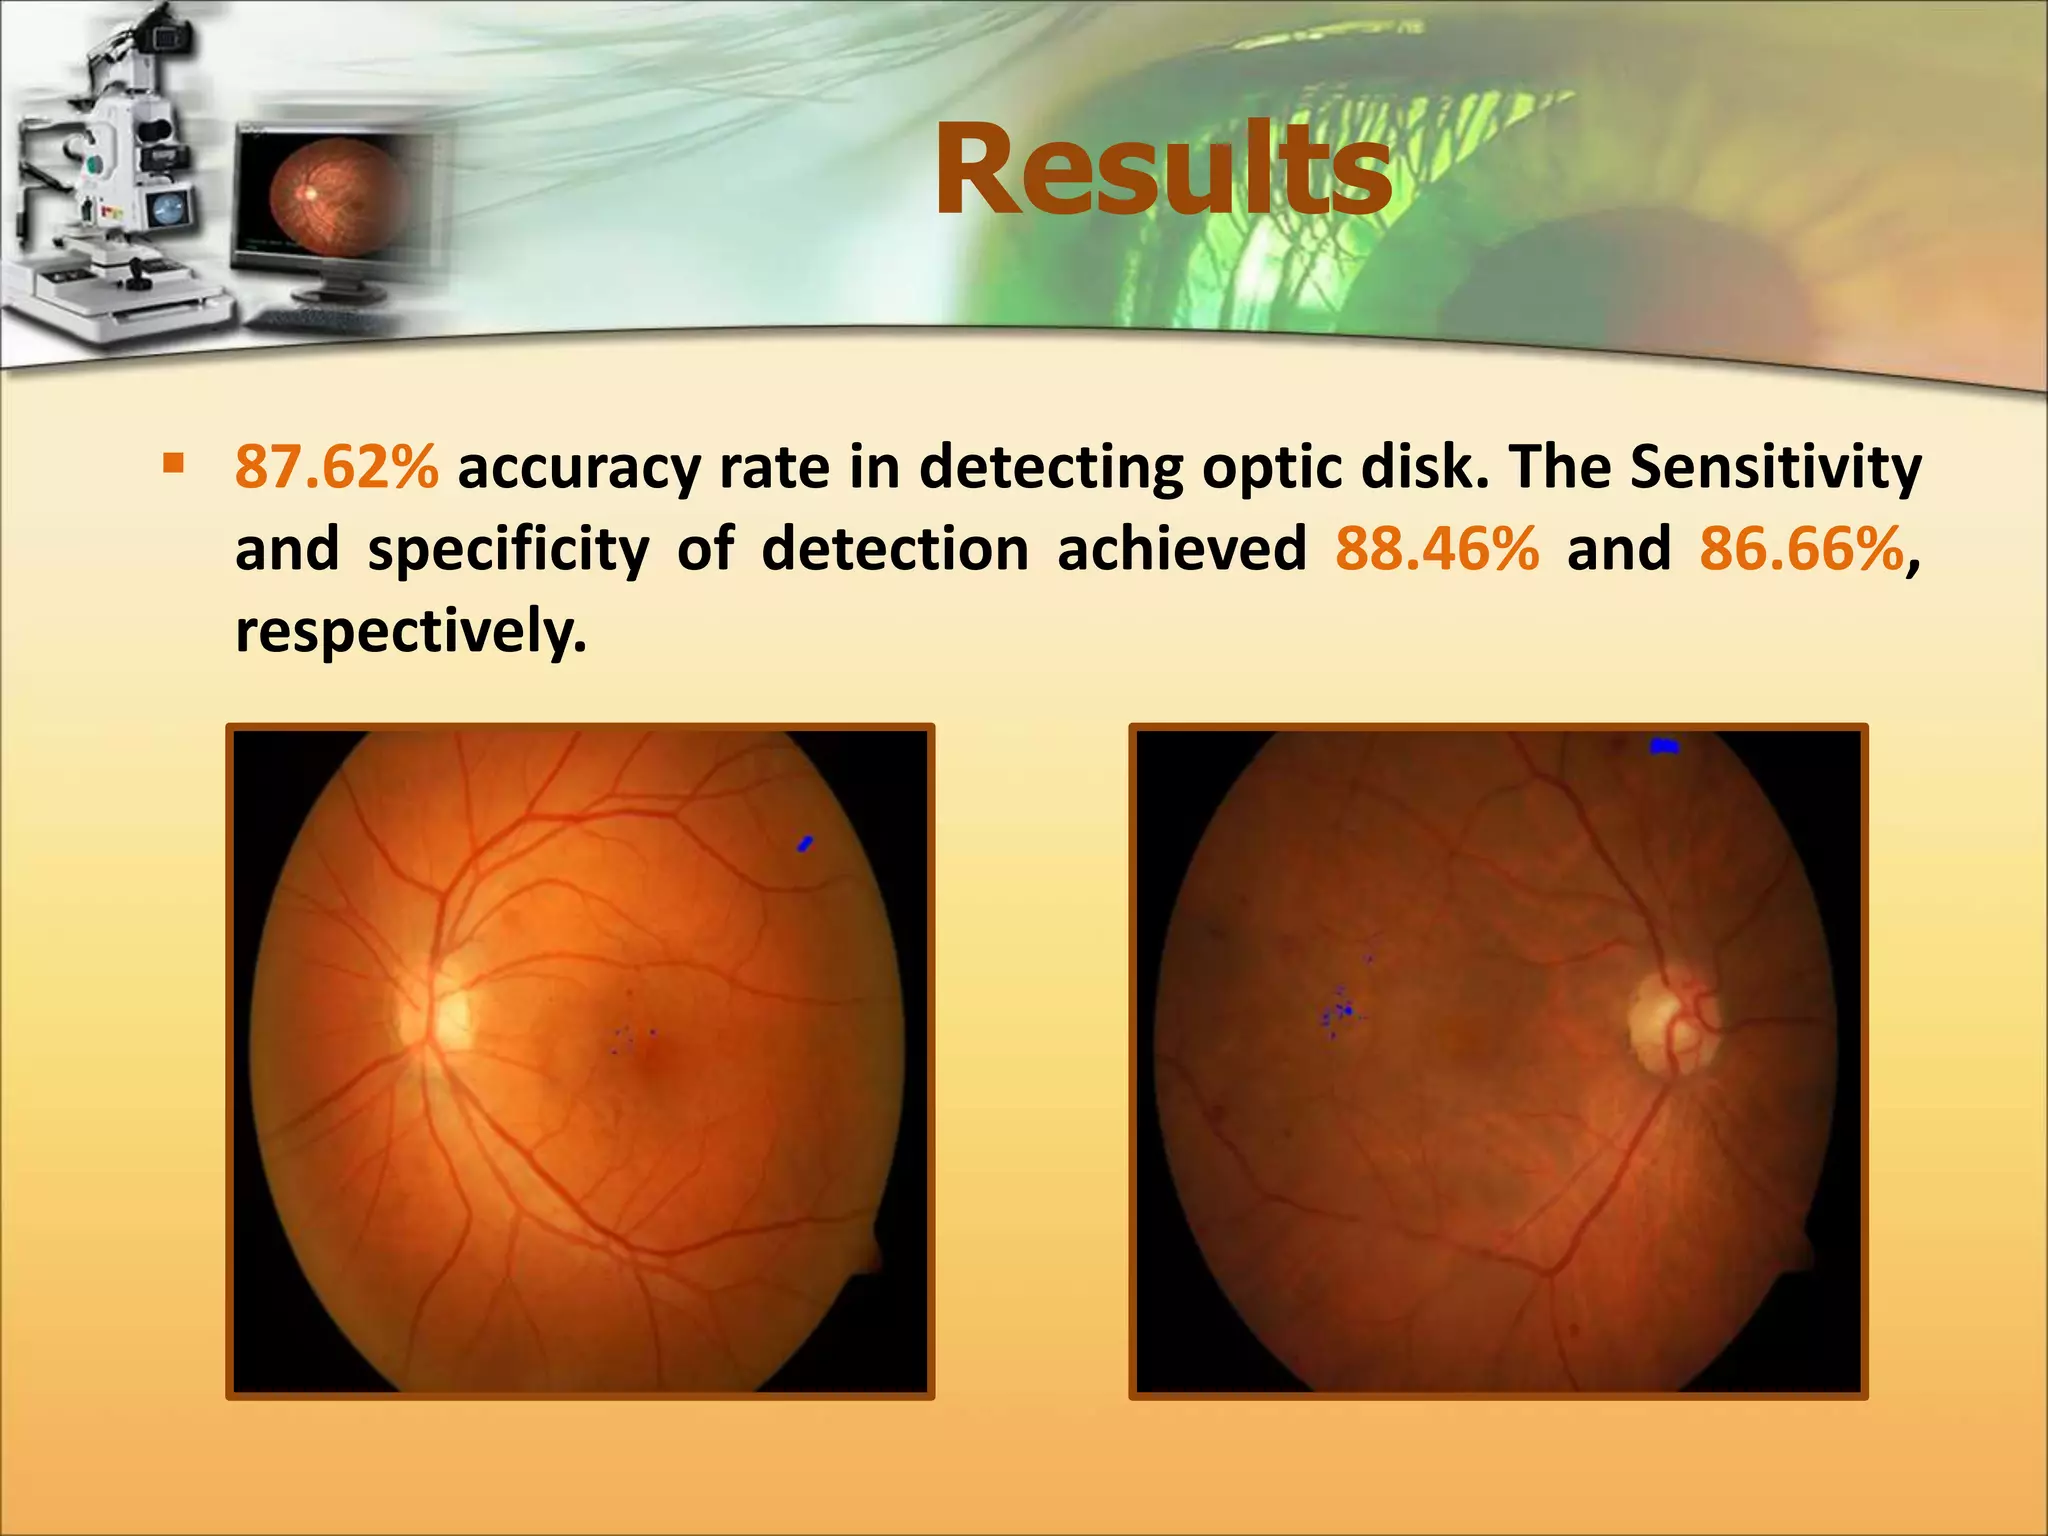
Automatic Detection of Diabetic 
Maculopathy from Fundus Images Using 
Image Analysis Techniques. 
Submitted By:- 
Eman Abdulalazeez Gani Aldhaher 
1436-2014
The Human Eye 
 Eye is an organ associated with vision. 
 The abnormalities associated with the eye can be divided in 
two main classes:- 
Eye diseases such as:- cataracts, glaucoma. 
 Life style related disease such as:- hypertension, diabetes.
Diabetes Mellitus 
 Diabetes is a chronic metabolic disorder caused by 
either the pancreas either produced too little or no 
insulin or the cells do not react properly to the 
insulin that is produced. 
 Diabetes can harm eye by damaging blood vessels of 
eye retina, which in turn can cause loss of vision. 
 According to World Health Organization (WHO), 
number of adults with diabetes in the world would 
increase alarmingly from 135 million in 1995 to 483 
million in 2030.
The Human Retina 
 The retina, also called fundus image, is a multi-layered sensory 
tissue that lies on the back of the eye. It capture light rays and 
convert them into electrical impulses that travel along the optic 
nerve to the brain where they are turned into image.
Physiology of Retina 
 Optic disk 
 Macula 
 Fovea 
 Vascular Network 
Optic Disk Macula 
Fovea 
Vascular Network
Abnormal Lesion of 
Diabetic Retinopathy 
 Exudates 
 Hard Exudates 
 Soft Exudates
Diabetic Maculopathy 
 Diabetic Maculopathy occurs if exudates appear near the 
macula affecting central vision stage. 
Normal eye Eye with Diabetic Maculopathy
Diabetic Maculopathy 
 The severity level of Diabetic Maculopathy is classified in to:- 
 Sever 
 Moderate 
 Mild 1/3DD 
1DD 
2DD
Color Bands Analysis 
 The input images has orange dominate color which indicates 
that the blue channel doesn't have significant information.
Fundus Region Detection 
 Improve the efficiency of the system by extracting background 
and removing the damaged areas from retinal image to 
allocate the actual region of interest (ROI). 
Background Area 
Background Area 
Damaged Areas 
Damaged Areas
Background Elimination 
 A color retinal image consist of a semi circular fundus and 
dark background surrounding it which is not clear homogenous 
black area. The background area is omitted using :- 
Thresholding, Dilation, Mask Generation.
Damaged Areas 
Segmentation 
 Damaged or non-informatics areas in color retinal image 
is usually due to pixels whose color is distorted; they exist 
in some parts of the fundus boundary regions where 
illumination was not inadequate. 
 Caused by a number of factors, including retinal 
pigmentation, acquisition angle, inadequate illumination, 
cameras' differences and patient movement. 
 Poor image quality region are detected using three steps:- 
 Max-Min Detector. 
 Ratio Detector 
 Seed Filling Algorithm
Max-Min Detector 
 Region of inadequate image quality will be detected and 
removed. 
His (gray level) 
Pr (gray level) 
Min:- Pr ≥ Val1*Siz 
Max:- Prmax ≥ Val2*Siz 
Min≤ Pixel value ≥Max 
Min≤ Pixel value ≥Max
Ratio Detector 
 Extract the blurred regions from the retinal image. 
퐑퐞퐝 + 퐆퐫퐧 < 퐓퐡퐫ퟏ 
퐑퐞퐝 + 퐆퐫퐧 ≤ 퐓퐡퐫ퟐ퐚퐧퐝 
퐆퐫퐧 
퐑퐞퐝 
≥ 퐓퐡퐫ퟑ퐚퐧퐝 
퐆퐫퐧/퐑퐞퐝 ≤ 퐓퐡퐫ퟒ
Seed Filling Algorithm 
 Remove the areas of white patches that may appear in the 
resulted binary image, which are considered as poor image 
quality areas.
Localization of ROI 
 Allocate the actual region in the retinal image and flag its 
pixels from other areas pixels in the ocular fundus image. 
퐆퐚퐩퐬 퐅퐢퐥퐥퐢퐧퐠 퐚퐧퐝 퐍퐨퐢퐬퐞 퐑퐞퐦퐨퐯퐚퐥 퐄퐝퐠퐞 퐒퐦퐨퐨퐭퐡퐢퐧퐠 
퐑퐞퐦퐨퐯퐢퐧퐠 퐨퐟 퐒퐦퐚퐥퐥 퐀퐫퐭퐢퐟퐢퐜퐢퐚퐥 
퐆퐚퐩퐬 퐚퐧퐝 퐏퐨퐫퐞퐬
Allocate the Most Informatic 
Color Band 
 Green Channel image shows better contrast than the red 
channel. It is observed that the anatomical and pathalogy 
features appears most contrasted in green channel in RGB 
image.
Allocate the Most Informatic 
Color Band 
50000 
45000 
40000 
35000 
30000 
25000 
20000 
15000 
10000 
5000 
0 
1 
16 
31 
46 
61 
76 
91 
106 
121 
136 
151 
166 
181 
196 
211 
226 
241 
256 
35000 
30000 
25000 
20000 
15000 
10000 
5000 
0 
1 
17 
33 
49 
65 
81 
97 
113 
129 
145 
161 
177 
193 
209 
225 
241 
Contrast Stretching 
Dif Between 
Adjacent Pixels 
Energy of Dif
Detection of Normal 
Features (Optic Disk) 
 OD is a bright yellowish disk within the retinal image. It is the 
spot on the retina where the optic nerve and blood vessels 
enter the eye. 
 Specify the image, where it is for the left or right side. 
 Cup the disk ratio is commonly used to assess the glaucoma 
disease. 
 Location of OD can be a target point for identify the 
position of the macula. 
OD is masked when detection of exudates to prevent the 
false positive.
Detection of Normal 
Features (Optic Disk) 
 Locating the Optic Disk. 
Thresholding Process Seed Filling Algorithm Circle Equation Mask Locating the OD
Detection of Normal 
Features (Optic Disk) 
 Accurate Localization of the Optic Disk. 
Non-linear 
Gamma Mapping 
Seed Filling 
Algorithm 
Determine center 
point 
Circle Equation 
Mask 
Localized the Optic 
Disk
Detection of Normal 
Features (Macula & Fovea) 
 Macula, is another part of the main components of the retina. 
In a color retinal image, it appears roughly in the center of the 
retina as darker small yellowish area adjacent to the optic disk 
about (4.5 mm in diameter). 
 Fovea is the central part of the region of the macula. 
 It is vital to allocate the macular region. 
 By localization the fovea, occurrence of the maculopathy can 
be determined in the whole macular region.
Detection of Normal 
Features (Macula & Fovea) 
 Locating the Macula.
Detection of Normal 
Features (Macula & Fovea) 
 Locating the Macula and its center (Fovea). 
Non-Linear 
Gamma Mapping 
Thresholding 
Process 
Seed Filling 
Algorithm 
Locating the 
Fovea
Detection of Abnormal 
Features (Exudates) 
 Exudates is a fluid rich in fat, leaks out of diseased 
vessels can deposited in the macular region leading to 
the visual distortion. 
 The common feature in hard 
and soft exudates lesions is 
that they both appear as 
brighter areas relative to 
their neighborhood.
Detection of Abnormal 
Features (Exudates) 
 Non-Linear Gamma Mapping. 
 Max Filter (Dawn-Sampling). 
 Local Thresholding. 
 Remove Optic Disk. 
 Up-Sampling 
 Seed Filling Algorithm 
 Classify the Exudates using brightness 
and size Feature 
3 5 
2 6 
6 
x,y x+1,y x+2,y 
x,y+1 x+1,y+1 x+2,y+1 
x,y+2 x+1,y+2 x+2,y+2 
2x,2y 2x+1,y 
2x,2y+1 2x+1,2y+1
Determining the Severity 
Level of Diabetic Maculopathy 
 To automatic grading of diabetic maculopathy severity 
level, the macular regions are divided into three circular 
areas R1, R2 and R3 centered at fovea. Where R1 is 
represent the sever region, while R2 for the moderate 
region and R3 for the mild region. 
Severity level Hard and Soft Exudates 
R1 R2 R3 
Sever Present Present/Absent Present/Absent 
Moderate Absent Present Present/Absent 
Mild Absent Absent Present
Determining the Severity 
Level of Diabetic Maculopathy 
Normal Mild Stage 
Moderate Stage Sever Stage
Results 
 The proposed system is tested om a publically available 
datasets of color retinal image DIARETDB0 which contains 
130 retinal image with size 1500×1152. 
 96.92% accuracy rate in detecting of fundus image region 
(background elimination).
Results 
 97.67% accuracy rate in detecting the regions of poor image 
quality in the localized region of interest.
Results 
 93.49% accuracy rate in detecting optic disk. The Sensitivity 
and specificity of detection achieved 92.68% and 100%, 
respectively.
Results 
 94.69% accuracy rate in detecting macula region. The 
Sensitivity and specificity of detection achieved 94.17% and 
100%, respectively. 
 100% accuracy rate in detecting fovea.
Results 
 87.62% accuracy rate in detecting optic disk. The Sensitivity 
and specificity of detection achieved 88.46% and 86.66%, 
respectively.
Thanks For Your 
Attention!

Automatic Detection of Diabetic Maculopathy from Funduas Images Using Image Analysis Techniques

  • 1.
    Automatic Detection ofDiabetic Maculopathy from Fundus Images Using Image Analysis Techniques. Submitted By:- Eman Abdulalazeez Gani Aldhaher 1436-2014
  • 2.
    The Human Eye  Eye is an organ associated with vision.  The abnormalities associated with the eye can be divided in two main classes:- Eye diseases such as:- cataracts, glaucoma.  Life style related disease such as:- hypertension, diabetes.
  • 3.
    Diabetes Mellitus Diabetes is a chronic metabolic disorder caused by either the pancreas either produced too little or no insulin or the cells do not react properly to the insulin that is produced.  Diabetes can harm eye by damaging blood vessels of eye retina, which in turn can cause loss of vision.  According to World Health Organization (WHO), number of adults with diabetes in the world would increase alarmingly from 135 million in 1995 to 483 million in 2030.
  • 4.
    The Human Retina  The retina, also called fundus image, is a multi-layered sensory tissue that lies on the back of the eye. It capture light rays and convert them into electrical impulses that travel along the optic nerve to the brain where they are turned into image.
  • 5.
    Physiology of Retina  Optic disk  Macula  Fovea  Vascular Network Optic Disk Macula Fovea Vascular Network
  • 6.
    Abnormal Lesion of Diabetic Retinopathy  Exudates  Hard Exudates  Soft Exudates
  • 7.
    Diabetic Maculopathy Diabetic Maculopathy occurs if exudates appear near the macula affecting central vision stage. Normal eye Eye with Diabetic Maculopathy
  • 8.
    Diabetic Maculopathy The severity level of Diabetic Maculopathy is classified in to:-  Sever  Moderate  Mild 1/3DD 1DD 2DD
  • 9.
    Color Bands Analysis  The input images has orange dominate color which indicates that the blue channel doesn't have significant information.
  • 10.
    Fundus Region Detection  Improve the efficiency of the system by extracting background and removing the damaged areas from retinal image to allocate the actual region of interest (ROI). Background Area Background Area Damaged Areas Damaged Areas
  • 11.
    Background Elimination A color retinal image consist of a semi circular fundus and dark background surrounding it which is not clear homogenous black area. The background area is omitted using :- Thresholding, Dilation, Mask Generation.
  • 12.
    Damaged Areas Segmentation  Damaged or non-informatics areas in color retinal image is usually due to pixels whose color is distorted; they exist in some parts of the fundus boundary regions where illumination was not inadequate.  Caused by a number of factors, including retinal pigmentation, acquisition angle, inadequate illumination, cameras' differences and patient movement.  Poor image quality region are detected using three steps:-  Max-Min Detector.  Ratio Detector  Seed Filling Algorithm
  • 13.
    Max-Min Detector Region of inadequate image quality will be detected and removed. His (gray level) Pr (gray level) Min:- Pr ≥ Val1*Siz Max:- Prmax ≥ Val2*Siz Min≤ Pixel value ≥Max Min≤ Pixel value ≥Max
  • 14.
    Ratio Detector Extract the blurred regions from the retinal image. 퐑퐞퐝 + 퐆퐫퐧 < 퐓퐡퐫ퟏ 퐑퐞퐝 + 퐆퐫퐧 ≤ 퐓퐡퐫ퟐ퐚퐧퐝 퐆퐫퐧 퐑퐞퐝 ≥ 퐓퐡퐫ퟑ퐚퐧퐝 퐆퐫퐧/퐑퐞퐝 ≤ 퐓퐡퐫ퟒ
  • 15.
    Seed Filling Algorithm  Remove the areas of white patches that may appear in the resulted binary image, which are considered as poor image quality areas.
  • 16.
    Localization of ROI  Allocate the actual region in the retinal image and flag its pixels from other areas pixels in the ocular fundus image. 퐆퐚퐩퐬 퐅퐢퐥퐥퐢퐧퐠 퐚퐧퐝 퐍퐨퐢퐬퐞 퐑퐞퐦퐨퐯퐚퐥 퐄퐝퐠퐞 퐒퐦퐨퐨퐭퐡퐢퐧퐠 퐑퐞퐦퐨퐯퐢퐧퐠 퐨퐟 퐒퐦퐚퐥퐥 퐀퐫퐭퐢퐟퐢퐜퐢퐚퐥 퐆퐚퐩퐬 퐚퐧퐝 퐏퐨퐫퐞퐬
  • 17.
    Allocate the MostInformatic Color Band  Green Channel image shows better contrast than the red channel. It is observed that the anatomical and pathalogy features appears most contrasted in green channel in RGB image.
  • 18.
    Allocate the MostInformatic Color Band 50000 45000 40000 35000 30000 25000 20000 15000 10000 5000 0 1 16 31 46 61 76 91 106 121 136 151 166 181 196 211 226 241 256 35000 30000 25000 20000 15000 10000 5000 0 1 17 33 49 65 81 97 113 129 145 161 177 193 209 225 241 Contrast Stretching Dif Between Adjacent Pixels Energy of Dif
  • 19.
    Detection of Normal Features (Optic Disk)  OD is a bright yellowish disk within the retinal image. It is the spot on the retina where the optic nerve and blood vessels enter the eye.  Specify the image, where it is for the left or right side.  Cup the disk ratio is commonly used to assess the glaucoma disease.  Location of OD can be a target point for identify the position of the macula. OD is masked when detection of exudates to prevent the false positive.
  • 20.
    Detection of Normal Features (Optic Disk)  Locating the Optic Disk. Thresholding Process Seed Filling Algorithm Circle Equation Mask Locating the OD
  • 21.
    Detection of Normal Features (Optic Disk)  Accurate Localization of the Optic Disk. Non-linear Gamma Mapping Seed Filling Algorithm Determine center point Circle Equation Mask Localized the Optic Disk
  • 22.
    Detection of Normal Features (Macula & Fovea)  Macula, is another part of the main components of the retina. In a color retinal image, it appears roughly in the center of the retina as darker small yellowish area adjacent to the optic disk about (4.5 mm in diameter).  Fovea is the central part of the region of the macula.  It is vital to allocate the macular region.  By localization the fovea, occurrence of the maculopathy can be determined in the whole macular region.
  • 23.
    Detection of Normal Features (Macula & Fovea)  Locating the Macula.
  • 24.
    Detection of Normal Features (Macula & Fovea)  Locating the Macula and its center (Fovea). Non-Linear Gamma Mapping Thresholding Process Seed Filling Algorithm Locating the Fovea
  • 25.
    Detection of Abnormal Features (Exudates)  Exudates is a fluid rich in fat, leaks out of diseased vessels can deposited in the macular region leading to the visual distortion.  The common feature in hard and soft exudates lesions is that they both appear as brighter areas relative to their neighborhood.
  • 26.
    Detection of Abnormal Features (Exudates)  Non-Linear Gamma Mapping.  Max Filter (Dawn-Sampling).  Local Thresholding.  Remove Optic Disk.  Up-Sampling  Seed Filling Algorithm  Classify the Exudates using brightness and size Feature 3 5 2 6 6 x,y x+1,y x+2,y x,y+1 x+1,y+1 x+2,y+1 x,y+2 x+1,y+2 x+2,y+2 2x,2y 2x+1,y 2x,2y+1 2x+1,2y+1
  • 27.
    Determining the Severity Level of Diabetic Maculopathy  To automatic grading of diabetic maculopathy severity level, the macular regions are divided into three circular areas R1, R2 and R3 centered at fovea. Where R1 is represent the sever region, while R2 for the moderate region and R3 for the mild region. Severity level Hard and Soft Exudates R1 R2 R3 Sever Present Present/Absent Present/Absent Moderate Absent Present Present/Absent Mild Absent Absent Present
  • 28.
    Determining the Severity Level of Diabetic Maculopathy Normal Mild Stage Moderate Stage Sever Stage
  • 29.
    Results  Theproposed system is tested om a publically available datasets of color retinal image DIARETDB0 which contains 130 retinal image with size 1500×1152.  96.92% accuracy rate in detecting of fundus image region (background elimination).
  • 30.
    Results  97.67%accuracy rate in detecting the regions of poor image quality in the localized region of interest.
  • 31.
    Results  93.49%accuracy rate in detecting optic disk. The Sensitivity and specificity of detection achieved 92.68% and 100%, respectively.
  • 32.
    Results  94.69%accuracy rate in detecting macula region. The Sensitivity and specificity of detection achieved 94.17% and 100%, respectively.  100% accuracy rate in detecting fovea.
  • 33.
    Results  87.62%accuracy rate in detecting optic disk. The Sensitivity and specificity of detection achieved 88.46% and 86.66%, respectively.
  • 34.
    Thanks For Your Attention!