Downloaded 50 times

![AIRMAIL
Landing Weight at ‘Special’ Airport
I
note the article by Mark Lacagnina,
“Double Whammy” [ASW, 9/12,
p. 34] and the follow-up [“Speed
Brake Warnings,” ASW, 10/12, p. 12].
One aspect is briefly mentioned
but receives no attention from anyone thereafter. It is noted that Jackson
Hole is a “special airport,” and that “the
runway is usually slippery during the ski
AeroSafety World encourages
comments from readers, and will
assume that letters and e-mails
are meant for publication unless
otherwise stated. Correspondence
is subject to editing for length
and clarity.
Write to Frank Jackman, director
of publications, Flight Safety
Foundation, 801 N. Fairfax St.,
Suite 400, Alexandria, VA
22314-1774 USA, or e-mail
jackman@flightsafety.org.
8|
season and that high landing weights are
common when operating at the airport.” I am sure that great care is taken;
however, would it not reduce the risk
factor if it were arranged to arrive at this
airport well below the maximum landing weight? We all know how quickly
the landing margins can be eroded. I am
assuming that the high landing weight
is due to fuel and I have no doubt that
there seem to be good reasons for operating in this way, but if that is the case, I
do think that more attention should be
given to this aspect.
Richard T. Slatter
Engine (Identification) Failure?
I
enjoy your magazine and appreciate
the opportunity to read it at my place
of employment. However, a recent
article [“Double Whammy”] caught
my attention.
Specifically, a causal factor is erroneously identified as a “sync-lock”
mechanism on 757s/767s equipped
with Pratt Whitney engines. In fact,
the airplane in question (and all American Airlines 757s) have the Rolls-Royce
[RB211-]535 series engine.
The end note no. 54 in the
NTSB report, page 21, states that PWequipped airplanes are the only Boeing
planes that have this potential, but
that note appears also to be erroneous.
The photograph in the accompanying
article clearly shows RR engines.
Darren Dresser
Mark Lacagnina replies: The only
mention of PW engines in the Causal
Factors article is in the statement: “The
thrust-reverser system on 757s and 767s
equipped with Pratt Whitney engines
has a ‘sync-lock’ mechanism that is
intended to prevent the translating sleeves
from extending accidentally due to a fault
in the system.”
That statement is included in
the capsulization of NTSB’s findings
about why the incident crew and other
American Airlines pilots likely believed
thrust reverser lock was not possible and
thus were not prepared to handle it. The
sync-lock mechanism was not identified
by NTSB or by the article as a “causal
factor” of the incident.
FLIGHT SAFETY FOUNDATION | AEROSAFETYWORLD | FEBRUARY 2013](https://image.slidesharecdn.com/aswfeb13low-131027074409-phpapp01/85/Asw-feb13-low-10-320.jpg)
![Safety News
INBRIEF
Proactive Safety
Proposed Penalties
he European Commission (EC) says it
is proposing “ambitious and comprehensive” steps to develop a proactive,
e
vidence-based aviation safety system, with an
emphasis on comprehensive data-gathering.
“The current aviation regulatory system
is primarily a reactive system relying on technological progress, the adoption of legislation
overseen by effective regulatory authorities
and detailed accident investigations leading to
recommendations for safety improvements,”
the EC said in a December memo.
“However, whilst the ability to learn
lessons from an accident is crucial, systems
which are essentially reactive are showing
their limits in being able to drive further
improvements in the accident rate.”
The answer, the EC said, is to gather
and analyze all available aviation safety
information.
The EC proposals include establishing “an
appropriate environment to encourage aviation
professionals to report safety-related information by protecting them from punishment except in cases of gross negligence” and ensuring
that “the scope of mandatory reporting covers
major potential risks and that the appropriate
means to capture any safety threat are established [through] voluntary reporting schemes.”
In addition, the proposals call for confidential safety information to be made available
only to maintain or improve aviation safety.
The EC added that its intent is to “diminish the
negative effect that the use of such data by judicial authorities may have on aviation safety.”
Other proposals call for improving the
“quality and completeness” of occurrence
reports, developing a better exchange of information among EC member states and improving data analysis at the European Union
(EU) level so that it complements analysis
performed at the national level.
The EC proposal must be approved by
the European Parliament and the Council of
member states before it takes effect.
EU transport ministers also called for an
external aviation policy that will strengthen the
competitiveness of the European aviation industry, in part by developing EU-level air transport
agreements with neighboring countries.
he U.S. Federal Aviation Administration (FAA) has proposed $633,000
in civil penalties against Trans States Airlines for its operation of two
Embraer 145 regional jets on 3,660 passenger flights while the aircraft allegedly were out of compliance with Federal Aviation Regulations.
The FAA said that the airline operated two airplanes on 268 revenue passenger flights while the airplanes were equipped with improperly installed
radio altimeter antenna cables. One aircraft was operated on 3,392 passenger
flights with improperly installed electrical wiring in its fuel supply system,
the FAA said.
In an unrelated case, the FAA proposed a $275,000 civil penalty against
Pinnacle Airlines for allegedly operating a Bombardier CRJ on 11 flights after
maintenance personnel failed to install a required part when they replaced an
engine. The FAA said that, because Pinnacle is being reorganized under U.S.
bankruptcy laws, the notice of proposed penalty is not a demand for payment.
T
FLIGHTSAFETY.ORG | AEROSAFETYWORLD | FEBRUARY 2013
T
© Boeing
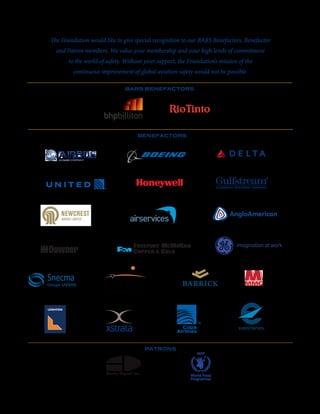
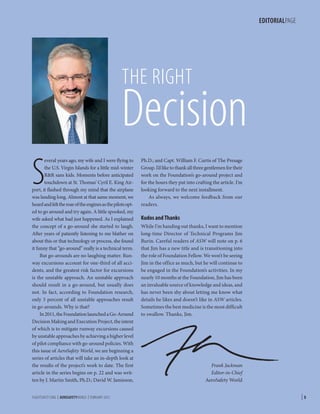
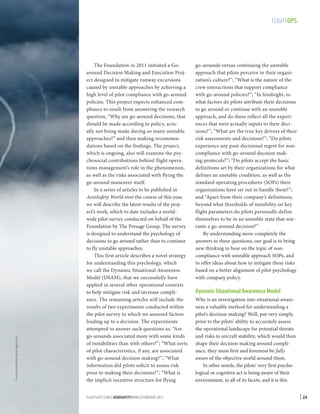
787 Grounding
T
he U.S. Federal Aviation Administration (FAA) on Jan. 16 grounded all
U.S.-registered Boeing 787s, citing an in-flight “battery incident” earlier
in the day on an All Nippon Airways (ANA) 787. The FAA said it would
issue an emergency airworthiness directive to address the risk of battery fires
in the airplanes.
Other civil aviation authorities worldwide immediately took similar
action to keep 787s out of the skies. ANA and Japan Airlines had grounded
their 787s prior to the FAA action.
“The FAA will work with the manufacturer and carriers to develop a corrective action plan to allow the U.S. 787 fleet to resume operations as quickly
and safely as possible,” the agency said. “Before further flight, operators of
U.S.-registered Boeing 787 aircraft must demonstrate to the [FAA] that the
batteries are safe.”
Boeing Chairman, President and CEO Jim McNerney said the company is
“committed to supporting the FAA and finding answers as quickly as possible.
…We are confident the 787 is safe, and we stand behind its overall integrity.”
Published reports said the in-flight incident involved warning lights
indicating a battery problem in a 787 on a domestic flight in Japan and quoted
Yoshitomo Tamaki, director general of the Japan Transport Safety Board, as
saying there was a bulge in the metal case that housed the battery.
The grounding came five days after the FAA announced a review of the
787’s critical systems, especially its electrical systems; that action came in the
wake of a battery fire in a Japan Airlines 787 parked at Logan International
Airport in Boston.
Fifty 787s had been in service worldwide.
|9](https://image.slidesharecdn.com/aswfeb13low-131027074409-phpapp01/85/Asw-feb13-low-11-320.jpg)
![INBRIEF
SMS Start-Up
T
he U.S. Federal Aviation Administration (FAA) should
consider asking Congress to provide additional protections
for data gathered through safety management systems
(SMS), a U.S. government watchdog agency says.
The Government Accountability Office (GAO) said in a
December report on the FAA’s progress in SMS implementation
— both within the agency and throughout the aviation industry — that data protection concerns “could prevent aviation
stakeholders from fully embracing SMS implementation, thus
hindering its effectiveness.
“Without assurance of protection from state [freedom of
information] laws, some aviation stakeholders may choose to
collect only the bare minimum of safety-related data or may
choose to limit the extent to which collected information is
shared among aviation stakeholders.”
In addition, GAO said, “the ability of FAA to identify safety
risks, develop mitigation strategies and measure outcomes is
hindered by limited access to complete and meaningful data.”
GAO said that the FAA and the aviation industry are
making progress in SMS implementation, although it will take
years to accomplish the “cultural and procedural shift” in FAA
internal operations and in the agency’s oversight of airlines,
airports and other aviation stakeholders.
“Going forward, if FAA is to attain the full benefits of
SMS, it will be important for the agency to remain committed to fully implementing SMS across its business lines,” GAO
said. “FAA has taken a number of steps that align with practices we identified as important to successful project planning and implementation but has not addressed or has only
partially addressed other key practices … [that] are important
for large-scale transformative projects such as SMS.”
GAO’s other recommendations included calls for development of a data-collection system to be used in evaluating
whether SMS is meeting designated goals and implementation of a system of evaluating employee performance as
related to SMS.
GAO also recommended developing a system to track
SMS implementation and conducting a workforce analysis to
identify employee skills and strategies for addressing SMSrelated skills gaps.
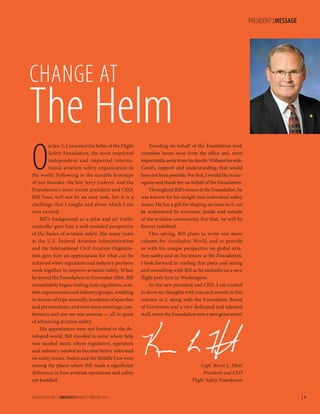
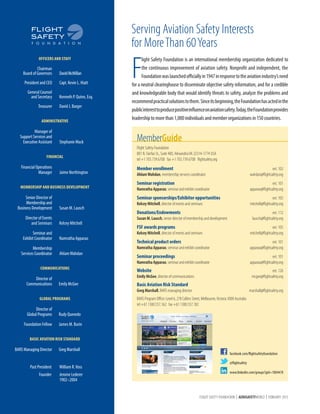
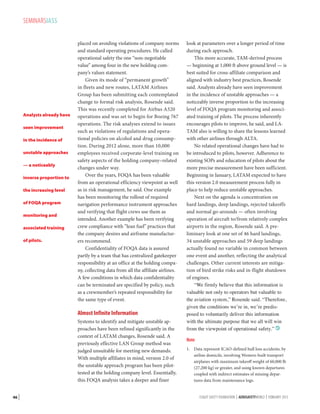
Flight Simulation Goals
Workplace Safety
he Australian Civil Aviation Safety Authority (CASA), urging
the increased use of flight simulators throughout the aviation
industry, has established six related goals for flight simulation
over the next two years.
The goals include adopting the International Civil Aviation
Organization framework for simulator classification, mandating that
simulators be used for training and checking of high-risk emergency
procedures in some aircraft types, and encouraging operators to
upgrade and maintain their simulators.
“Technological advances have seen significant improvement in
the fidelity of flight simulation devices at all levels,” CASA said in
its Flight Simulation Operational Plan 2012–2014. “Flight simulators provide more in-depth training, particularly in the practice of
emergency and abnormal operations, than
can be accomplished
in aircraft.”
CASA said that
Australia currently has
34 full-flight simulators; five flight training
devices, which do
not have motion; and
91 instrument flight
trainers.
orkplace safety standards for flight attendants should be enforced by the U.S.
Occupational Safety and Health Administration (OSHA), the Federal Aviation Administration (FAA) said in proposing a regulation to expand
OSHA’s authority.
“While the FAA’s aviation safety regulations take
precedence, the agency is proposing that OSHA
be able to enforce certain occupational safety and
health standards currently not covered by FAA
oversight,” the FAA said.
Under the proposal, flight attendants could
report workplace injury and illness complaints to
OSHA, which would have the authority to investigate.
Workplace issues could include exposure to noise and
disease-causing microorganisms, the FAA said.
“The policy … [would] not only enhance the
health and safety of flight attendants by connecting them directly with OSHA but will by extension
improve the flying experience of millions of airline
passengers,” said U.S. Labor Secretary Hilda L. Solis.
A final policy will be announced after authorities have reviewed public comments on the
proposed regulation. The comment period was
scheduled to end Jan. 22.
T
W
© CAE
10 |
FLIGHT SAFETY FOUNDATION | AEROSAFETYWORLD | FEBRUARY 2013](https://image.slidesharecdn.com/aswfeb13low-131027074409-phpapp01/85/Asw-feb13-low-12-320.jpg)
![INBRIEF
Information Sharing
F
© Konstantin Tyurpeko/RUSpottersTeam
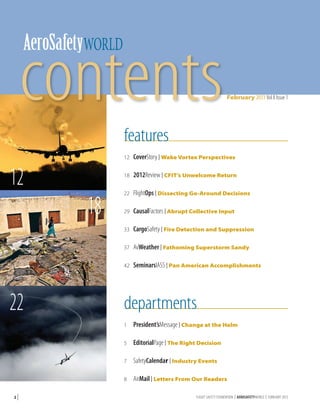
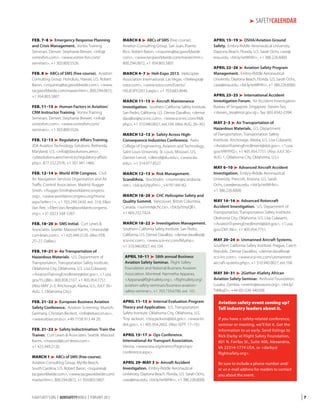
Engine Warning
O
perators of aircraft with Rolls-Royce RB211-524 engines
have been warned of a potential for degradation of the
engines’ intermediate-pressure turbine blade interlocking
shrouds, which, if not corrected, could result in the cracking
and loss of turbine blades, the Australian Transport Safety
Bureau (ATSB) says.
The ATSB cited the May 9, 2011, malfunction of an engine
on a Qantas Airways Boeing 747-400 during a flight from
Sydney, New South Wales, Australia, to Singapore. The crew
observed abnormal indications from the no. 4 engine during
a climb from 36,000 ft to 38,000 ft. The crew shut down the
engine, continued the flight to Singapore and landed without
further incident.
The ATSB investigation traced the problem to the “failure
and separation of a single intermediate-pressure turbine
blade … [which] fractured following the initiation and
growth of a fatigue crack from an origin area near the blade
inner root platform.”
The cause of the blade failure was not immediately identified, but the manufacturer’s post-accident analysis revealed
that “wear and loss of material from the turbine blade outer
interlocking shrouds had reduced the rigidity and damping effects of the shroud and may have contributed to the high-cycle
fatigue cracking and failure.”
The manufacturer’s analysis was continuing.
The ATSB said that Rolls-Royce issued non-modification
service bulletin 72-G739 in October 2011, directing operators to inspect the intermediate-pressure turbine blades in the
affected engines to determine if any shroud interlock material
was missing. Qantas had completed the required inspections
and found no instances of excessive wear, the ATSB said.
The agency said three similar events have been reported
in RB211-524 history and the probability of further events is
“extremely low.” Blade separation probably will result in engine
malfunctions and an in-flight engine shutdown, but risks to
the safety of continued flight are minor, the ATSB said.
light Safety Foundation (FSF) and the International
Civil Aviation Organization (ICAO) have begun a new
cooperative effort to promote and share aviation safety
information and metrics.
The new worldwide initiative is designed to support
ICAO guidance for safety management systems, which
calls for increased monitoring, analysis and reporting of
safety data.
“The establishment of this framework for enhanced
cooperation with FSF is an important step in helping us
achieve the highest levels of aviation safety worldwide,”
said Roberto Kobe González, president of the ICAO Council. “Aviation safety knows no borders, and these types of
collaborative data sharing and risk mitigation efforts are
essential to help states and industry address safety risks
before they lead to a serious incident or accident.”
The memorandum of cooperation calls for ICAO and
the Foundation to work together to encourage compliance
with ICAO standards and recommended practices and
related guidance material.
The memorandum also “promotes joint activities
between the organizations in the areas of data sharing and
analysis, training and technical assistance,” according to
the announcement of the agreement. “The joint analyses
developed will facilitate the harmonization of proactive
and predictive safety metrics and the promotion of a just
safety culture globally.”
William R. Voss, then FSF president and CEO, noting
that some U.S. air carriers and the U.S. Federal Aviation
Administration already operate under cooperative datasharing agreements, said the new cooperative agreement
would help other countries “establish models that are
suited to their unique needs and constraints.”
Regional forums will be convened soon to aid in establishing information-sharing goals.
In Other News …
Michael Huerta was sworn in as administrator of the U.S.
Federal Aviation Administration in early January, after serving as acting administrator for more than one year. … The
European Union and Eurocontrol have agreed to establish
a new framework for cooperation in implementing the
Single European Sky program. … The European Commission has removed all air carriers certified in Mauritania
from its list of those banned from operating in the European
Union. The December revision added to the list air carriers
certified in Eritrea.
Compiled and edited by Linda Werfelman.
FLIGHTSAFETY.ORG | AEROSAFETYWORLD | FEBRUARY 2013
| 11](https://image.slidesharecdn.com/aswfeb13low-131027074409-phpapp01/85/Asw-feb13-low-13-320.jpg)
![COVERSTORY
T
oday’s portable sensors and data-analysis
techniques enable scientists worldwide to
visualize dimensions, measure velocities
and track positions of wake vortices generated by specific variants of large commercial jets.
That’s a far cry from igniting elevated smoke pots
for low-level overflights in the early 1970s, says
Steven Lang, director of the U.S. Center for Air
Traffic Systems and Operations at the John A.
Volpe National Transportation Systems Center.
“Wake turbulence is an inevitable consequence of flight — aircraft lift generation,” Lang
said during a Web briefing for news media in
November 2012. “Wake turbulence separations
in a sense reduce capacity at airports because you
have to add spacing behind the larger aircraft for
safety mitigation.”
The evolving precision partly explains how
several redesigns of air traffic procedures have
been accomplished recently, he said, summarizing a paper published in October.1 In the
United States, Volpe and the Federal Aviation
Administration (FAA), often in partnership
with European counterparts, have used field
research to build safety cases verifying that risks
in proposed changes to air traffic control (ATC)
procedures are acceptable. .
Essentially, the National Airspace System
has begun to see the results of a decision in 2001
that set near-term, mid-term and long-term
goals “to focus on operationally feasible solutions rather than just looking at wake science as
a solution,” Lang said. Flexibility was added, too,
to explore solutions to practical problems other
than encounters with heavy-jet wake vortices (see
“Airbus Measures Relative Wake Vortex Characteristics,” p. 14). Lang also credited clear-cut,
stakeholder advisory processes launched then
under the FAA’s safety management system.
In the past 30 years, various sensors and
techniques incrementally improved study of
wake generation, transport and decay. The most
radical change came from pulsed lidar, which
Lang described as “a radar-laser type of device
that actually measures the vortex as it’s generated
from the aircraft [and] shed from the aircraft. …
Outmaneuvered
AIRFLOW
BY WAYNE ROSENKRANS
U.S. wake vortex science safely updates approach and
departure concepts essential to NextGen capacity gains.
12 |
FLIGHT SAFETY FOUNDATION | AEROSAFETYWORLD | FEBRUARY 2013](https://image.slidesharecdn.com/aswfeb13low-131027074409-phpapp01/85/Asw-feb13-low-14-320.jpg)
![© Steve Morris/AirTeamImages.com
COVERSTORY
The entire safety region that we have to
be concerned with is now measurable by
pulsed lidar.”
Cooperation among global networks
of scientists also has accelerated the
development of practical solutions for
wake vortex mitigation. Another factor
has been bringing together pilots, airline
safety specialists, air traffic controllers,
the science community and regulators.
“Before that, it was purely a science effort,” he recalled. “The scientists decided
what they wanted to study, what they
wanted to research and there was little
involvement from the people that actually had to fly or operate the system.”
The ATC innovations discussed fall
into two types: closely spaced parallel
runway operations and single-runway
in-trail wake separation operations. The
FAA defines closely spaced parallel runways as runways that have less than 2,500
ft (762 m) between their centerlines.
In planning the Next Generation Air
Transportation System (NextGen), increased system capacity will come partly
from satellite-based communication,
navigation and surveillance advances
that enable aircraft to be operated with
minimum spacing needed for safety. But
Lang said, “All those things are wonderful, but the last piece … is the maximum
spacing needed, which is wake turbulence separation. … It’s good that you
did all of that navigation improvement
and surveillance improvement and
everything else that goes along with that,
but if you don’t solve the wake problem,
you can’t put aircraft closer together. …
So it’s very important that wake turbulence gets solved in time for NextGen.
… Unless wake turbulence is addressed,
you’re stuck with what you have. …
Many concepts would not realize their
full potential.”
For example, one of the long-term
ATC standards within NextGen will be
FLIGHTSAFETY.ORG | AEROSAFETYWORLD | FEBRUARY 2013
dynamic pairwise separation. “That’s
where the aircraft weight configuration, the weather condition … the time
of arrival, the route of flight are all
taken into account and then [ATC will]
develop the separation standard for that
specific scenario,” he said. “So one day,
you might be 4 nm [7.4 km] behind
an aircraft; the next day you might
be 3 nm [5.6 km] behind the aircraft
because of the configuration, the weight
and the [meteorological] conditions.
… So it’s a system that … delivers a
spacing, a yea-or-nay spacing, to the
controller that [says] ‘Yes, you can do it,’
or ‘No, you cannot do it.’”
With that still on the far horizon,
FAA and Volpe also revisited procedures
that had been based on now-outdated
wake vortex measurements. One effort
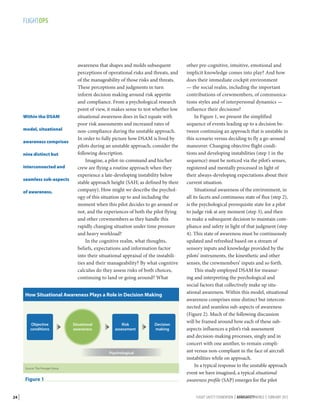
proved with safety-case data that positioning a smaller aircraft at least 1.5 nm
(2.8 km) from any larger aircraft during
their arrivals to closely spaced parallel
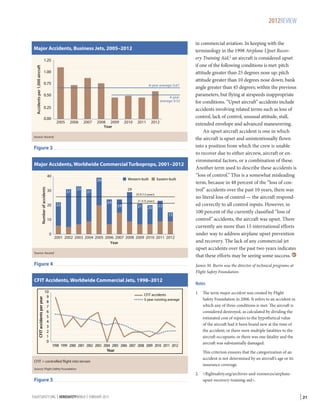
runways could be done safely (Figure 1).
Safety cases now are being prepared
to add two more airports to the eight
for which such runway pairings were
authorized as of October 2012.
“By using the parallel runways,
you actually reduce the risk of a wake
encounter for the parallel-runway
Staggered ILS Approaches to Closely Spaced Parallel Runways
Threshold
stagger
2,500 ft
(762 m)
separation
Aircraft #2 may be any
weight type, and uses a
GSA for higher approach;
ATC in-trail standard
separation rules (as for
single runways) apply for
an aircraft following #2.
ATC = air traffic control
CSPR = closely spaced parallel runways
GSA = glide slope angle
Diagonal withinpair spacing at least
1.5 nm (2.8 km)
Aircraft #1, the lead
aircraft of the reducedseparation pair, is
restricted to large or small
weight type for ATC to
apply this staggered CSPR
arrival procedure,
typically with GSA for
lower approach.
ILS = instrument landing system
IMC = instrument meteorological conditions
Note: This ATC procedure during IMC has been implemented at eight major U.S. airports, enabling
controllers to safely apply this minimum 1.5-nm within-pair spacing regardless of wake vortices or wind
conditions. GSAs vary from 2.75 to 3.1 degrees.
Source: Steven R. Lang and U.S. Federal Aviation Administration Air Traffic Organization, “1.5-Nautical Mile Dependent Approaches
to Parallel Runways Spaced Less Than 2,500 Feet Apart,” Policy JO 7110.308 CHG 3, effective Oct. 30, 2012.
Figure 1
| 13](https://image.slidesharecdn.com/aswfeb13low-131027074409-phpapp01/85/Asw-feb13-low-15-320.jpg)
![COVERSTORY
Airbus Measures Relative Wake Vortex Characteristics
W
ake vortex encounters severe enough to threaten
an upset of one large commercial jet flying behind
another have been rare for simple reasons, suggest
recent presentations of data from experiments by Airbus.
Benign encounters are very common, however, says Claude
Lelaie, senior vice president and product safety officer,
Airbus, and a former Airbus test pilot and airline captain.
“The probability to have a severe encounter is in fact very
low,” Lelaie said. “Why? Because you have to enter the vortex,
a very small tube … about 6 m [20 ft] diameter. You have to
enter exactly in the center, and you have to enter with the
proper [10-degree] angle. … If you have turbulence and so
on, everything disappears. … Even when trying to have a
strong encounter every time, we did not manage to have a
strong encounter every time.”
Nevertheless, the Airbus analysis also has concluded that
“there is a possibility to have a severe encounter in flight
where there is a type of generating aircraft at a distance
[more than] the standard minimum 5 nm [9 km] separation
and with 1,000 ft vertical separation,” he said.
Airbus presented these data and conclusions to the
Wake Vortex Study Group of the International Civil Aviation
Organization (ICAO), which has been updating recommendations for flight crews and air traffic controllers. Lelaie also
briefed Flight Safety Foundation’s International Air Safety
Seminar in October 2012 in Santiago, Chile.
The 200 encounters Airbus studied were carefully orchestrated missions — at a cruise altitude of about 35,000 ft — to
insert a follower aircraft into the center of the strongest/
worst wake vortices/contrails to induce effects associated with in-flight upset, Lelaie said. The missions involved
precisely positioning the generator-follower pairs in ideal,
repeatable calm-weather conditions. An Airbus A380 with an
adjacent A340-600 or a Boeing 747-400 on a parallel flight
path were used as the wake vortex–generators. The A340600 and an Airbus A318 took turns as follower aircraft. He
described one test protocol.
“Two aircraft were flying side by side [into the wind], the
A380 and the reference aircraft, which was either a 340-600 or
the 747,” Lelaie said. “An A318 was flying behind and below at
a distance between 5 and 15 nm, and we had above a Falcon
20 from the DLR [German Aerospace Center] with an onboard
lidar.”1 A 10-degree entry angle was considered the most critical case. “If you are almost parallel, you will be ejected from the
vortex,” he said. “If you cross perpendicularly, [the encounter]
will be very short and almost nothing will happen.”
Some findings ran counter to conventional assumptions
about wake vortex effects on the existing design of reduced
vertical separation minimums operations, notably what he
termed an incorrect assumption that wake vortices from a 747
do not descend more than 800 or 900 ft.
Airline pilot knowledge and training to correct an unexpected roll remain sufficient mitigations for wake vortex
encounters involving one large commercial jet behind
another, he noted. “In the vortex … you can get strong vertical
acceleration, positive or negative,” Lelaie said. “For the vortex
encounter, what we clearly recommend [to Airbus flight crews]
is please do nothing. Release controls and do nothing, and
once you have passed the vortex, nothing will happen. …
The roll [response] is just normal roll control.” International
guidance on airplane upset prevention and recovery has been
published by government and industry.2
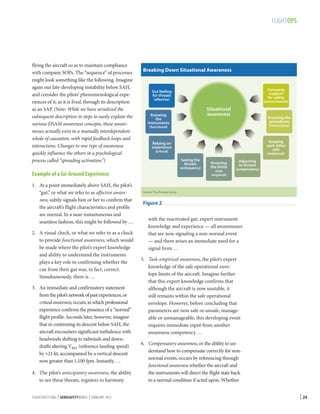
One part of the Airbus study focused on measuring the
rate of descent of wake vortices from each generator aircraft.
Another focused on effects on the follower aircraft. The most
important effect was roll acceleration, the direct indicator of
vortex strength (Table 1, p. 16). Less interesting to researchers in practical terms were altitude loss, bank angle, vertical
acceleration and roll rate, he said. Scientific instruments and
video cameras also documented the bank, buffeting and the
pilot’s correction of uncommanded bank.
Regarding the rates of descent of vortices while flying at
Mach 0.85, there was no difference between the A380 and
747-400, Lelaie said. He noted, “There was a slight difference
with the A340-600 flying at Mach 0.82, but at the end of the
day, all vortices [had descended] 1,000 feet at around 12, 14,
15 nm [22, 26, 28 km]. … This showed clearly that … at 15
nm behind any of these aircraft, you can find a vortex. … The
[strength/roll rate acceleration] decrease with the distance is
rather slow. At 5 nm, you have a good encounter; at 15 [nm]
you have decreased [strength of ] maybe 30 to 40 percent, it’s
not a lot.”
As expected, lateral-acceleration maximum load factor
and minimum load factor were significantly different in the
forces recorded at the back of the follower-aircraft fuselage
versus those felt by occupants because the airplane’s turning
point actually is in front of the aircraft. “These load factors are
not what the passenger or what the pilot can feel,” he said.
“[They’re] much higher.” Nevertheless, occupants may feel
strong lateral acceleration on the order of 2.5 g, 2.5 times
normal gravitational acceleration. “Even at 18 nm [33 km], we
have with all aircraft 2 g, again at the back,” he added, and
data in some cases showed small negative-g values.
“One which is interesting is this one, 747 and A318,” he
said. “Look at that: –0.7 [g],” he said. “In the middle of the fuselage it would have been –0.4 or –0.3 [g] but the [unrestrained
person] in that seat will bump on the ceiling.” Cases of the
A380 followed by the A318 and the A380 followed by the
Continued on p. 16
14 |
FLIGHT SAFETY FOUNDATION | AEROSAFETYWORLD | FEBRUARY 2013](https://image.slidesharecdn.com/aswfeb13low-131027074409-phpapp01/85/Asw-feb13-low-16-320.jpg)
![COVERSTORY
aircraft versus going in-trail,” Lang said,
explaining that “by placing an aircraft in
a staggered position, it has less risk of a
wake encounter than if you put it single
file to the same runway.”
Data collection and building of
safety cases for arrivals positioned
FAA/Volpe to pursue similar concepts
to make simultaneous departures of
disparate-size aircraft on closely spaced
parallel runways feasible mainly by taking into account the effect of a favorable
wind direction and velocity through
a new wake turbulence mitigation for
departure (WTMD) system.
To mitigate the risk of a wake
encounter, “physics tells you that if [one
aircraft] is a heavy jet, you would have
to stop this [other, lighter] aircraft from
departing for three minutes in this geometry (Figure 2) or two minutes if this
[runway end is staggered by] less than
500 ft [152 m],” he said. “If the wind is
blowing this direction, this wake for the
most part cannot transport against the
wind and get over to that [parallel] runway. … The controllers have a system
in the control tower at … three airports
— going live in January at Houston and
then in San Francisco and Memphis.”
The system advises the controller with
a red light/green light display when the
required conditions exist.
When fully available in Houston, “we
envision [WTMD] will increase their
capacity significantly [by] three, maybe
four departures an hour,” Lang added.
The third focus of practical solutions
derived from advanced measurement
has been single-runway solutions. Essentially, this program recategorizes aircraft
from their legacy ATC-spacing categories, based on wide ranges of maximum
takeoff weights and wingspans, to a new
set of six categories based on different
parameters. Under the legacy system,
both a Boeing 747 that weighs about
FLIGHTSAFETY.ORG | AEROSAFETYWORLD | FEBRUARY 2013
900,000 lb (408,233 kg) and a 767 that
pairwise separation will be supported
weighs about 320,000 lb (147,417 kg)
in weather-based phase 3. Lang said
were in the heavy category B.
that such changes typically take time
“These two aircraft have to be 4 nm
to generate predictable and measurapart because they are in that same
able capacity benefits while the local
category, regardless of [which] is in
ATC personnel become accustomed to
front, [and that] doesn’t make a lot of
new procedures.
sense,” he said. “The [767] behind [the
Related applications of wake vortex
747] probably needed 4 nm but the 747
data have enabled the FAA to divide
following [the 767] did not need 4 nm.”
three variants of the 757 within U.S.
The resulting program, implemented in
ATC separation and in separation stanMemphis in November, is called Wake
dards of the International Civil AviaRECAT phase 1 and includes additional tion Organization. Another example
safety buffers for the lightest aircraft
he cited was Volpe’s wake data collec3 Preliminary reports estimate at
types.
tion for Boeing during testing of the
least a 10-percent capacity boost, and
747‑800 for standards development.
possibly 20 percent.
“In Memphis, the one
Concept of Wake Turbulence Mitigation
observation that FedEx has
for Departures
made is they used to have
backups at the runway both for
arrivals and departures, and
Wind direction
now they find themselves ‘drying up,’ as they call it,” he said.
1,300 ft
“Recategorization has now
made it [so] that there is no
queue, and now they’re having
to rethink how they get the
Wake vortices
aircraft out of the ramp areas,
out to the runway to be able to
30L
take advantage of the empty
runway.” This system operates
1,500 ft
independently of meteorological conditions.
The main reason that
30R
other airports cannot implement Wake RECAT phase 1
STL = Lambert–St. Louis International Airport
IAH = Houston Intercontinental Airport
in the same time frame has
MEM = Memphis International Airport
involved local variations in
SFO = San Francisco International Airport
Note: An operational demonstration at three U.S. airports
ATC automation systems, he
with closely spaced parallel runways (IAH, MEM and
said. Wake RECAT phase 2,
SFO; not including STL used here for illustration) permits
upwind-runway departures to occur simultaneously with
also under way, supports ATC
downwind-runway departures that meet specified realstatic pairwise separation —
time wind criteria with conditions of approximately 3 mi
(5 km) visibility and a minimum 1,000 ft ceiling.
that is, separation based on
Source: Steven R. Lang, John A. Volpe National Transportation Systems
airport-specific categories of
Center, U.S. Department of Transportation
aircraft. As noted, the longFigure 2
term move to ATC dynamic
| 15](https://image.slidesharecdn.com/aswfeb13low-131027074409-phpapp01/85/Asw-feb13-low-17-320.jpg)
![COVERSTORY
Airbus Measures Relative Wake Vortex Characteristics (continued)
A340-600 also showed that “you can have something quite
strong in terms of g,” he said.
Lelaie also pointed to ongoing work by a Eurocontrol–
Delft University of Technology study, looking at the correlation between actual wake vortex encounters and mapped
hot spots, areas where encounters were predicted based on
European air traffic data, as a promising path to further risk
reduction.
— WR
Notes
Lidar means light detection and ranging, and pulsed lidar
combines laser and radar sensor technology to visualize and
measure wake vortex characteristics.
1.
2. One such resource that discusses wake turbulence is the
Airplane Upset Recovery Training Aid, Revision 2 (November
2008) available at flightsafety.org/archives-and-resources/
airplane-upset-recovery-training-aid.
Wake Vortex-Induced Main Upsets for Selected Cases in Encounters Tested by Airbus
Vertical Separation 1,000 ft
Generator airplane
A380
A340-600
B747-400
Vertical Separation 1,000 ft
B747-400
A380
A380
B747-400
A380
A340-600
A340-600
Follower airplane
A318
A318
A318
A318
A318
A318
Horizontal separation (nm)
12.2
12.3
5.32
14.9
13.5
18.1
15.8
19.3
Vertical separation (ft)
838
608
432
832
851
1,015
1,038
1,168
49
75
69
146
24
68
109
12
Roll rate (deg/s)
24
35
18
36
5
20
31
7
Bank (degrees)
46
38
35
31
10
29
34
10
Roll acceleration
(deg/s2)
deg/sec2 = degrees per second per second
deg/sec = degrees per second
Note:
The A318, A340-600 and A380 are Airbus aircraft types; the 747-400 is a Boeing aircraft type. Airbus also reported the lateral and vertical accelerations
of the follower aircraft; these are not shown.
Source: Claude Lelaie
Table 1
Rethinking wake turbulence risk has involved
more than the research capability. For example,
meteorological and short-term wind nowcasting
have improved significantly. “One thing FAA is has
been pursuing, and we have been supporting, is
getting wind [data] off the aircraft [in real time],”
Lang said. “Currently, that’s probably the best sensor in existence [but so far] the system does not
receive wind off of the aircraft.”
Volpe also has been working with FAA’s
Aviation Safety Information Analysis and Sharing program and the FAA-industry Commercial
Aviation Safety Team in seeking to eventually
acquire aggregated, de-identified data that
might better link the scientists to airline experiences with wake encounters.
16 |
Notes
1. Tittsworth, Jeffrey A.; Lang, Steven R.; Johnson,
Edward J.; Barnes, Stephen. “Federal Aviation
Administration Wake Turbulence Program — Recent
Highlights.” Paper presented to Air Traffic Control
Association Annual Conference and Exhibition,
Oct. 1–3, 2012. ntl.bts.gov/lib/45000/45900/45912/
Lang__Wake_Turbulence_Program.pdf
2. FAA. “1.5-Nautical Mile Dependent Approaches to
Parallel Runways Spaced Less Than 2,500 Feet Apart.”
Air Traffic Organization Policy JO 7110.308 CHG 3,
effective Oct. 30, 2012.
3. FAA. “Guidance for the Implementation of Wake
Turbulence Recategorization Separation Standards
at Memphis International Airport.” Air Traffic
Organization Policy N JO 7110.608, effective Nov.
1, 2012.
FLIGHT SAFETY FOUNDATION | AEROSAFETYWORLD | FEBRUARY 2013](https://image.slidesharecdn.com/aswfeb13low-131027074409-phpapp01/85/Asw-feb13-low-18-320.jpg)

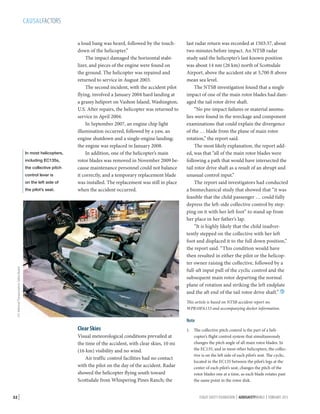
![CAUSALFACTORS
Three Incidents
The accident helicopter was manufactured in
1999, was purchased by SGA from its original
FLIGHTSAFETY.ORG | AEROSAFETYWORLD | FEBRUARY 2013
Eurocopter EC135 T1
© Łukasz Golowanow Maciek Hypś, Konflikty.pl/Wikimedia
One instructor said the accident pilot “displayed an abnormally high degree of perceived
pressure to accomplish flights from the owner
of the helicopter” and was “visibly shaken when
discussing the amount of pressure he received.”
The instructor said that, during initial transition ground school training in 2002, the accident pilot had told him “that it would not be
uncommon to fly the helicopter’s owner from
Seattle to his home of Vashon Island when the
weather conditions at night were so poor that
they would follow the ferryboat lights to navigate across the bay under foggy conditions.”
The other instructor said that, during a
2008 training session, the accident pilot had
commented “about the owner dominating the
cockpit duties prior to a flight.
“I emphasized the importance of following
the checklist and always performing the hydraulic check. He commented that when the owner
flies, he gets in the cockpit and ‘flips switches
and goes.’ I felt [the accident pilot] was intimidated by the owner and would not insist proper
aircraft procedures be followed.”
In information submitted by SGA for the
accident investigation, the company’s chief pilot
questioned the instructors’ accounts. He wrote
that he considered the accident pilot as “not a
pilot who would be intimidated” and “a conscientious and professional pilot, in every sense of
the word.”
Noting that the instructors had “inferred
that [the accident pilot] feared for his job if he
did not perform his trips regardless of risk,”
the chief pilot said, “After 24 years of service
with Services Group of America, there could be
nothing further from the truth. I do not believe
that an individual could stay at any company
that long if they felt such pressure from their
employer.” The accident pilot had left SGA in
the late 1990s but returned three years later and
remained with the company until his death, the
chief pilot said.
T
he EC135 is a twin-turbine light helicopter first flown in 1988 with
two Allison 250-C20R engines.
The T1, first delivered to a U.S. customer in 1996, is the
Turbomeca engine version. The accident helicopter was equipped with
two TM USA Arrius 2B1 turboshaft engines.
The helicopter can be equipped to seat up to eight people. It has
a maximum normal takeoff weight of 5,997 lb (2,720 kg), maximum
cruising speed at sea level of 139 kt and a maximum range at sea level
with standard fuel of 402 nm (745 km).
Source: Jane’s All the World’s Aircraft, U.S. National Transportation Safety Board Accident Report No.
WPR10FA133
owner in 2002 and had accumulated 1,116
operating hours. It had been maintained in accordance with the manufacturer’s recommendations, and its most recent annual inspection had
been conducted Oct. 30, 2009.
The helicopter had two Turbomeca USA
Arrius 2B1 turboshaft engines. At the time of
the October 2009 inspection, the left engine had
recorded 1,103 hours total time since new, and
the right engine, 227 hours.
The helicopter had been involved in three
incidents before the crash, the report said.
In the first incident, in May 2003, the
helicopter’s owner was at the controls when the
left seat — reportedly “not in the proper detent
position” — slid aft, the report said.
“The helicopter dropped about 50 ft but
was recovered by a quick collective input,” the
report said. “In an incident report submitted
by American Eurocopter, it was reported that
| 31](https://image.slidesharecdn.com/aswfeb13low-131027074409-phpapp01/85/Asw-feb13-low-33-320.jpg)
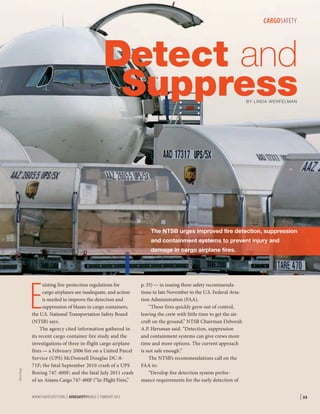
![Smoke billows from
an aluminum and
polycarbonate cargo
container during
flammability tests.
34 |
fires originating within cargo containers and
pallets and, once developed, implement the
new requirements;
“Ensure that cargo container construction
materials meet the same flammability requirements as all other cargo compartment materials in accordance with [U.S. Federal Aviation
Regulations (FARs) Part 25.855]; and,
“Require the installation and use of active
fire suppression systems in all aircraft cargo
compartments or containers, or both, such that
fires are not allowed to develop.”
Cargo aircraft currently are subject to the
same FAA fire-protection regulations that
govern all transport category aircraft, the NTSB
said.
“Although these regulations limit the flammability of construction materials used in cargo
compartments and also specify minimum fire
resistance requirements for cargo compartment
liners, there is limited regulation concerning fire
protection associated with cargo containers,” the
NTSB said.
For example, the agency noted that materials
selected for the construction of cargo containers undergo a horizontal Bunsen burner test,
“which does not prevent the use of highly combustible materials.”
In addition, “the effect of the use of containers and pallets to contain cargo is not factored
into the current overall fire protection strategy
or certification process,” the NTSB said, noting
that the certification process is conducted using
empty cargo compartments.
In a letter to then-Acting FAA Administrator Michael Huerta that accompanied the safety
recommendations, the NTSB discussed the
findings of accident investigations and a series
of tests conducted in August 2011 to develop
a better understanding of cargo container fires
and the most appropriate prevention strategies.1
The tests — designed in part to examine
the burning characteristics of cargo container
fires — prompted researchers to conclude that
“container design has a significant effect on
the time it takes for an internal fire to become
detectable to a smoke detector outside the
container” and that “container construction
materials have a significant effect on the total
fire load2 and energy release rate of a cargo
fire,” the NTSB said.
In the two accidents in 2010 and 2011,
investigators found “a relatively short interval
between the time a fire warning indication
was delivered to the flight crew and the onset
of flight control and aircraft system failures,”
the NTSB said. In the fatal UPS crash, about
2 minutes 30 seconds elapsed between the
first fire warning and the loss of some aircraft
systems; timing information has not been
released in the ongoing Asiana investigation,
the NTSB said.
The NTSB’s report on the 2011 tests, published in a report in March 2012, concluded that
“the time it takes for a fire detection system to
detect a fire originating within a cargo container
may easily exceed the one-minute time frame
specified in … Part 25.858(a)” and that “the
growth rate of container fires after they become
detectable by the aircraft’s smoke detection
system can be extremely fast, precluding any
mitigating action and resulting in an overwhelming fire.”
In tests of cargo containers, the NTSB found
that the time between fire initiation and fire
FLIGHT SAFETY FOUNDATION | AEROSAFETYWORLD | FEBRUARY 2013
U.S. National Transportation Safety Board
CARGOSAFETY](https://image.slidesharecdn.com/aswfeb13low-131027074409-phpapp01/85/Asw-feb13-low-36-320.jpg)
![CARGOSAFETY
detection ranged from 2 minutes 30 seconds to
18 minutes 30 seconds — longer than the oneminute detection time currently required.
“The fires grew very large, capable of causing significant damage to an aircraft, shortly after becoming a detectable fire,” the report said.
“The NTSB is concerned that, when fires inside
containers become detectable to the aircraft’s
smoke-detection system, there is little time
until the fires reach levels that can compromise
the integrity of the cargo compartment and
then threaten the structure and systems of the
aircraft. …
“If the fire were to be detected while generating smoke inside the container, valuable time
would be gained for alerting flight crews and
mitigating the effects of the fire.”
Because existing regulations dealing with
flammability limits are “very limited” for cargo
container materials, those materials can significantly increase the fire load within a cargo
compartment, the NTSB said.
For example, the agency cited collapsible
containers made from corrugated polypropylene
as “significant contributors” to fire intensity.
Fire Suppression
Most current practices base fire suppression
in main deck cargo compartments on passive suppression systems, such as the use of
fire-resistant materials and oxygen deprivation. Because the compartments are so large,
however, fires can become very large before
oxygen deprivation slows their growth, the
NTSB said.
In the 2006 UPS blaze, the agency said,
“the aircraft did not achieve depressurization
[which aids in suppressing flames] until after
system failures and flight control issues began
to occur.”
Tests by FAA researchers have found that,
although depressurization contributes to fire
suppression, when an aircraft descends to a more
oxygen-rich environment, the fire again begins
to grow.
“Hence, experience from the UPS [Dubai]
accident, as well as FAA experiments, suggest
WWW.FLIGHTSAFETY.ORG | AEROSAFETYWORLD | FEBRUARY 2013
In-Flight Fires
T
hree in-flight cargo airplane fires were cited by the U.S. National
Transportation Safety Board (NTSB) in its recommendations for
improved fire safety.
The first was a Feb. 7, 2006, fire in a United Parcel Service
(UPS) McDonnell Douglas DC-8-71F, which landed at Philadelphia
International Airport after the crew smelled smoke and then — 20 minutes later — the “CARGO SMOKE” light illuminated (ASW, 4/08, p. 28).
All three crewmembers were treated for minor injuries from
smoke inhalation, and the airplane was destroyed. The NTSB said the
cargo fire began “from an unknown source,” probably inside one of
the DC-8’s cargo containers; contributing factors were the “inadequate certification test requirements for smoke and fire detection
systems and the lack of an on-board fire suppression system.”1
Deborah Hersman, a member of the NTSB and now its chairman, said during the agency’s public hearing on the accident that
the flight was “seconds from disaster.”
The second fire broke out on a UPS Boeing 747-400F
that crashed Sept. 3, 2010, inside an army base near Dubai
International Airport (DXB) in the United Arab Emirates. The two
flight crewmembers were killed, and the airplane was destroyed.
An interim report by the UAE General Civil Aviation Authority
(GCAA) said that a fire warning light illuminated about 22 minutes
after takeoff from DXB while the airplane was in cruise at 32,000 ft.
The crew declared an emergency, and the airplane crashed as they
maneuvered to land at DBX. The investigation is continuing.2
The third fire occurred July 28, 2011, on an Asiana Cargo
747-400F, which crashed 70 nm (130 km) west of Jeju Island,
Republic of Korea, as the flight crew attempted to divert to Jeju
International Airport because of the fire. Both pilots were killed,
and the airplane was destroyed. The investigation by the South
Korean Aircraft and Railway Accident Investigation Board (ARAIB)
is continuing.3
— LW
Notes
1.
NTSB. Accident Report No. NTSB/AAR-07/07, “Inflight Cargo Fire; United
Parcel Service Company Flight 1307; McDonnell Douglas DC-8-71F,
N748UP; Philadelphia, Pennsylvania; February 7, 2006.” Dec. 4, 2007.
2.
GCAA. Accident Reference 13-2010, “Air Accident Investigation
Interim Report: Boeing 747-44AF, N571UP; Dubai, United Arab
Emirates; September 03, 2010.”
3.
ARAIB. ARAIB/AAR1105, “Aircraft Accident Investigation Interim
Report: Crash Into the Sea After an In-Flight Fire; Asiana Airlines,
B747-400F/HL7604; 130 Km West of Jeju International Airport; July
28, 2011.”
that passive fire suppression in large cargo compartments due to oxygen deprivation may not
be effective,” the NTSB said.
| 35](https://image.slidesharecdn.com/aswfeb13low-131027074409-phpapp01/85/Asw-feb13-low-37-320.jpg)
![CARGOSAFETY
The agency noted that, in 2007, as a result of
its investigation of the 2006 fire, it had recommended that the FAA require fire-suppression
systems for the cargo compartments of all FARs
Part 121 cargo airplanes. The NTSB reported that
the FAA’s response had been that the cost of installing “compartment-flooding fire-suppression
systems, as those used in Class C cargo compartments,3 was not justified for the main deck cargo
compartments of aircraft of any weight.”
However, the NTSB said that the fires in 2010
and 2011 “continue to demonstrate the critical
need to suppress cargo fires.”
As an alternative to the compartment-
flooding system evaluated by the FAA, the
NTSB suggested alternatives, including the
“aircraft-based system” used by FedEx and incontainer suppression systems being developed
by the industry.
‘Multi-Layered Approach’
The NTSB’s issuance of the safety recommendations coincided with an announcement by UPS
that it had developed a “multi-layered approach
consisting of matched solutions that include
checklists, training and new technologies” to
mitigate in-flight cargo fires.
Among those new technologies are fireresistant fiber-reinforced plastic containers, experimental fire-suppression units that “smother
a fire with potassium aerosol powder and can
save 95 percent of packages in the container”
and fire-containment covers for palletized cargo.
The approach was developed by a UPS/Independent Pilots Association task force that had
identified as its first step “increasing the time a
crew had to manage a smoke or fire event,” said
Capt. Bob Brown, a task force member.
The group’s goal was to contain a fire inside
a unit load device (ULD) for four hours. In a
test in October, a ULD containing 215 packages,
including “20 working laptops with batteries, 50
working cell phones with batteries and 300 bulkshipped lithium ion batteries, was set on fire by
six lithium ion batteries,” Brown wrote in Leading Edge, the UPS flight operations and safety
magazine.4 “Although temperatures reached as
36 |
high as 1,200 degrees [F (649 degrees C)], the
fire was suppressed for four hours and 95 percent of the packages were undamaged. Even the
laptops worked.”
UPS said that it also is installing quickdonning integrated oxygen masks and smoke
goggles in all aircraft, and the VisionSafe Corp.
Emergency Vision Assurance System (EVAS),
designed to displace smoke in a pilot’s vision
path to allow him or her to see basic flight
instruments and the flight path, as well as
emergency checklists and navigation charts.5
Automatic Suppression Systems
FedEx Express began installing on-board automatic fire-suppression systems in its aircraft in
2009, the same year it won the FSF-Honeywell
Bendix Trophy for Aviation Safety for developing the devices (ASW, 11/09, p. 39).
The system incorporated infrared heat sensors, foaming-agent generators and an overhead
cargo-container injector. If the sensors detect
heat in a cargo container, the overhead firesuppression equipment activates, piercing the
container and injecting argon foam. At the
same time, the crew is alerted.
Notes
1. NTSB. Materials Laboratory Study Report No. 12019. March 21, 2012. In addition to addressing the
burning characteristics of container fires, the study
also examined the fire-load contribution of lithium
and lithium-ion batteries. The NTSB noted that the
involvement of these types of batteries “has come
into question” in both the 2006 fire and the 2010 fire.
2. Fire load is defined by the NTSB as “the amount of combustible material that can become involved in a fire.”
3. Class C cargo compartments have smoke or fire
detector systems that provide warnings on the flight
deck; built-in, pilot-controlled, fire-suppression
systems; methods of excluding hazardous amounts
of smoke from any occupied portions of the airplane;
and methods of controlled compartment ventilation.
4. Brown, Bob. “UPS/IPA Safety Task Force Pioneers
Advancements in Aviation Safety.” Leading Edge (Fall
2012): 2.
5. VisionSafe Corp. EVAS. visionsafecorporation.com/
VisionSafe_Corporation/Product_Info.html.
FLIGHT SAFETY FOUNDATION | AEROSAFETYWORLD | FEBRUARY 2013](https://image.slidesharecdn.com/aswfeb13low-131027074409-phpapp01/85/Asw-feb13-low-38-320.jpg)
![SEMINARSIASS
SMS rule for other types of aviation businesses.
Alarcón said phase one elements of the road
map have been completed successfully, the second phase is in progress, and the final phase is
slated to be done by the end of 2015. More than
50 SMS courses have been taught in Chile since
2006, and 32 percent of the 1,050 DGAC staff
have attended so far, with 80 percent expected to
be SMS-trained by 2015.
David McMillan, then director general of
Eurocontrol and new chairman of the FSF Board
of Governors, quoted Alarcón’s characterization
of the situation as an “explosion of growth” in
both Chile and the region. “It’s important to be
sure that we deliver the safety which is necessary,”
McMillan said, comparing these circumstances
with those in some other regions, such as Europe,
now facing tough cost-cutting among airlines and
air navigation service providers alike.
“The issue is how you … make sure that
safety gets the resources it needs at a time when
tough action is indeed being taken to address
those costs,” he said. “Europe has a great safety
record. But as you know, it took a lot of work to
get there, and it’s extremely important not to fall
into the trap of complacent thinking or to think
that excellent safety practices can be sustained
without effort.”
Regional Aviation Safety Group
The Regional Aviation Safety Group–Pan
America (RASG-PA), a government-industry
partnership, was formed in 2008 in Costa Rica
under the framework of the International Civil
Aviation Organization (ICAO) Global Aviation
Safety Plan and Global Aviation Safety Roadmap to support a performance-based aviation
safety system.
Chile, which has not had a fatal accident
involving a major air carrier in 24 years, inspires
regional leaders to mitigate their key risks, said
Loretta Martin, secretary of RASG-PA and regional director for ICAO’s North America, Central America and Caribbean Regional Office,
which encompasses 20 states and 12 territories.
According to ICAO definitions, Pan
America had 52 accidents, including four fatal
FLIGHTSAFETY.ORG | AEROSAFETYWORLD | FEBRUARY 2013
accidents, in 2011. The five-year moving average
for the period ending in 2011 showed “basically,
globally, that [the trend is] going down slightly
and very slightly in the Pan America region,”
Martin said. RASG-PA currently focuses on
“three main killers” that account for 73 percent
of all accidents worldwide — runway excursions, loss of control–in flight and controlled
flight into terrain (CFIT) — because of their
equal regional relevance.
RASG-PA has promoted the use of standardized CFIT awareness training, tool kits for
runway excursion reduction and runway safety
teams; conducted research on go-arounds and
mitigation of unstable approaches; added to
flight training an advanced maneuvers manual
and tool kits on pilot monitoring; conducted
safety workshops; issued a runway-maintenance
manual in conjunction with Airports Council
International; and issued the first in a series of
safety advisories, covering airplane automation
mode awareness and energy state management
risks.
“We had air navigation safety and aviation
security, but until this group was established,
we never quite had a forum for states together
with industry to [focus on operational safety]
— RASG-PA is it,” said Oscar Derby, director
general of the Jamaican Civil Aviation Authority and government co-chair of RASG-PA. The
group especially has been strong in providing
states with data-driven guidance on compliance with eight critical elements defined by
ICAO and making the world’s best information
resources readily available — and mostly free
of charge — through the group’s website www.
rasg-pa.org.
From the beginning, RASG-PA leaders realized that implementation of safety management
systems was hampered by inadequate event reporting linked to absence of voluntary, nonpunitive reporting systems. “In some [legal] systems,
if you make a report, it is mandatory that you
be prosecuted for making the report,” Derby
said, “And so it took us three years to develop a
legal framework that would suit the various legal
systems and allow for the protection of safety
“It’s extremely
important not to
fall into the trap
of complacent
thinking or to
think that excellent
safety practices
can be sustained
without effort.”
| 43](https://image.slidesharecdn.com/aswfeb13low-131027074409-phpapp01/85/Asw-feb13-low-45-320.jpg)
![SEMINARSIASS
information.” This work has enabled
the group to conduct training sessions
and seminars that equip states to roll
out this legal framework.
Derby cited regional versus global
data on air transport accident rates.1
“The 10-year moving average from
1990 through 2000 for all regions …
was 1.2 [accidents per million departures],” he said. “The [Latin America
and Caribbean region’s comparable]
10-year moving average was 3.8. … In
the 2010 10-year moving average, Latin
America has made huge strides in moving that accident rate down [to 2.3],
with the world rate going down to 1.0
per million.”
Derby noted that RASG-PA has
been acutely aware of the disparity in
safety performance among operators of
large commercial jets versus operators
of turboprop airplanes in some parts of
the region, and the group’s issue analysis team soon will determine whether
new targeted mitigations are warranted.
The group nevertheless has a few
areas of concern. “One of them is infrastructure,” said Alex de Gunten, executive director of the Latin American
and Caribbean Air Transport Association (ALTA) and industry co-chair of
RASG-PA. “We’ve got a major concern
as to where … are we going to land [a
much larger fleet of] airplanes in the
next 20 years, because our airports are
already saturated.”
None of the region’s airlines that
participate in the International Air
Transport Association (IATA) Operational Safety Audit (IOSA) program
has had a fatal accident in four years,
de Gunten said. “We’ve got a few
priorities in the region, number one is
IOSA. … If we look at the accident
rate of IOSA versus non-IOSA [carriers] for Latin America over the last
four years … the Latin American
44 |
carriers are about the world average,
actually slightly below the world average. But where you see a big jump is
in the non-IOSA carriers, and this is an
area that concerns us all. … We have
a number of governments that have
already taken IOSA as part of their
certification and requirements; Chile
is one of those countries, Brazil [is another]. However, we still need to make
sure that we do not create two levels of
aviation in the region.”
RASG-PA and IATA in 2012 collaborated on data sharing and shared
trend analysis. As of November, data
from flights reflecting more than 80
percent of available seat kilometers
have been collected in a new data
exchange program, de Gunten said. A
small related program has brought together a trusted regional team “working
and sharing information, trend information to again identify opportunities,
identify risks and mitigate them, and
we have already had some very significant results in terms of changes of
procedures, reductions of [traffic-alert
and collision avoidance system alerts],
etc., and a similar program is now also
working in Brazil [and] Chile.”
Among other issues vying for attention, despite ICAO’s standards for pilot–
air traffic controller phraseology, “we
are not where we should be in the region
based on a recent RASG-PA survey [of
the two professions],” he said. “We …
asked them if they knew the standard
ICAO phraseology; about 31 percent
said ‘no.’ We asked those who knew
[it], ‘Do you apply it 100 percent of the
time?’ and about another 25 percent said
‘no.’ … This is an area of concern.”
Contrary to other presenters,
de Gunten downplayed the anxiety
seen among regional lawyers and
some safety professionals about
potential abuses of confidential safety
information. Data-sharing initiatives so
far are flourishing regardless of those
fears “because at the CEO level of the
airlines of ALTA, they strongly feel
that the risk is much smaller than the
benefits that we can get by sharing that
data,” he explained, and the gaps in
protection often have been overcome
by sheer creativity. “ALTA gathers
the data, puts it together and shows it;
we don’t print it, we don’t give it to
the authorities because we’re still not
protected,” he said. “They look at it,
we work together, and then we go and
we do our work.”
Panama’s Data-Sharing Emphasis
Despite an iceberg-size volume of advice floating around about SMS for air
carriers, difficulty in practical implementation of the theories and processes
can leave an airline with the sense that
something essential is still “hidden below the waterline,” said José Eduardo
Rodríguez, a captain and director of
safety and quality assurance for Copa
Airlines. A year-long project at his
company recently reviewed elements
of its SMS — including nonpunitive
safety reporting methods — in consultation with the Autoridad Aeronáutica
Civil of Panama (AAC) and Flight
Safety Foundation.
The current focus of the project is
working closely with the pilot union,
and subsequent phases will involve the
remaining unions to encourage a strong
voluntary reporting culture. “Trying to
build [this] within the company is not an
easy step,” Rodríguez said. “It’s something that takes time. It takes a lot of
training from the organization, a lot of
reception and trust from the rest of the
coworkers.” The only precedent had
been mandatory occurrence reports.
Nonpunitive reporting also involves
safety action groups in operational
FLIGHT SAFETY FOUNDATION | AEROSAFETYWORLD | FEBRUARY 2013](https://image.slidesharecdn.com/aswfeb13low-131027074409-phpapp01/85/Asw-feb13-low-46-320.jpg)
![DATALINK
information concerning the risk of landing
overrun events by offering analysis of landing
performance for the first time. That includes
monitoring threshold crossing height, airspeed
at threshold, float distance, tailwind at threshold
and runway remaining when slowed to 80 kt.
These events will be combined to provide analysis
of the newly drafted stabilized landing concept.
Event rates in 2011 that exceeded the aircraft’s recommended operating limits tended
to be low; those events primarily consisted of
calibrated airspeed beyond the aircraft model’s
flap speed limit, based on the aircraft’s reference
flight manual. That occurred slightly more than
0.7 times per 100 flights. C-FOQA Centerline
says its data suggest that flap overspeed events
generally decline markedly after the first two
years in the program when flight departments
take measures to reduce them.
All the other measured operating limits
exceedances occurred less than 0.2 times per
100 flights.
Aircraft system events for 2011 were negligible in number except for selecting or maintaining reverse thrust while decelerating at relatively
slow speed.
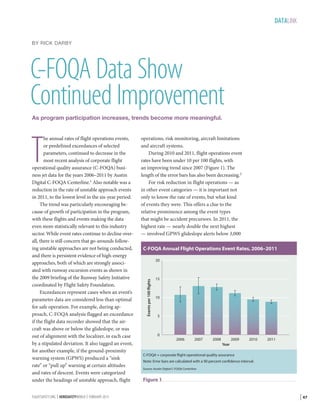
Participation in the C-FOQA program has
grown steadily since it was initiated in 2006 (Figure 6, p. 50). In 2011, more than 10,000 flights
contributed data, for a total of more than 30,000
flights since the program’s origin. Twenty-five
operators participated in 2011, with the data representing 73 aircraft of 16 types or variants.
Pilot Fatigue Barometer
The European Cockpit Association, which represents national pilot associations of 37 European
states, has summarized the results of surveys conducted by some of its members in a report titled
“Pilot Fatigue Barometer.”4 The surveys were
carried out between 2010 and 2012 in Austria,
Denmark, France, Germany, the Netherlands,
Norway, Sweden and the United Kingdom. Some
6,000 pilots responded to queries about how
fatigue affected their flying performance.
Mentioning several well-known accidents in
which pilot fatigue was cited as a causal factor,
FLIGHTSAFETY.ORG | AEROSAFETYWORLD | FEBRUARY 2013
C-FOQA Unstable Approach Event Rates, by Type, 2011
0
Events per 100 flights
0.2
0.4
0.6
Above glideslope on approach
Fast approach [CAS-VAPP]
Below glideslope on approach
Late gear extension
Late final flap extension
Not aligned with runway (localizer deviation)
High rate of descent on final approach
Slow approach [CAS-VAPP]
Approach unsteady in roll
Approach unsteady in pitch
Final flap position not valid for landing
C-FOQA = corporate flight operational quality assurance; CAS = calibrated airspeed;
VAPP = approach speed
Source: Austin Digital C-FOQA Centerline
Figure 4
C-FOQA Risk Monitoring Event Rates, by Type, 2011
0
Events per 100 flights
0.1
0.2
0.3
0.4
Risk of controlled flight into terrain
Risk of runway overrun during landing
Risk of wing or pod strike during landing
Risk of fuel exhaustion
C-FOQA = corporate flight operational quality assurance
Source: Austin Digital C-FOQA Centerline
Figure 5
the report also suggests that fatigue often goes
unreported in accidents and incidents — first,
because pilots are reluctant to admit flying
“under the influence” of fatigue out of concern it
could provoke punitive action by an employer or
even criminal prosecution; second, if the pilots
happen to be killed in an accident, fatigue leaves
no material evidence.
The main potential consequences of fatigue
during flight duty include degradation of
thought processes, perception and reaction
time; periods of unintended sleep; and momentary “micro-sleep.” Percentages of pilots
who reported having experienced fatigue in the
cockpit ranged from 93 percent of those in the
Denmark survey to 45 percent who responded
to the U.K. survey. Pilots who said they had
dozed off or had a spell of micro-sleep ranged
| 49](https://image.slidesharecdn.com/aswfeb13low-131027074409-phpapp01/85/Asw-feb13-low-51-320.jpg)
![DATALINK
C-FOQA Participation, 2006–2011
35,000
30,000
Total flights in the program
New flights
Flights
25,000
20,000
15,000
10,000
5,000
0
2006
2007
2008
2009
2010
2011
Year
C-FOQA = corporate flight operational quality assurance
Note: As of end of year 2011, 73 aircraft of the following types contributed to the data set:
Boeing BBJ, Bombardier Challenger 300, Bombardier Challenger 604, Bombardier Challenger
605, Bombardier Global Express, Bombardier Global Express XRS, Cessna Citation X, Dassault
Falcon 2000EX, Dassault Falcon 900DX, Dassault Falcon 900EX, Dassault Falcon 7X, Embraer
ERJ-135, Gulfstream G450, Gulfstream G550, Gulfstream GIV and Gulfstream GV.
Source: Austin Digital C-FOQA Centerline
Figure 6
from 54 percent of respondents from Sweden
to 10 percent of those from France. The report
did not speculate on the reasons for the national
differences among responses.
“More than three out of five pilots in Sweden
(71 percent), Norway (79 percent) and Denmark
(80–90 percent) acknowledge [having] made
mistakes due to fatigue, while in Germany it was
four out of five pilots,” the report says.
Responses indicated that 92 percent of German pilots reported that they had felt “too tired”
or “unfit” for duty on the flight deck at least once
in the previous three years. In the Austrian pilot
association, 85 percent of respondents reported
that they had been too fatigued for flight duty but
nevertheless had reported for their assignments.
Two-thirds of those said they had flown under
that condition more than once. Swedish and
Danish pilots reported similar percentages.
“According to the surveys among pilots,
night flights or a series of night flights are major
contributors to fatigue,” the report says. “For
example, in France, almost 70 percent of the
pilots identify night flights as a cause of fatigue.
Nearly half of the respondents in Germany agree
50 |
that night flights are one of the major causes of
pilot fatigue. …
“The study among British pilots shows that
fatigue prevalence is associated with the number
of sectors, flying and duty hours or [the commander’s decision making] frequency.”
Other identified causes included a series of
morning departures; insufficient rest between
duty periods; being recalled from standby status;
and inadequate rest accommodations.
Nevertheless, the report says, only 20 to 30
percent of the pilots polled reported that they
had acknowledged feeling unfit for duty. “Such
under-reporting of fatigue has been confirmed
by an independent survey of 50 U.K. aviation
medical examiners in April 2011,” the report
says. “The vast majority (70 percent) of the aviation medical examiners believe that pilots are reluctant to report fatigue within their company.”
About a third of the pilots who chose not to file
fatigue reports gave as their reason that they were
too tired at the end of an exhausting workday.
Notes
1. The C-FOQA User’s Group — comprising all program participants — is led by a steering committee
plus Austin Digital, Flight Safety Foundation and
other external parties.
2. Austin Digital explains the meaning of error bars:
“When displaying event rates (e.g., events per 100
flights), it is appropriate to compute proportion confidence intervals — error bars — along with the raw
event rate. These bars indicate a range, based on the
number of flights sampled, within which the true rate
likely falls with high confidence. In general, the larger
the sample of data (i.e., more flights), the smaller the
error bar will be and the more confident you can be
that the resulting rate is a statistically significant value.”
3. Unstable approach criteria are aligned with the elements published by Flight Safety Foundation, which
include nine requirements, all of which must be
satisfied. The criteria also specify that flights must
be stabilized by 1,000 ft above airport elevation in
instrument meteorological conditions and by 500
ft above airport elevation in visual meteorological
conditions. FSF ALAR Tool Kit, Briefing Note 7.1,
flightsafety.org/files/alar_bn7-1stablizedappr.pdf.
4. www.eurocockpit.be/sites/default/files/eca_barometer_on_pilot_fatigue_12_1107_f.pdf.
FLIGHT SAFETY FOUNDATION | AEROSAFETYWORLD | FEBRUARY 2013](https://image.slidesharecdn.com/aswfeb13low-131027074409-phpapp01/85/Asw-feb13-low-52-320.jpg)
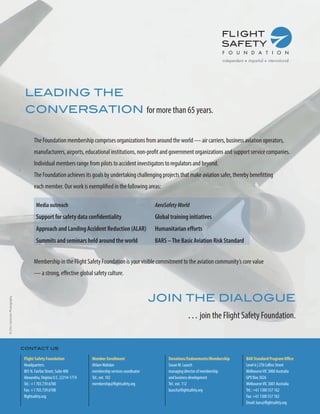
![INFOSCAN
SMS Under
the Microscope
A systematic review of
Insert document title
the effectiveness of
safety management systems
Dr Matthew J W Thomas | Westwood-Thomas Associates
Location | Date
Has the safety management system
concept been ‘oversold’?
BY RICK DA R BY
Research
Investigation
ATSB Transport Safety Report
Cross-modal Occurrence Investigation
[Insert Mode]Research Investigation
XR-2011-002
XX-YYYY-####
Final
REPORTS
Opinion Versus Evidence
A Systematic Review of the Effectiveness of Safety
Management Systems
Thomas, Matthew J.W., and Westwood-Thomas Associates.
Australian Transport Safety Bureau (ATSB). 46 pp. Figures, tables,
references, appendix. November 2012, updated Dec. 10. Available
at www.atsb.gov.au/publications/2012/xr-2011-002.aspx.
S
afety management systems (SMS) have
a vast amount of academic management
theory behind them, and their principles
seem logical. While there is some variation
in views of the components of an SMS, they
generally include identification of safety hazards; remedial action to reduce those hazards;
continuous monitoring of safety performance;
and continuous improvement of the SMS itself.
SMS might be said to represent a fundamental
conceptual change in risk management. The
emphasis shifts from compliance with reactive, externally generated procedures and
regulations “written in blood” — that is, based
on costly lessons from accidents — toward
internal analysis of hazards uncovered in
52 |
normal operations. Accident causal factors can
be anticipated and, as far as possible, mitigated
before they do their worst.
It is an exciting prospect, with a touch of
magic. We can take charge of the future rather
than just waiting to see what it throws at us.
SMS has been enthusiastically adopted by operators and regulators.
For example, this ATSB report cites an
Australian Civil Aviation Safety Authority
(CASA) document that it says “dedicates a
whole appendix to ‘selling’ the benefits of an
SMS.” Among the suggested benefits of an
SMS are a reduction in incidents and accidents; reduced direct and indirect costs;
safety confidence among the traveling public;
reduced insurance premiums; and proof of
diligence in the event of legal or regulatory
safety investigations.
But science insists: Prove it.
That, it turns out for the authors of this
ATSB report, is a tall order. Their report says,
“Unfortunately, [the CASA document] appendix makes no reference to any scientific
FLIGHT SAFETY FOUNDATION | AEROSAFETYWORLD | FEBRUARY 2013](https://image.slidesharecdn.com/aswfeb13low-131027074409-phpapp01/85/Asw-feb13-low-54-320.jpg)
![INFOSCAN
evidence to support these claims, nor legal
evidence with respect to due diligence. Indeed,
much of the regulatory effort with respect to
the adoption of SMS as the primary regulatory
platform has been characterised on uncritical
acceptance, and based on expert opinion and
face validity, rather than subjected to formal
scientific validation.
“Previous published reviews of SMS
research do not appear to provide strong
empirical evidence to support the specific
benefits of adopting an SMS. For instance,
the summary of a 2006 review of evidence
for the effectiveness of SMS across a wide
cross-section of industries suggests that there
has been a ‘less than expected’ reduction in
accident occurrence since the implementation of SMS.” (References can be found in the
original report.)
ATSB commissioned Matthew Thomas
and Westwood-Thomas Associates to undertake a meta-analysis of SMS research. The
authors began with a comprehensive search
of the literature and found 2,009 articles, a
promising start. However, the great majority
of the sources washed out because of rigorous
inclusion criteria. Among other requirements
were that only peer-reviewed articles published between 1980 and 2012 were accepted;
studies “must have clearly defined a research
question that related to the effectiveness
of safety management systems, or specific
components of a safety management system”;
studies must have defined effectiveness in
terms of safety-related outcomes, rather than
other standards such as improved productivity; and studies must have reported quantitative measures. There was also a quality
appraisal based on published guidelines for
methodological soundness.
Ultimately, 37 papers were determined to
be directly relevant to the objectives of the
investigation. However, “only 14 [studies]
involved an SMS designed to avoid low-probability/high-consequence (LP-HC) accidents”
FLIGHTSAFETY.ORG | AEROSAFETYWORLD | FEBRUARY 2013
— one way of looking at aircraft accidents
— “with the remaining 23 studies relating
to work health and safety,” the report says.
“In addition, very few of these studies were
undertaken in transport domains, and many
studies only measured subjective perceptions
of safety rather than objective measures. The
limited [amount of] quality empirical evidence
available relates to the difficulty of measuring
objective safety improvements in industries
where the SMS is aimed at avoiding LP-HC accidents and the relative recency of the application of SMS.”
Even among the 37 papers accepted for
analysis, the study’s authors were less than fully satisfied with the quality of evidence. Only
a single study met the scientific “gold standard,” a randomized, controlled trial. Of the 37
articles included in the systematic review, 19
used objective measures of safety performance.
And 15 of the 19 related to workplace health
and safety, using such metrics as occupational
injuries to workers. “Of these studies, the majority demonstrated significant positive effects
with respect to dimensions of SMS,” the report
says. “A number of studies found general relationships between SMS implementation and
safety performance.”
Eighteen of the 37 articles analyzed in the
systematic review used only subjective, selfreported measures of safety performance, most
with a survey-based methodology in which both
individual perceptions of effectiveness of SMS
components and safety metrics were subjective.
The report notes, however, that across multiple studies, there was scant agreement about
which components of an SMS individually
caused change in safety performance.
The four studies of L-P/H-C industries,
probably the most relevant to aviation, demonstrated “no consistent findings … with respect
to performance on various dimensions of an
SMS and poor safety outcomes. …
“Several studies explored the relationships between components of SMS and
‘Previous published
reviews of SMS
research do not
appear to provide
strong empirical
evidence to support
the specific benefits
of adopting an SMS.’
| 53](https://image.slidesharecdn.com/aswfeb13low-131027074409-phpapp01/85/Asw-feb13-low-55-320.jpg)
![INFOSCAN
While an association
may be found between
an SMS ‘model’ and
better safety-related
behavior, it is not
clear whether a causal
relationship exists.
54 |
safety performance in the context of major
hazard facilities. The first of these studies
from an oil refinery environment established
a relationship between self-reported safety
performance and the two components of
(1) management commitment and (2) safety
communication. A second study, undertaken
by the same authors, found no direct effect
of management commitment, but rather (1)
supervision, (2) safety reporting and (3) team
collaboration as the immediate drivers of safe
work practices.
“Slightly different findings were obtained
in another study, whereby (1) management
commitment and (2) safety rules and procedures were found to be directly associated
with safe work practices in major hazard
facilities in India.”
One study seemed to offer some evidence
of what factors were effective in improving
safety performance. “This study, within the
maritime domain, found that safety behaviour
was influenced by safety policy and perceived
supervisor behaviour rather than other components of safety management systems,” the
report says. The authors of that study concluded that “shipping companies should therefore
invest large amounts of money in developing
and implementing safety rules, procedures
and training.”
The report says, “In perhaps one of the
most important studies [published in 2008] in
terms of relevance to high-risk transport industries (using a cross-section of industries), there
was no real relationship established between
everyday safety performance and -P/H-C
L
events. This finding from the U.S. highlights
the lack of clarity in what might actually be
driving ultra-safe performance, and in many
respects, the question as to SMS effectiveness is
unable to be adequately answered by even the
most recent research.”
The report questions the validity of surveys
and structural equation modeling — a statistical technique used to explore the relationship
between a number of different factors, and
their relationship to a particular outcome — in
this research context. Using such a methodology, it says, “to tease out the inter-relationships
between components of safety management
systems, safety climate factors and safety performance might not assist in clarifying the complex
set of factors influencing safety performance,
and does not really assist in enhancing our
understanding with respect to establishing the
effectiveness of SMS.”
A particular problem with surveys and selfreporting is that they “fail to utilise a standard
set of instruments, thus leaving the industry
unsure of exactly what is being measured. Furthermore, there is a tendency to infer causality
from the findings of these models, inasmuch
as increased management commitment leads
to reduced rates of safety occurrence. No such
directional causality can be inferred through
these study designs, and … each of these studies is limited from the perspective of common
method variance.”
In other words, while an association may
be found between an SMS “model” and better
safety-related behavior, it is not clear whether
a causal relationship exists. And if one does, it
has been impossible to determine if the causal
factor is one element of SMS, more than one element or the SMS in its entirety. Another way of
looking at the data, as suggested by the maritime
study, is that management commitment rather
than SMS is the active ingredient.
Textbooks about worker behavior invariably discuss the “Hawthorne effect,” derived
from a series of studies conducted at the
Western Electric Hawthorne Works in Cicero, Illinois, U.S., beginning in the 1920s.
Experimenters tested the effect of increasing
or decreasing the lighting in the employees’
work environment, as well as other variables,
on productivity. The researchers found that
productivity improved with any change, even
if it was only reversion to a previous condition.
Their eventual conclusion was that the output
FLIGHT SAFETY FOUNDATION | AEROSAFETYWORLD | FEBRUARY 2013](https://image.slidesharecdn.com/aswfeb13low-131027074409-phpapp01/85/Asw-feb13-low-56-320.jpg)
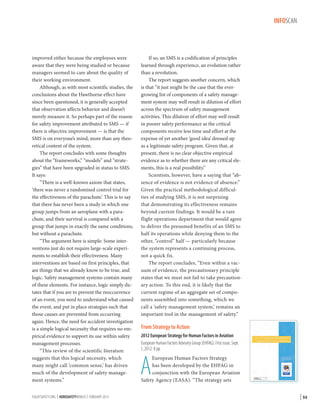
![INFOSCAN
Lessons should be
learned and shared
from many sources,
including accident
investigations,
data analysis
and operational
experience.
out to achieve two principal functions,” this
report says. “First, to foster consistency in the
integration of human factors principles in the
regulation, governance, system design, training, licensing, audit and assurance of aviation
activities. Second, it outlines how the practical understanding and application of human
factors can serve in enhancing safety performance across the aviation safety system. The
strategy serves as a framework document to
support the European Aviation Safety
Plan (EASP).”
The strategy encompasses Europe’s aviation
system as a whole — “rule makers, authorities,
investigators, researchers, service providers,
industry and other stakeholders.”
The EHFAG has significant input to EASA
rules and advisory materials, and in turn, the
EASA rules affect operators around the world.
For example, there are about 6,000 repair stations with U.S. Federal Aviation Regulations
Part 145 certificates. About 1,300 of those,
mainly the larger U.S. repair stations, are EASAcertificated. Many technicians working in the
United States are following EASA rules.
The EHFAG describes its guiding principles:
• “Providing appropriate governance
and leadership — This would include
consideration of appropriate HF [human
factors] expertise within the regulatory
organisations.”
• “Developing a balanced regulatory structure — Human factors principles will
be addressed in all the aviation regulations, whilst recognising the need for the
regulation to be proportionate with an
appropriate balance between rule, acceptable means of compliance (AMC) and
guidance material.”
• “Providing guidance and interpretive
material — Adequate tools, guidance and
AMC material to help industry apply human factors principles will be provided.
56 |
[Material] will help regulators oversee
the effective implementation of human
factors by industry and in incident and
accident investigations.”
• “Promoting the importance of human
factors — At a European level through
the EASA website, regular newsletters and
bulletins, and EASA conferences; at a national level through the cascading of EASA
promotion and national conferences.”
• “Coordinating activities — across organisations, including regulatory organisations, to avoid the transfer of risk from
one domain to another. This coordination should be across both European
and non-European aviation systems (e.g.,
with FAA [U.S. Federal Aviation Administration]). This should also include
coordination with other safety organisations and initiatives such as the European Strategic Safety Initiative; Advisory
Council for Aviation, Research, Innovation in Europe; Eurocontrol; and the
implementation of safety management
systems. EASA and the EHFAG should
seek opportunities to influence and coordinate human factors with international
bodies such as ICAO [International Civil
Aviation Organization].”
Lessons should be learned and shared from
many sources, including accident investigations,
data analysis and operational experience, the
report says.
The EHFAG’s next step will be to develop
an action plan from the strategy, converting it
into a detailed human factors program by the
end of June 2013. “Priority of tasks and actions
will be based on the impact to the overall improvement of safety performance,” the report
says. An appendix lists specific components of
the action plan under several headings, such as
“training and competency” and “regulation and
rulemaking.”
FLIGHT SAFETY FOUNDATION | AEROSAFETYWORLD | FEBRUARY 2013](https://image.slidesharecdn.com/aswfeb13low-131027074409-phpapp01/85/Asw-feb13-low-58-320.jpg)
![ONRECORD
Fatal Flight Test
G650 pilots received no warning of an incipient stall
during a takeoff-performance evaluation.
BY MARK LACAGNINA
The following information provides an awareness of problems that might be avoided in the
future. The information is based on final reports
by official investigative authorities on aircraft
accidents and incidents.
JETS
‘Aggressive Schedule’ Cited
Gulfstream G650. Destroyed. Four fatalities.
T
he manufacturer’s “persistent and increasingly aggressive attempts to achieve V2
[takeoff safety] speeds that were erroneously
low” and its “inadequate investigation” of previous uncommanded rolls during takeoff performance tests were among the probable causes of
the accident that killed all four crewmembers
during certification flight testing of the Gulfstream G650, according to the U.S. National
Transportation Safety Board (NTSB).
The accident occurred at Roswell (New Mexico, U.S.) International Air Center the morning
of April 2, 2011. The flight crew was conducting
a simulated one-engine-inoperative (OEI) takeoff
and was not able to correct an uncommanded
roll that occurred when the right wing stalled
on liftoff. The wing tip struck the runway, and
the experimental ultra-long-range, fly-by-wire
business airplane veered right, struck a concrete
platform housing electrical equipment and was
consumed by a fuel-fed fire. The pilots and both
flight test engineers succumbed to smoke inhalation and thermal injuries.
Flight testing that day, as well as during several
previous tests, had focused on achieving the
FLIGHTSAFETY.ORG | AEROSAFETYWORLD | FEBRUARY 2013
manufacturer’s target for V2, basically the minimum speed that a transport category airplane
must attain at a height of 35 ft to meet the required
OEI climb gradient to 400 ft. The V2 speeds
achieved during the tests had consistently been too
high to meet the manufacturer’s goal of providing
a balanced field length of 6,000 ft (1,829 m).
Various rotation techniques and angleof-attack (AOA) targets had been tried by
Gulfstream Aerospace’s flight-test crews, but
none had succeeded in meeting the target V2
without exceeding the 20-degree pitch angle
that had been set to assure passenger comfort.
The most recently developed technique included an abrupt and rapid rotation, using the
maximum allowed 75 lb (34 kg) of pull force on
the control column, to an initial 9-degree pitch
attitude, then a further increase in pitch attitude
to achieve V2. This technique had produced the
best results, exceeding the target by only 3 kt.
However, in the course of about a dozen
test flights earlier the morning of April 2, the
pilot-in-command (PIC) had decided that
a smooth rotation, pausing only briefly at 9
degrees before increasing pitch to about 16
degrees, might be a better and more repeatable
technique. “I’m not doing that jerk stuff,” he
told a flight test engineer. “It doesn’t work …
and I don’t think the FAA [U.S. Federal Aviation Administration] is going to like it, either.
It’s such a great-flying airplane, you shouldn’t
have to abuse it to get [it] flying.”
The NTSB report noted that both flight
crewmembers had extensive experience as test
pilots. The PIC had 11,237 flight hours, including 263 hours in G650 certification testing. The
| 57](https://image.slidesharecdn.com/aswfeb13low-131027074409-phpapp01/85/Asw-feb13-low-59-320.jpg)
![ONRECORD
Because of a
miscalculation of
the G650’s stall AOA
in ground effect,
the threshold for
activation of the
stick shaker and the
primary flight display
pitch-limit indicators
had been set too high.
58 |
second-in-command (SIC) had 3,940 flight
hours, including 140 hours in type.
During some of the earlier test flights that
morning, the use of a smooth rotation with a
brief pause at 9 degrees produced V2 speeds within 4 kt of the target (135 kt). The pilots agreed to
try an even briefer pause at 9 degrees during the
next takeoff, which was conducted on Roswell’s
Runway 21 with flaps extended 10 degrees. As
planned, the SIC moved the right thrust lever to
idle at 105 kt, simulating an engine failure. At 127
kt, the PIC began rotating the airplane for takeoff.
Recorded flight data indicated that there was no
pause when the pitch attitude reached 9 degrees.
AOA quickly exceeded 11 degrees, the outboard
section of the right wing stalled, and the airplane
rolled right. The PIC attempted to level the wings,
but the bank angle increased beyond 16 degrees.
The pilots had received no warning of the
asymmetric stall. Because of a miscalculation
of the G650’s stall AOA in ground effect, the
threshold for activation of the stick shaker and
the primary flight display pitch-limit indicators
had been set too high. “Ground effect refers to
changes in the airflow over the airplane resulting
from the proximity of the airplane to the ground,”
the report explained. “Ground effect results in
increased lift and reduced drag at a given [AOA],
as well as a reduction in the stall AOA.”
The stick shaker activated and the indicated
pitch attitude reached the limit shown on the
primary flight displays only after the stall occurred. The PIC pushed the control column
forward, applied full left control wheel and
rudder, and called for “power.” The SIC already
had moved the right thrust lever full forward.
Despite these inputs, the airplane remained in
a stalled condition. The sound of an automatic
warning when the right bank angle exceeded 30
degrees was captured by the cockpit voice recorder shortly before the recording ceased about
24 seconds after the takeoff was initiated.
The report noted that uncommanded rolls resulting from right outboard wing stalls had been
encountered during two previous test flights. In
both cases, the pilots recovered by reducing AOA.
The events subsequently were attributed to stalls
induced by over-rotation. “If Gulfstream had
performed an in-depth aerodynamic analysis of
these events shortly after they occurred, the company could have recognized before the accident
that the actual in-ground-effect stall AOA was
lower than predicted,” the report said.
Investigators found that the stall precipitating the accident had occurred at an AOA of
11.2 degrees, or about 2 degrees lower than the
predicted stall AOA in ground effect.
The report said that contributing to the
accident was the manufacturer’s “aggressive”
flight-test-program schedule, which was designed
to achieve certification of the G650 by the third
quarter of 2011. “The schedule pressure … led to
a strong focus on keeping the program moving
and a reluctance to challenge key assumptions.”
The report noted that after the accident,
Gulfstream suspended performance flight testing and implemented several corrective actions.
The target V2 was increased by 15 kt, while
maximum takeoff thrust was increased by 5
percent to meet the takeoff performance goals.
Certification of the new airplane eventually was
achieved in September 2012.
The accident investigation generated 10
safety recommendations, including the NTSB’s
call for the FAA to work with the independent
Flight Test Safety Committee to develop detailed
guidance for aircraft manufacturers on flight test
operations (ASW, 11/12, p. 15).
Illness Prompts Diversion
Boeing 777-200. No damage. No injuries.
M
ore than an hour after the airplane departed from Paris for a flight to New York
the morning of Jan. 17, 2011, the captain
became ill. A physician among the passengers
diagnosed gastroenteritis and applied basic antispasmodic treatment, after which the captain
decided to continue the flight, said the report by
the French Bureau d’Enquêtes et d’Analyses.
About 90 minutes later, the captain felt
abdominal pain. “The doctor observed that the
captain was very pale, with stiffness, shaking and
severe pains in the abdominal region,” the report
said. The copilot declared an emergency and
FLIGHT SAFETY FOUNDATION | AEROSAFETYWORLD | FEBRUARY 2013](https://image.slidesharecdn.com/aswfeb13low-131027074409-phpapp01/85/Asw-feb13-low-60-320.jpg)
![ONRECORD
diverted the flight to Keflavik, Iceland. “During
the descent, an improvement in the captain’s condition allowed him to assume the duties of PNF
[pilot not flying],” the report said. The airplane
was landed without further incident.
The captain was taken to a hospital, where
he was observed and released the same day.
“The investigation could not determine the exact nature of the captain’s pains,” the report said.
Microburst on Short Final
Airbus A340. Substantial damage. No injuries.
V
isual meteorological conditions (VMC), with
winds from 360 degrees at 5 kt, had been
reported at Darwin (Northern Territory,
Australia) Airport the night of Feb. 28, 2012, but,
while completing the instrument landing system
(ILS) approach to Runway 29, the flight crew saw
heavy rain close to the threshold.
The crew asked the airport traffic controller for an update on the weather conditions.
The controller replied that there was a storm
extending to the east from the runway threshold
but that the reported wind was still from 360
degrees at 5 kt. The Australian Transport Safety
Bureau (ATSB) report noted that the wind data
were derived from sensors located about 2.3 km
(1.2 nm) from the threshold.
“The crew briefed the possibility of a missed
approach if the conditions deteriorated,” the
report said.
Rainfall increased as the aircraft neared the
runway. The crew set maximum continuous
thrust to arrest an increased sink rate encountered at 55 ft above ground level (AGL) but then
reduced thrust to idle shortly thereafter. “As the
aircraft entered the flare, the rain intensified,
significantly reducing visibility,” the report said.
The A340 touched down hard, with a recorded vertical acceleration of 2.71 g. None of
the 116 passengers and eight crewmembers was
hurt, but subsequent engineering inspections
disclosed a broken engine mount and damage
requiring replacement of several main landing
gear components.
The report said that analyses of recorded
flight data indicated that the aircraft might have
FLIGHTSAFETY.ORG | AEROSAFETYWORLD | FEBRUARY 2013
encountered a downburst, an intense localized
downdraft. The data showed that just before
touchdown, the wind had changed from a 9-kt
headwind to a 6-kt tailwind. “At touchdown, the
tailwind was recorded at 18 kt, and the rate of
descent was 783 fpm,” the report said.
Fuel Leak Causes Fire
Boeing 767-300. No damage. No injuries.
T
he 767 was climbing through 9,000 ft after
departing from New York’s John F. Kennedy
International Airport (JFK) for a flight to
Haiti with 201 passengers and 12 crewmembers
the morning of Feb. 8, 2012, when the flight
crew heard a bang that was immediately followed by warnings of a fire in the right engine.
The crew shut down the engine and discharged a fire bottle into the right nacelle. The
fire warning persisted until the crew discharged
the second fire bottle, the NTSB report said.
They declared an emergency and turned back to
JFK. The first officer flew the airplane while the
captain and standby first officer completed the
associated checklists and communicated with
the flight attendants. The crew then landed the
airplane without further incident.
Subsequent examination of the 767 revealed
no damage from the fire or the overweight landing. Investigators found that during maintenance the night before the incident, a bracket
and spray shield for the integrated drive generator’s fuel-oil heat exchanger had been reassembled incorrectly. “A seal under the fuel tube
flange that is held in place by the bracket had the
O-ring partially missing, which was the source
of the fuel leak,” the report said. “Contributing to the cause of the fire was the 767 Aircraft
Maintenance Manual’s lack of any graphical or
pictorial displays of the correct assembly of the
two-piece bracket and spray shield.”
During maintenance
the night before the
incident, a bracket
and spray shield for
the integrated drive
generator’s fuel-oil
heat exchanger had
been reassembled
incorrectly.
Head-On Over the Atlantic
Airbus A319, Boeing 737-800. No damage. No injuries.
A
controller’s loss of awareness of the airplanes’
flight paths resulted in the issuance of a climb
clearance that placed the A319 and the 737
on a head-on collision course off the eastern coast
| 59](https://image.slidesharecdn.com/aswfeb13low-131027074409-phpapp01/85/Asw-feb13-low-61-320.jpg)
![ONRECORD
of the United States the evening of Nov. 11, 2010,
according to an NTSB incident report.
The flight crews of both airplanes received,
and followed, traffic-alert and collision avoidance system (TCAS) resolution advisories that
resulted in the A319 and the 737 passing about
1,800 ft vertically and 2.8 nm (5.2 km) laterally of each other about 66 nm (122 km) east of
Hobe Sound, Florida.
The A319 had been southeast-bound at
Flight Level (FL) 360 (approximately 36,000 ft),
en route from Washington to Bogotá, Colombia.
The 737 was northwest-bound at FL 370, en
route from Oranjestad, Aruba, to Atlanta.
The report said that the 737 was still “well
within” Miami Air Route Traffic Control Center
(ARTCC) Sector 21 when the sector controller
handed off the flight to the controller of an adjacent sector, Sector 2, which the 737 eventually
would enter — and which the A319 was transiting. About a minute later, the Sector 2 controller
handed off the A319 to the Sector 21 controller.
The Sector 21 controller had the 737’s data
tag from his radar display and “did not maintain
awareness” of the airplane’s position after handing off the 737 to the Sector 2 controller, the
report said. Unaware of the conflict he was creating, the Sector 21 controller cleared the A319
to climb to FL 370, “which placed the flight in
direct conflict with the 737,” the report said.
Shortly thereafter, the ARTCC’s radar data
processing system generated a conflict alert, and
the sector controllers radioed traffic advisories and
instructions to resolve the conflict. However, the
flight crews of both airplanes replied that they were
following TCAS resolution advisories. The 737
crew also reported that they had the A319 in sight.
Tug Slides on Slippery Ramp
Bombardier CRJ200. Substantial damage. No injuries.
T
he airplane had been dispatched with its
auxiliary power unit (APU) inoperative per
the minimum equipment list and was two
hours behind schedule for departure from Salt
Lake City the night of Nov. 23, 2010. “The captain stated that he started both engines [using
an external power cart] due to a concern that
60 |
by starting one engine only he would encounter
control problems taxiing in the slippery conditions,” said the NTSB report.
Snow was falling, and the ramp area was
covered with snow and ice. “During pushback,
the tug was unable to gain enough traction to
move the airplane and was subsequently replaced with a larger tug,” which initially was able
to move the CRJ, the report said. However, the
airplane, with both engines at idle power, began
to overpower the tug.
“The captain … experienced a sensation of
unusual movement [and] asked the tug driver if
the driver still had control of the airplane,” the
report said. “The tug driver confirmed that he
had control; however, the airplane subsequently
moved forward while still attached to the tug,
which rotated to the right, striking the airplane’s
fuselage.” The collision damaged the CRJ’s lower
fuselage skin and several stringers.
The report said that a factor contributing to
the accident was that “no guidance existed for
either the flight or ground crew regarding pushback procedures in low-traction ramp conditions with an inoperative APU.”
TURBOPROPS
Altitude Deviation Unnoticed
Bombardier DHC-8-100. No damage. No injuries.
I
nadequate monitoring of flight instruments resulted in the continuation of a gradual descent
that placed the Dash 8 on a head-on collision
course with another aircraft off the east coast of
the Hudson Bay the afternoon of Feb. 7, 2011,
said a report by the Transportation Safety Board
of Canada (TSB). The TSB also faulted the absence of simulator training on TCAS maneuvers
for the initial incorrect reactions by the pilots of
both aircraft to TCAS resolution advisories.
The aircraft, both Dash 8s operated by the
same airline, were flying in opposite directions
between Puvirnituq and La Grande-Rivière,
Quebec, in VMC but in airspace not covered by
air traffic control (ATC) radar. The DHC-8-100,
with 28 passengers and three crewmembers, was
northbound to Puvirnituq at FL 230; the other
FLIGHT SAFETY FOUNDATION | AEROSAFETYWORLD | FEBRUARY 2013](https://image.slidesharecdn.com/aswfeb13low-131027074409-phpapp01/85/Asw-feb13-low-62-320.jpg)
![ONRECORD
aircraft, a DHC-8-300, was southbound at FL
220 with three crewmembers.
The -100 crew was using the autopilot’s
vertical-speed mode to maintain altitude because of pitch oscillations that often occurred
when the altitude-hold mode was selected. “The
use of [vertical-speed] mode is neither intended
for nor evaluated for this function, but nothing prohibited the flight crew from using it to
maintain altitude,” the report said.
The captain was alone in the cockpit, after the
first officer left for “physiological reasons,” and
did not notice when the -100 began to descend
at about 50 fpm, the report said. “Since the rate
of descent was very slow, the speed and attitude
of the aircraft were very similar to those of cruise
flight. It was therefore impossible to note the descent without reference to the flight instruments.”
During the next 14 minutes, the -100 descended about 700 ft. The captain apparently did not
notice the altitude-warning light. The first officer
was re-entering the cockpit when the TCAS generated a traffic advisory, then a resolution advisory
to climb. The captain disengaged the autopilot and
began a 38-degree-banked right turn. “During
this turn, the aircraft lost just over 50 ft in altitude
before beginning to climb,” the report said, noting
that the right turn might have been an automatic
reaction to opposite-direction traffic.
Meanwhile, the pilot flying the -300, the first
officer, had begun a shallow left climbing turn
after misinterpreting the TCAS “descend” resolution advisory displayed on the vertical speed
indicator. “It is possible that the appearance of
the [-100 target symbol] in the upper right-hand
corner of the display may have caused the [pilot]
to turn left,” the report said.
During these maneuvers, the aircraft passed
within 1,500 ft vertically and 0.8 nm (1.5 km)
laterally. Both aircraft then continued to their
destinations without further incident.
Lesions Induce Disorientation
CASA 212-100. Destroyed. Five fatalities.
A
TC radar and radio contact with the
aircraft were lost about 26 minutes after
it departed from Batam, Indonesia, with
FLIGHTSAFETY.ORG | AEROSAFETYWORLD | FEBRUARY 2013
two pilots and three company engineers for a
functional check flight the afternoon of Feb. 12,
2011. The wreckage was found on Bintan Island,
and subsequent examination revealed that the
propeller on the left engine was not rotating
on impact, said the report by the Indonesian
National Transportation Safety Committee.
Investigators found signs that the left engine
had erroneously been placed in reverse before
the pilots lost control of the aircraft. They found
no check flight plan or authorization for the PIC
to conduct the check flight following replacement of the left engine. The PIC, 61, had 13,027
flight hours, including 3,311 hours in type. The
first officer, 50, had 2,577 flight hours, including
152 hours in type.
A postmortem examination of the PIC
revealed lesions that had caused paralysis of
the vestibular organs in his right inner ear. The
report said this condition meant that the pilot
“could not [respond] normally to three-dimensional motion or movement” and may have
induced spatial disorientation.
Examination of the
windshield revealed
a peel-chip fracture
of the inner ply.
Windshield Shatters
Beech C90 King Air. Minor damage. No injuries.
T
he airplane had departed from Champaign,
Illinois, U.S., and was climbing through
23,400 ft the afternoon of Feb. 9, 2011,
when the flight instructor and commercial pilot
receiving instruction heard a loud bang as the
inner ply of the copilot’s windshield shattered.
“The [instructor] noted that the flight was
in clouds and that the temperature aloft … was
minus 23 degrees C [minus 9 degrees F],” the
NTSB report said. “Additionally, he stated that
there was no visible structural icing present and
the electric window heat was on.”
The instructor declared an emergency and
requested and received vectors from ATC to
the nearest suitable airport, Evansville, Indiana,
where the airplane was landed without further
incident.
Examination of the windshield revealed a
peel-chip fracture of the inner ply. This type
of fracture “has historically been an issue on
the King Air” and prompted the windshield
| 61](https://image.slidesharecdn.com/aswfeb13low-131027074409-phpapp01/85/Asw-feb13-low-63-320.jpg)
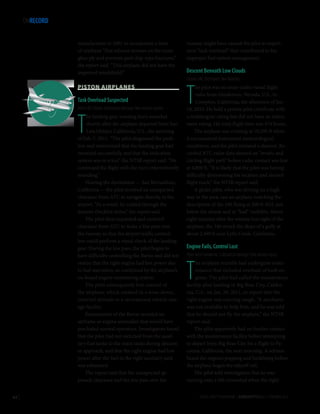
![ONRECORD
engine lost power. “He continued the left turn to
downwind and made sure to keep the airspeed
above the single-engine control speed of 90
mph,” the report said. “The pilot’s last recollection was turning to final approach and seeing
the runway.”
The report said that the pilot allowed
airspeed to decrease below the single-engine
control speed; information recovered from the
Twin Comanche’s global positioning system
indicated that the groundspeed was 76 mph
about 1,400 ft (427 m) from the runway threshold. “The airplane subsequently impacted the
roof of a private residence located about 900 ft
[274 m] from the runway threshold,” the report
said. “The airplane came to rest inverted in the
front yard.”
Examination of the wreckage revealed nothing to explain the loss of power, but the report
said that a contributing factor in the accident
was “the pilot’s decision to fly with a known
deficiency in one engine.”
able to escape, but the instructor and the passenger succumbed to thermal injuries.
Investigators found that the bolt securing
the lower flight control push-pull tube to the
left-front hydraulic servo had detached while
the helicopter was on the ground following the
simulated hydraulic failure. “The ‘feel’ of the
flight control fault [would have] mimicked a
hydraulic system failure,” the report said.
Although the precise cause of the bolt
detachment was not determined, investigators
found that “a number of self-locking nuts from
other aircraft, of the same specification as that
used to secure safety-critical fasteners in [the
accident helicopter] were identified to have
cracked due to hydrogen embrittlement.”
The report noted that the aluminum fuel
tanks in the helicopter had not been replaced
with bladder tanks, as recommended by a service bulletin issued by the manufacturer in December 2010 to “improve the R44 fuel system’s
resistance to a post-accident fuel leak.”
HELICOPTERS
Control Lost After Tail Strike
Control Fastener Detaches
Robinson R44 Astro. Destroyed. Two fatalities, one serious injury.
A
s part of a biennial flight review at Cessnock Aerodrome in New South Wales,
Australia, the morning of Feb. 4, 2011,
the instructor simulated a failure of the flight
control hydraulic boost system. After landing the helicopter, the pilot told the instructor that the hydraulic system would not
re-engage.
The passenger, who normally flew the
helicopter, told the instructor that the system
had been leaking and that he had replenished
the reservoir that morning. “The instructor announced that he would reposition the helicopter
to the apron to facilitate examination of the
hydraulic system,” the ATSB report said.
The instructor lost control of the R44 shortly
after becoming airborne. The helicopter was in
a steep left bank when it struck the runway and
came to rest on its left side. A fire erupted and
rapidly engulfed the helicopter. The pilot was
FLIGHTSAFETY.ORG | AEROSAFETYWORLD | FEBRUARY 2013
McDonnell Douglas 369FF. Substantial damage. One fatality, two
serious injuries, one minor injury.
T
he police helicopter was being used to
scout a 3,600-ft mountaintop near Marana,
Arizona, U.S., for installation of emergency
communications equipment the morning of Jan.
31, 2011. The NTSB report said that the weather
conditions, which included 10- to 15-kt winds,
were “within the helicopter’s and the pilot’s
performance capabilities.”
The pilot circled the peak before attempting
a pinnacle landing. “The passengers reported
that during the landing attempt, they felt a
bump, the helicopter rose a few feet, then the
nose pitched down and the helicopter began to
spin to the right,” the report said. “The helicopter tumbled and slid about 120 ft [37 m] down a
shallow canyon … before it was halted by rocks
and scrub vegetation.”
Investigators determined that the pilot, who
was killed in the crash, had lost control of the
helicopter after the tail rotor struck the ground
during the attempted pinnacle landing.
| 63](https://image.slidesharecdn.com/aswfeb13low-131027074409-phpapp01/85/Asw-feb13-low-65-320.jpg)
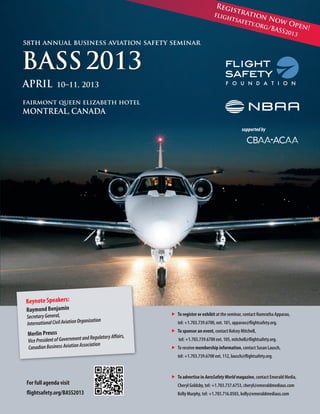

This document provides a summary of articles in the February 2013 issue of AeroSafety World magazine. The cover story examines perspectives on wake vortex research and measurement techniques. Other articles discuss go-around decision-making, an EC135 accident caused by abrupt collective input, fire detection and suppression on cargo aircraft, understanding Superstorm Sandy's impacts, and the return of controlled flight into terrain accidents. The document also provides information on upcoming industry events and Foundation seminars.


![TAR [ PAGE 1 ]](https://cdn.slidesharecdn.com/ss_thumbnails/nvntar1-110823103226-phpapp02-thumbnail.jpg?width=640&height=640&fit=bounds)


![5G Explained! A High Level Overview [Introduction]](https://cdn.slidesharecdn.com/ss_thumbnails/5gexplainedahighleveloverview-260119165306-cc137a3e-thumbnail.jpg?width=640&height=640&fit=bounds)


