Download as PDF, PPTX


![2014 © Alpha Architect. Back to Outline All Rights Reserved.
23
Strategy Background
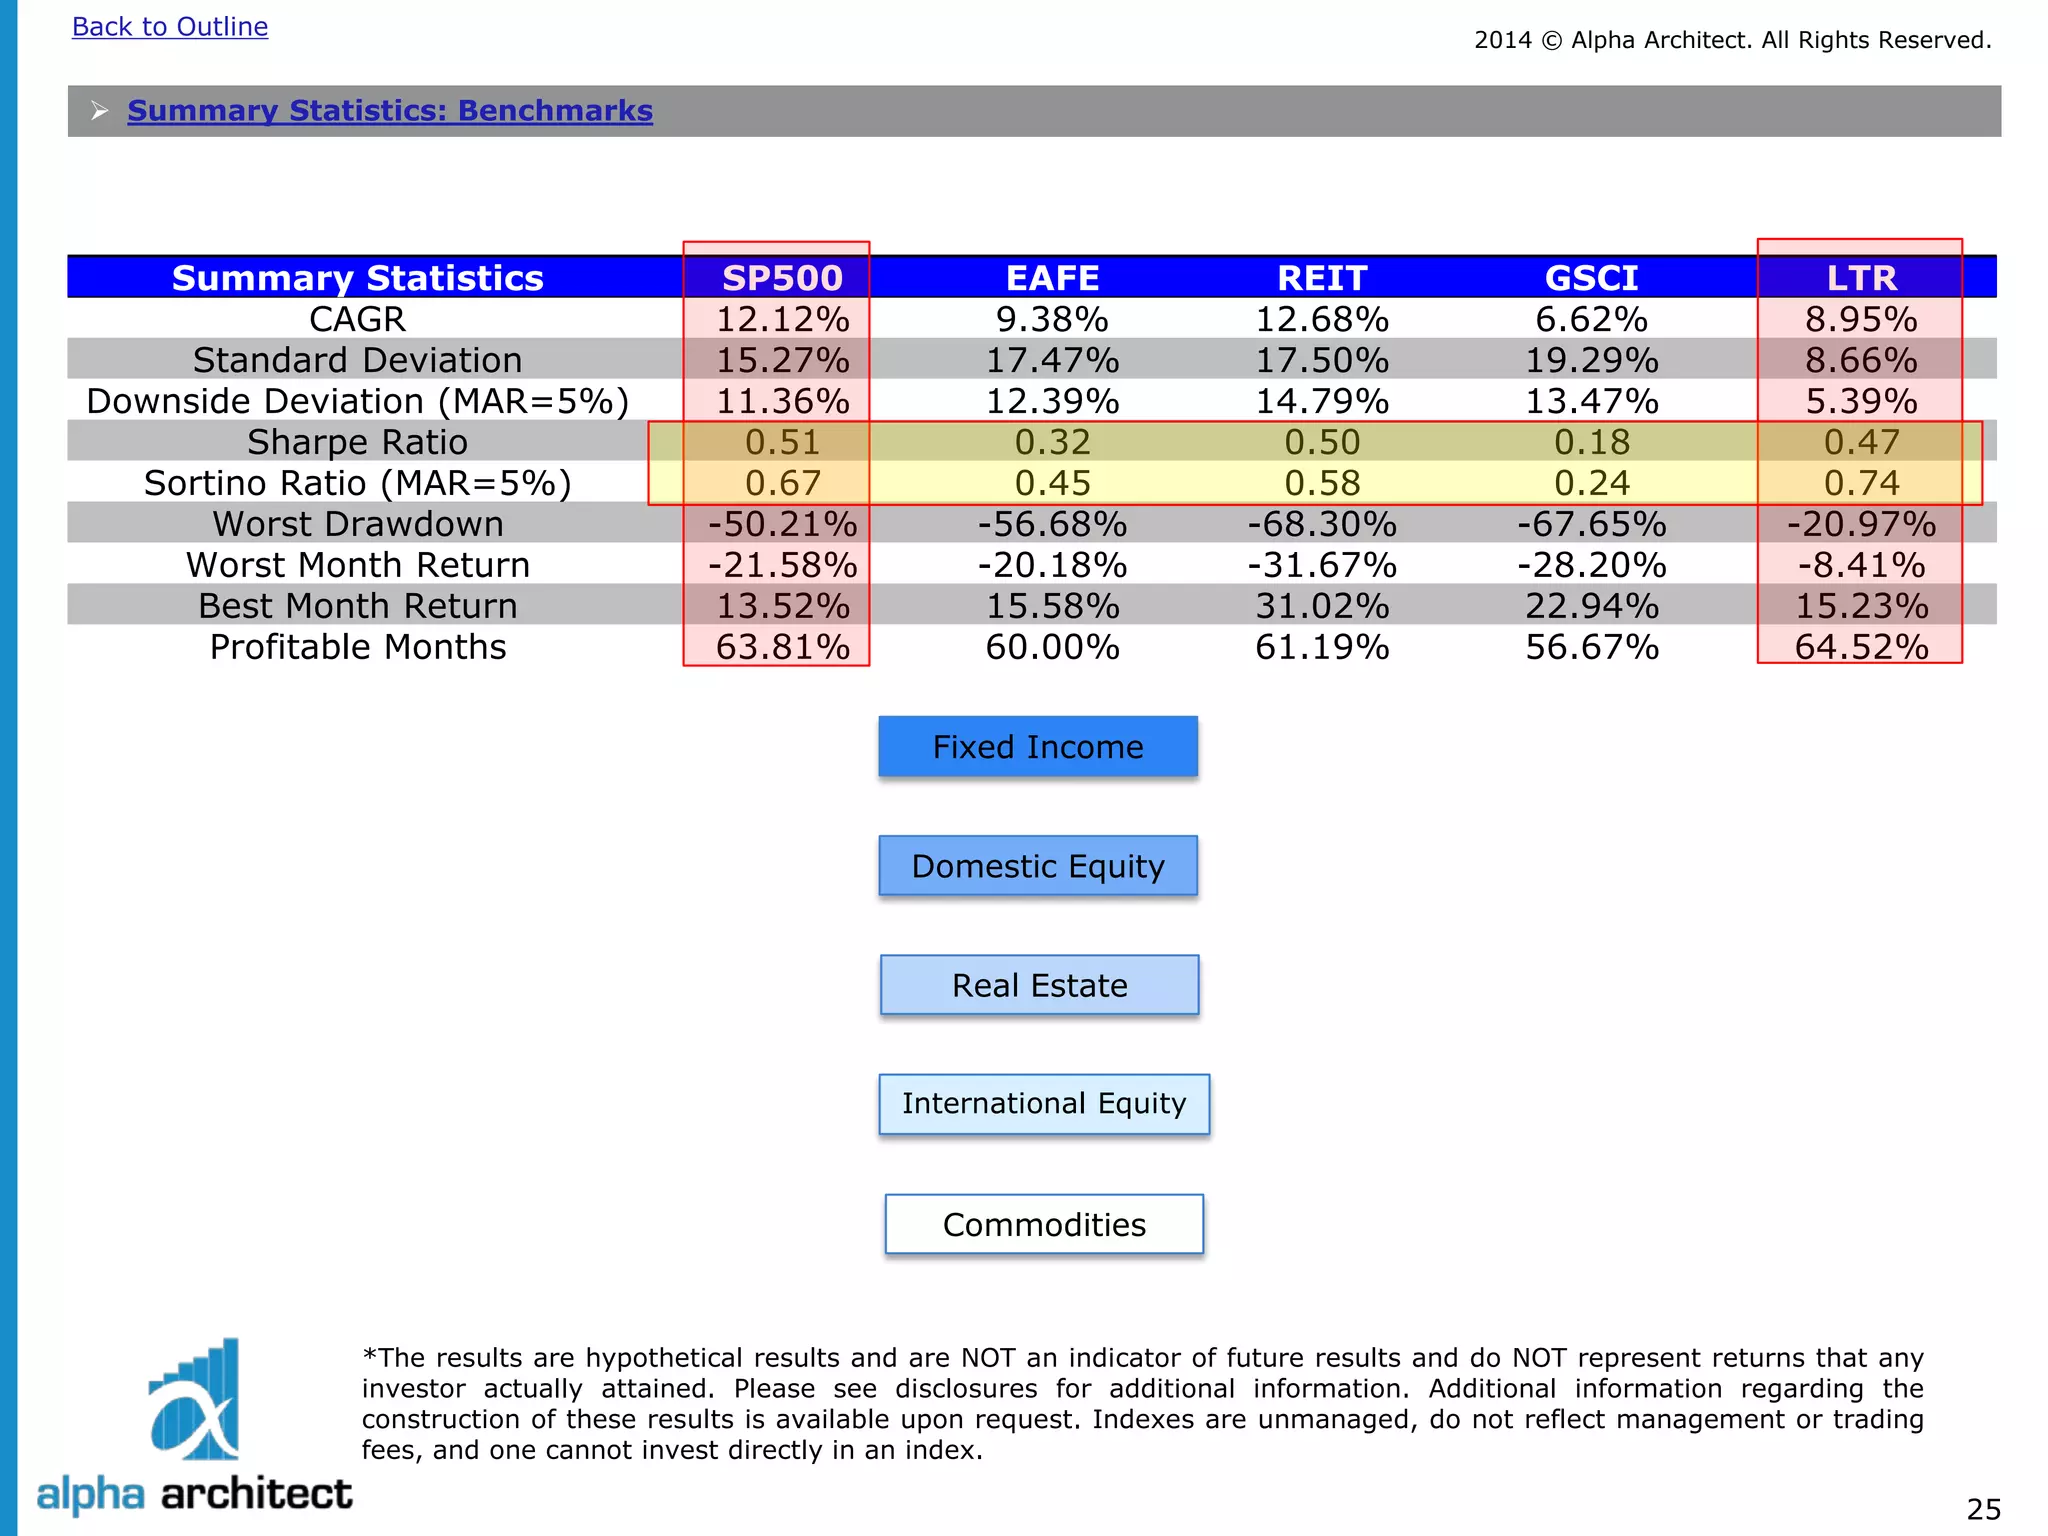
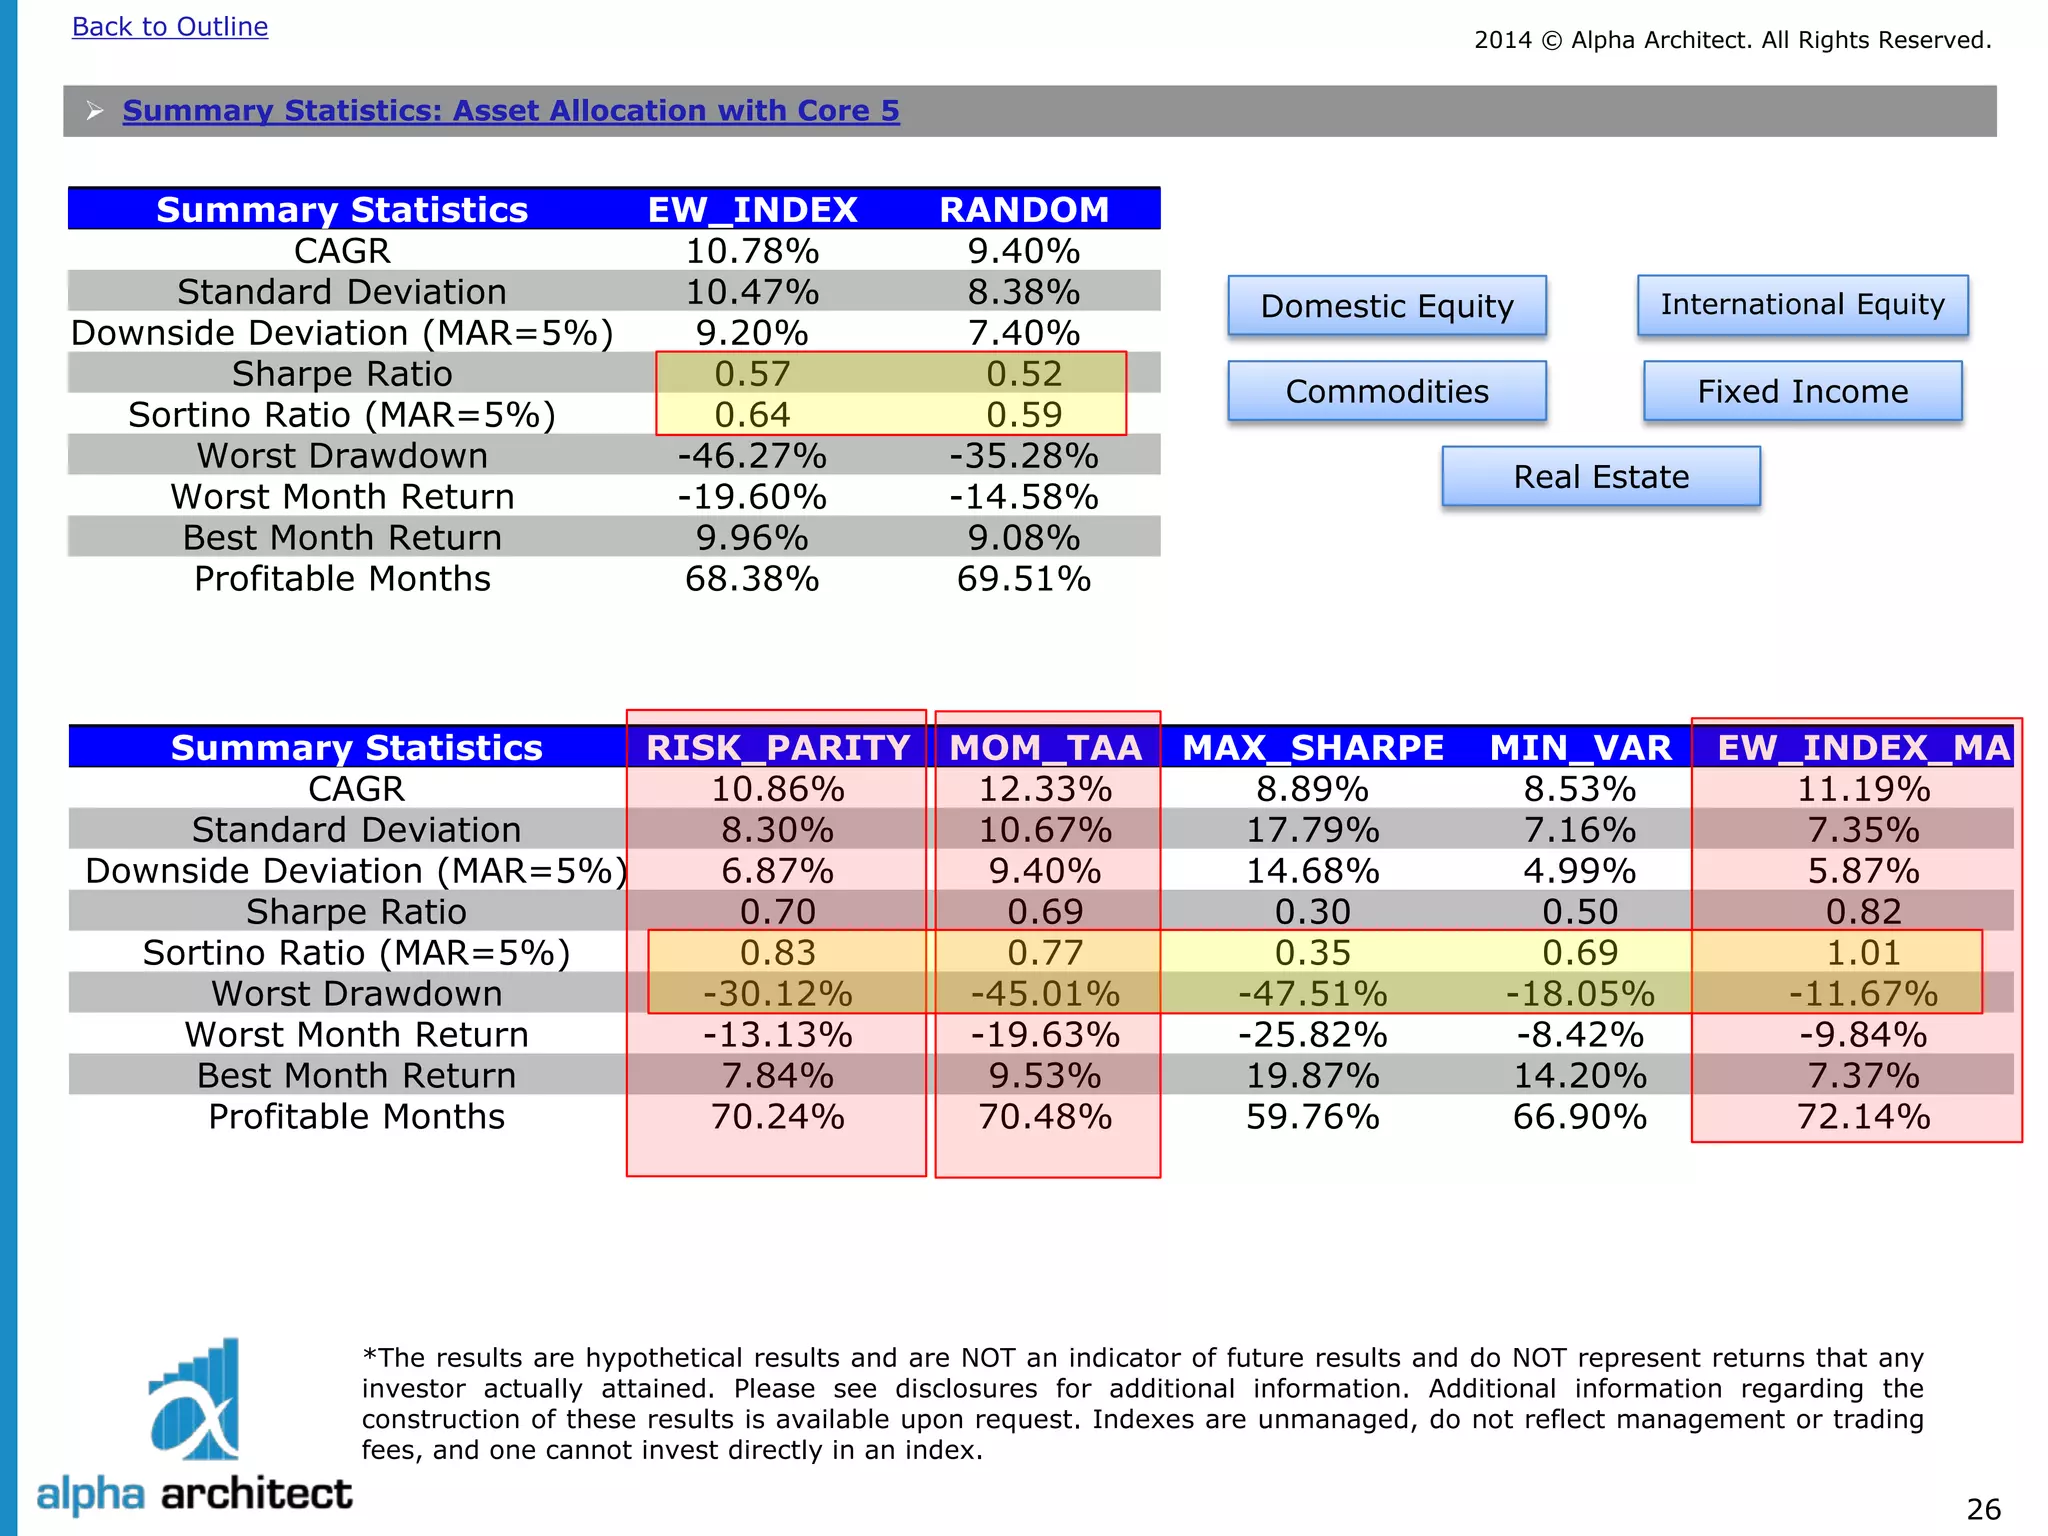
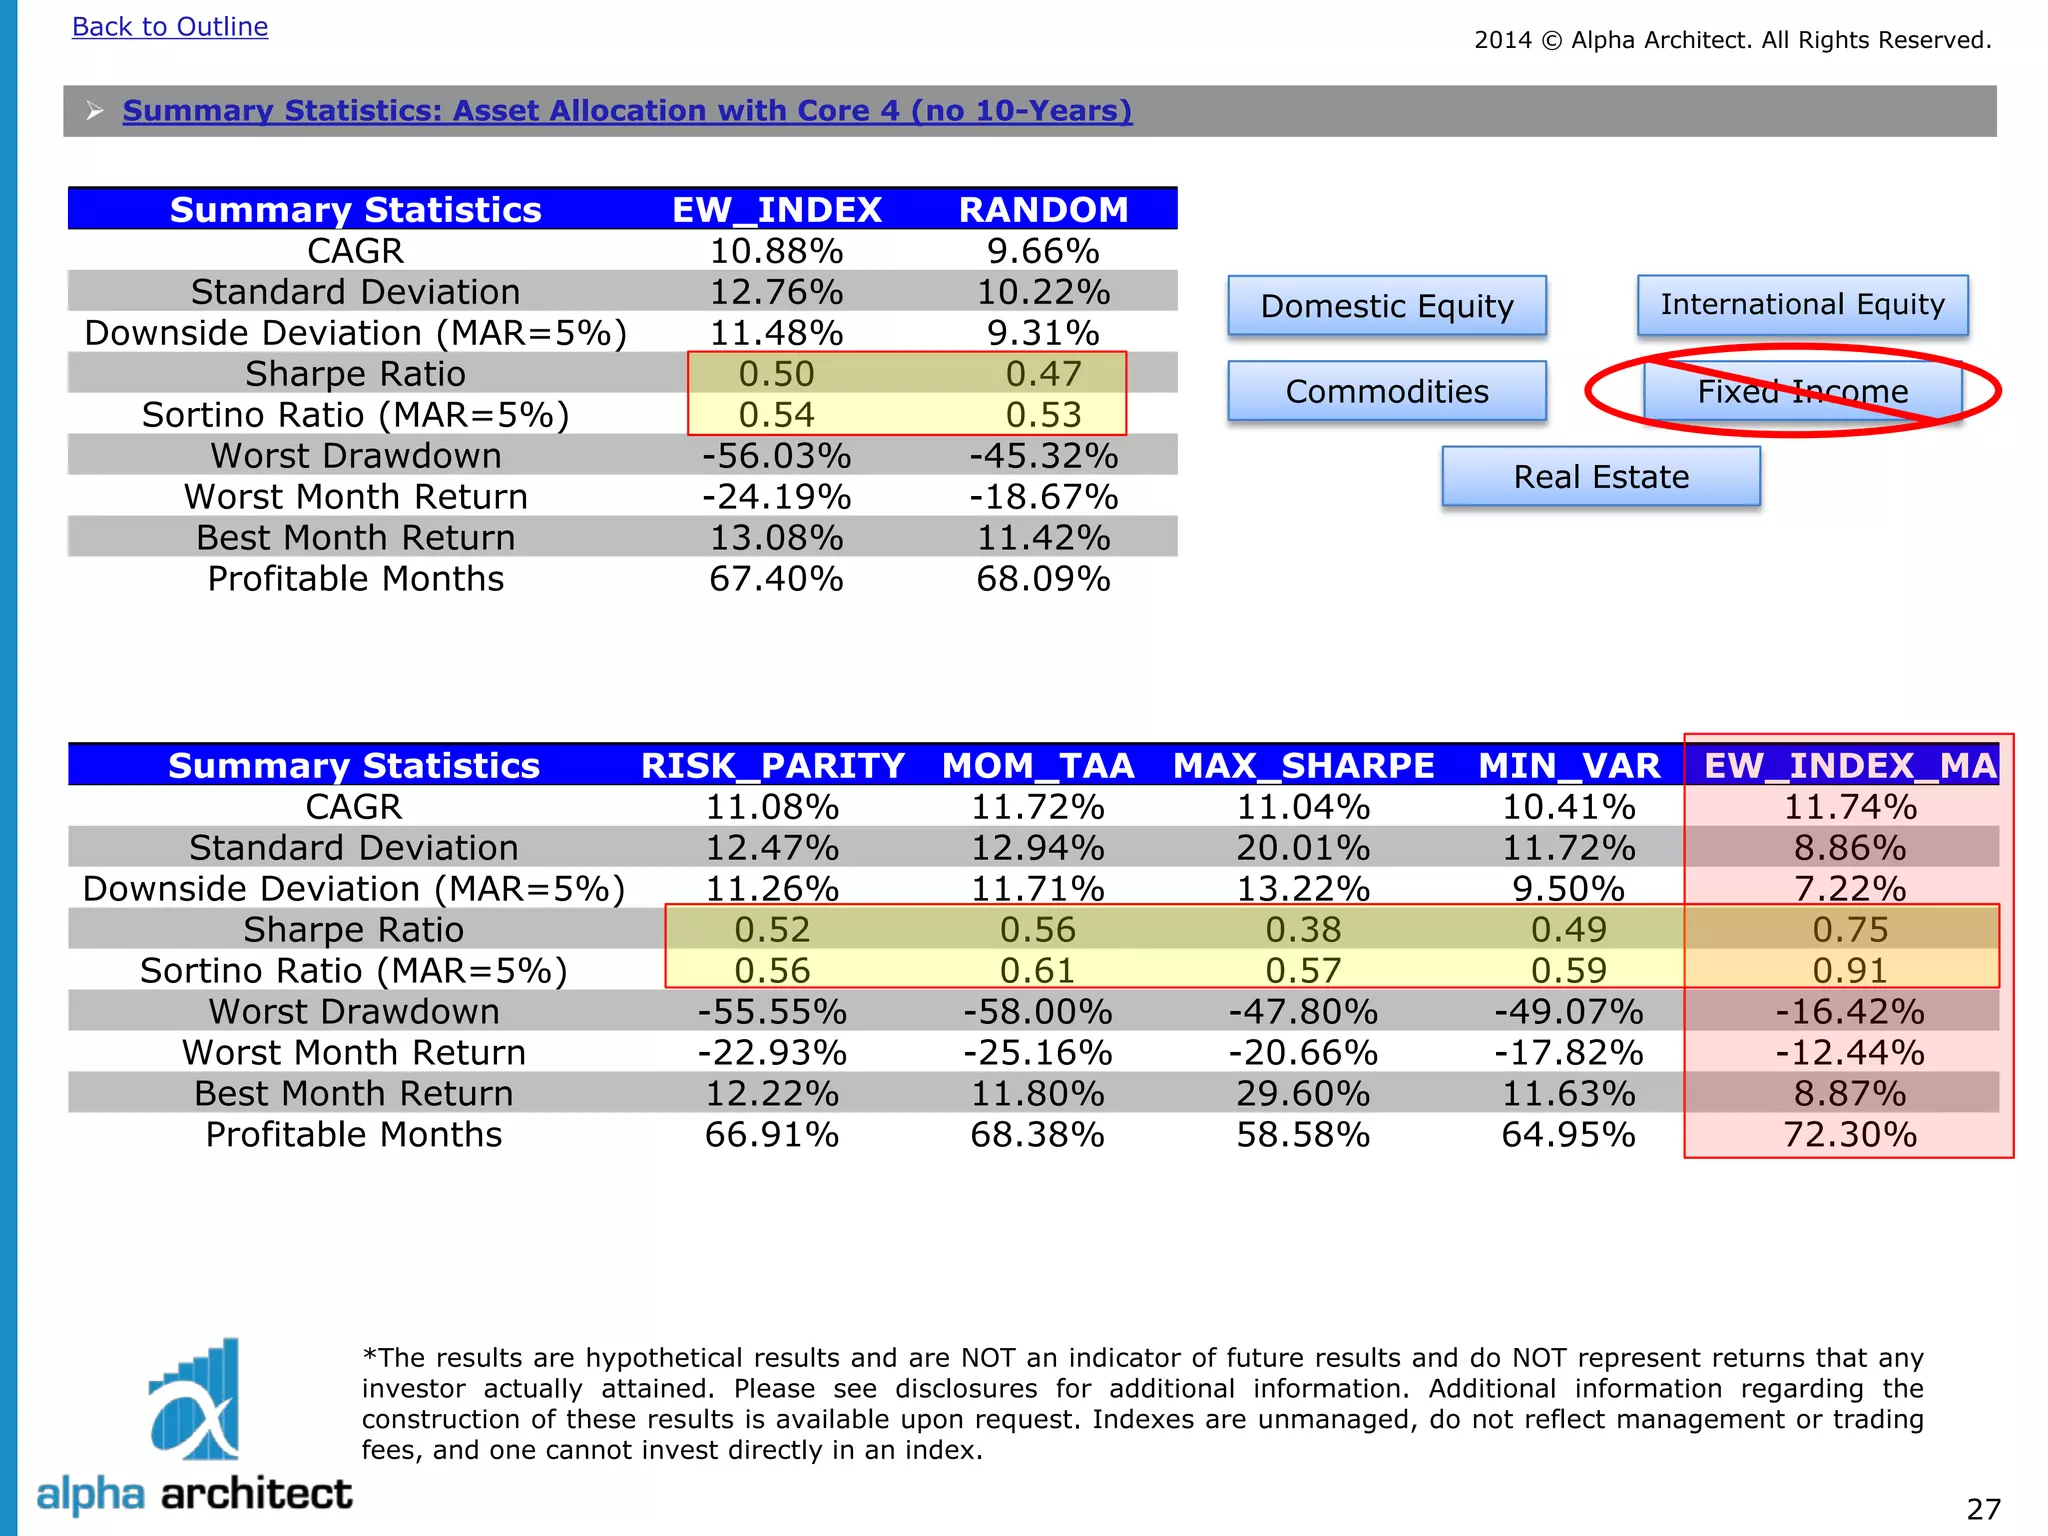
Simulated Historical Performance: 1/1/1979 to 12/31/2013
Results are gross of management fee and transaction costs for illustrative purposes only.
These are simulated performance results and do not reflect the returns an investor would actually achieve.
All returns are total returns and include the reinvestment of distributions (e.g., dividends).
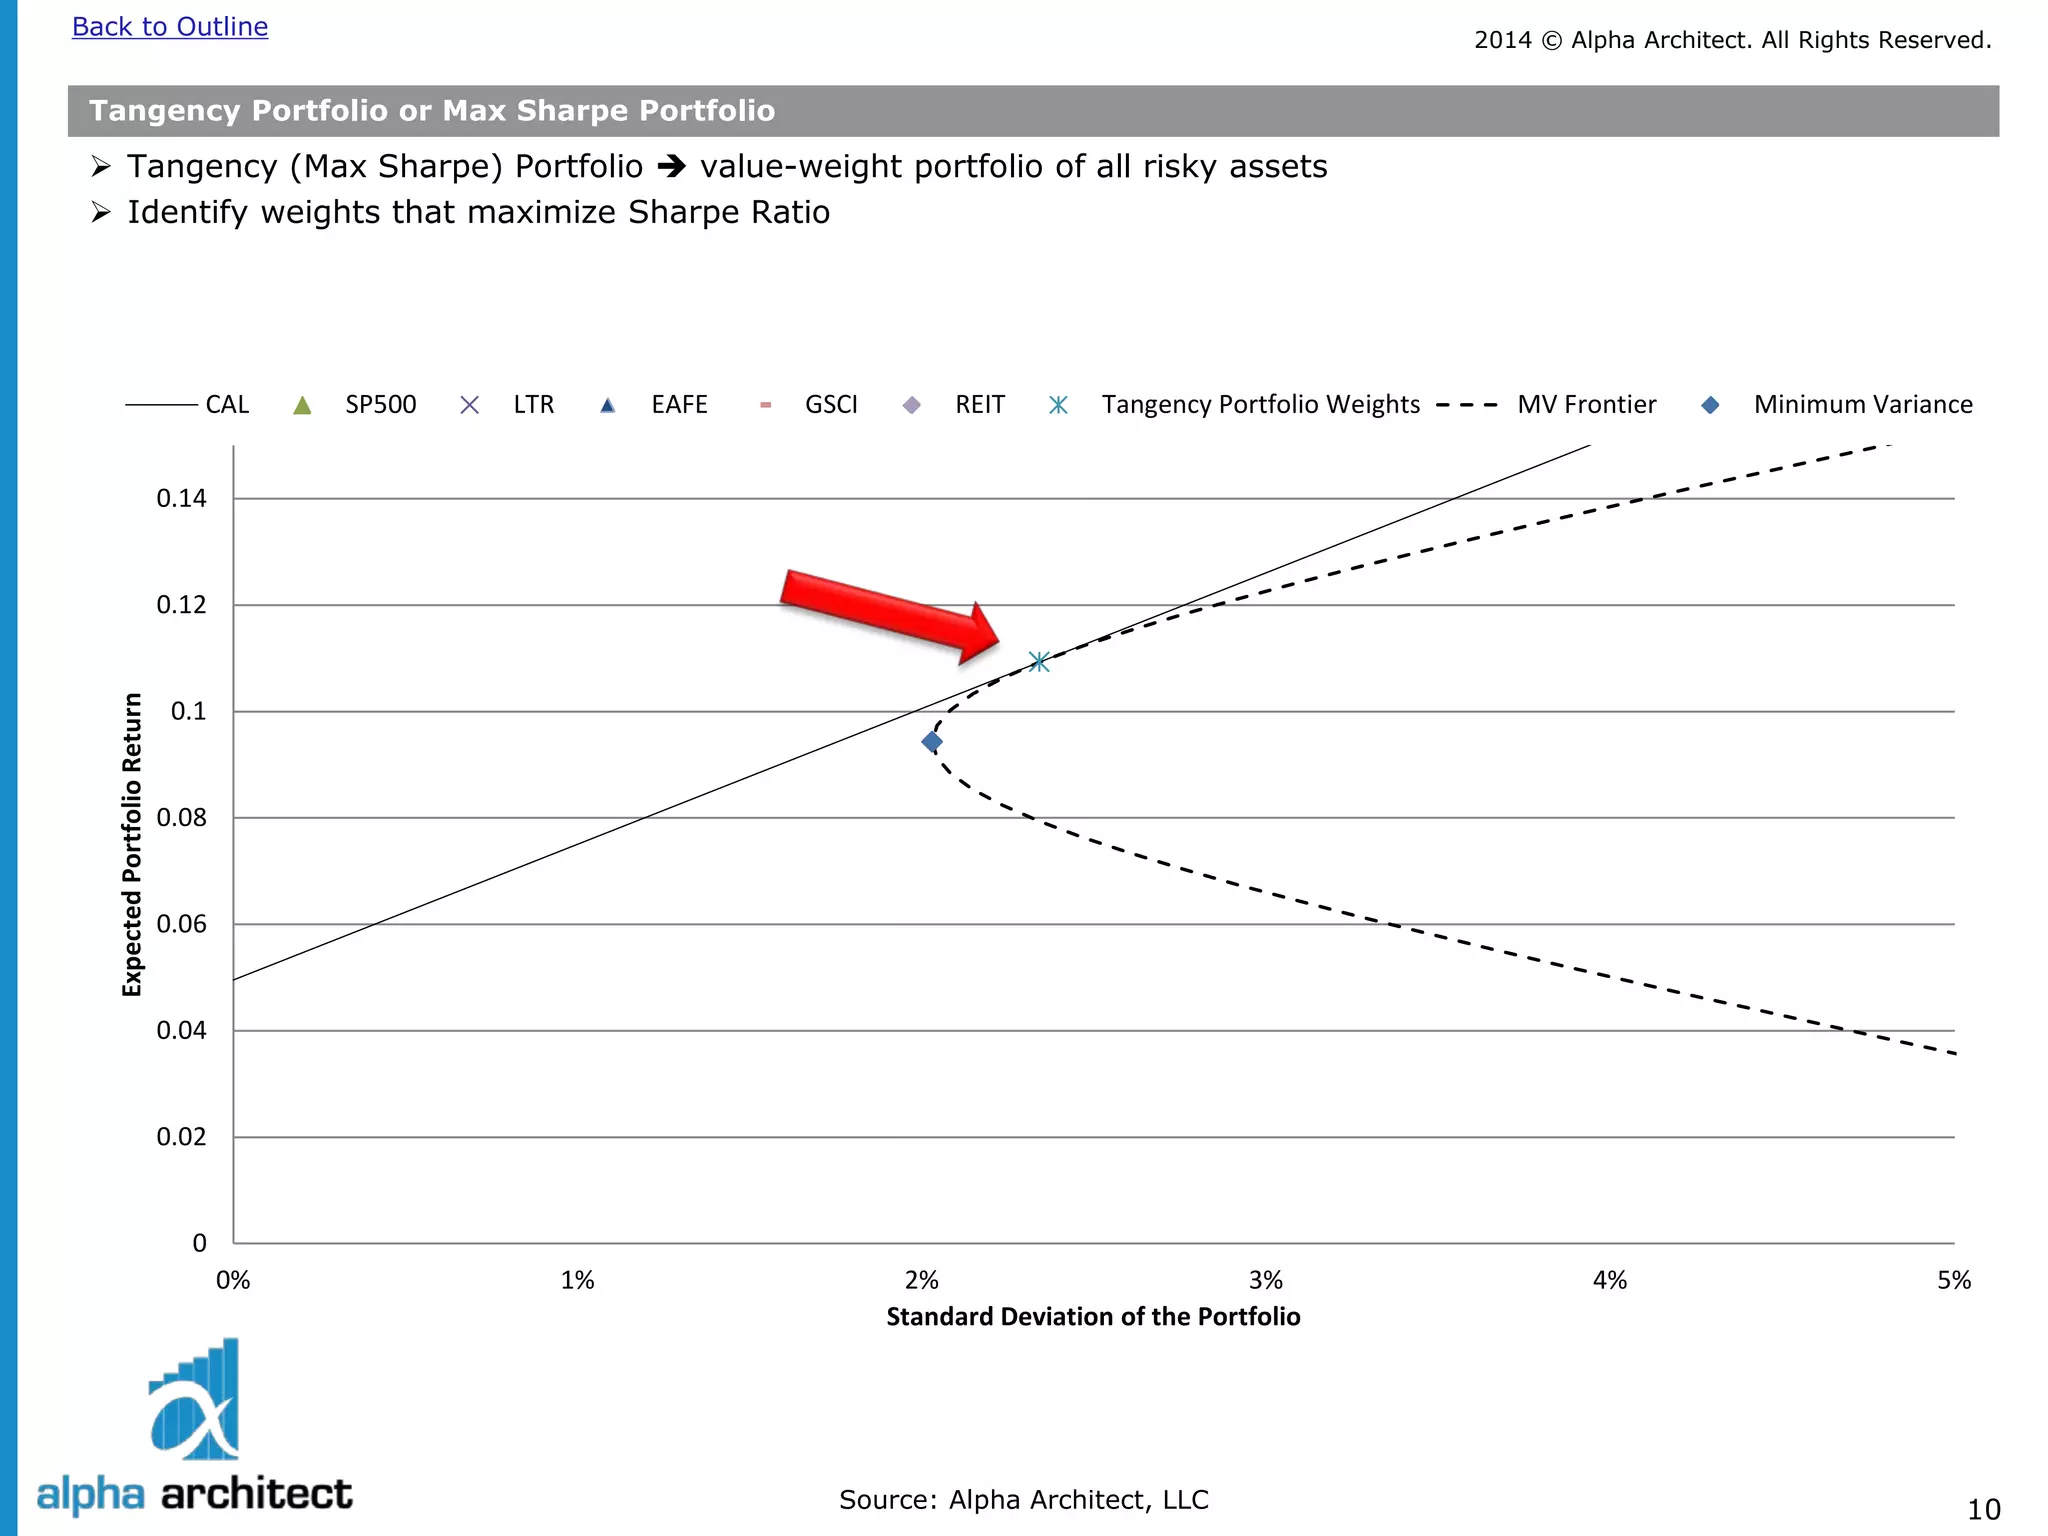
Max Sharpe weights are constrained between -1 and 1
Data is from Bloomberg and publicly available sources.
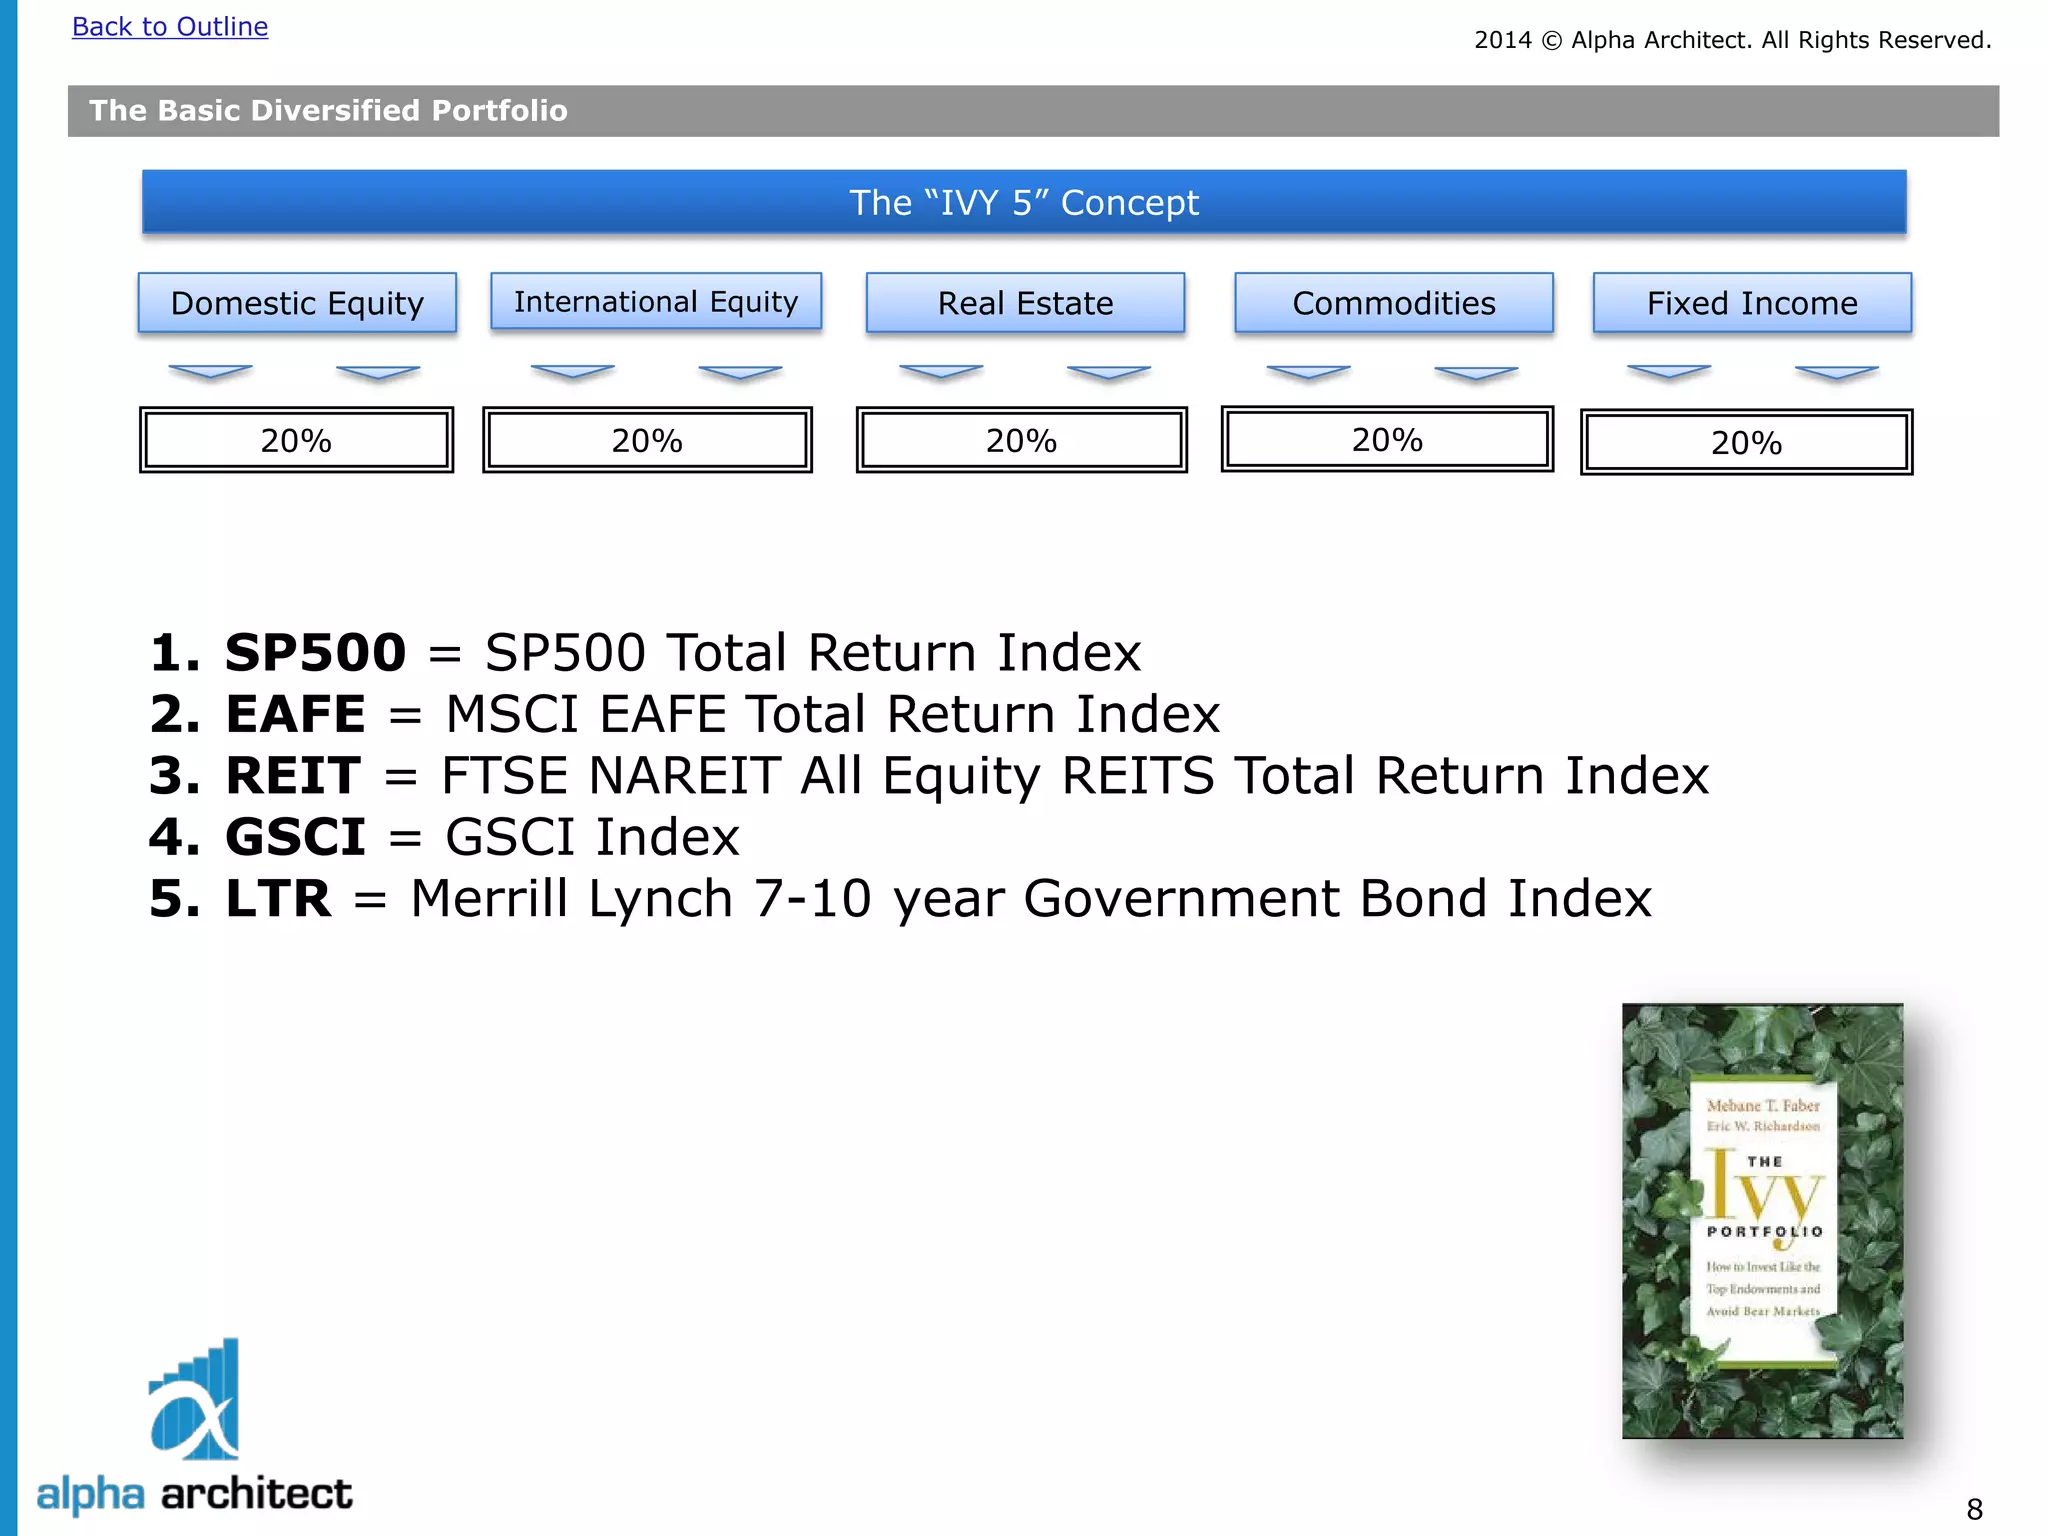
Legend
1.
SP500 = SP500 Total Return Index
2.
EAFE = MSCI EAFE Total Return Index
3.
REIT = FTSE NAREIT All Equity REITS Total Return Index
4.
GSCI = GSCI Index
5.
LTR = Merrill Lynch 7-10 year Government Bond Index (prior to 6/1982, Amit Goyal Data)
6.
RISK_PARITY = Risk parity on core 5 asset classes, 3-yr rolling windows
7.
MOM_TAA = Momentum on core 5 asset classes, 12-month momentum,
8.
MAX_SHARPE= Tangency portfolio weights on core 5 asset classes, 3-yr rolling windows (weights constrained [-1,1])
9.
MIN_VAR= Minimum variance portfolio weights on core 5 asset classes, 3-yr rolling windows
10.
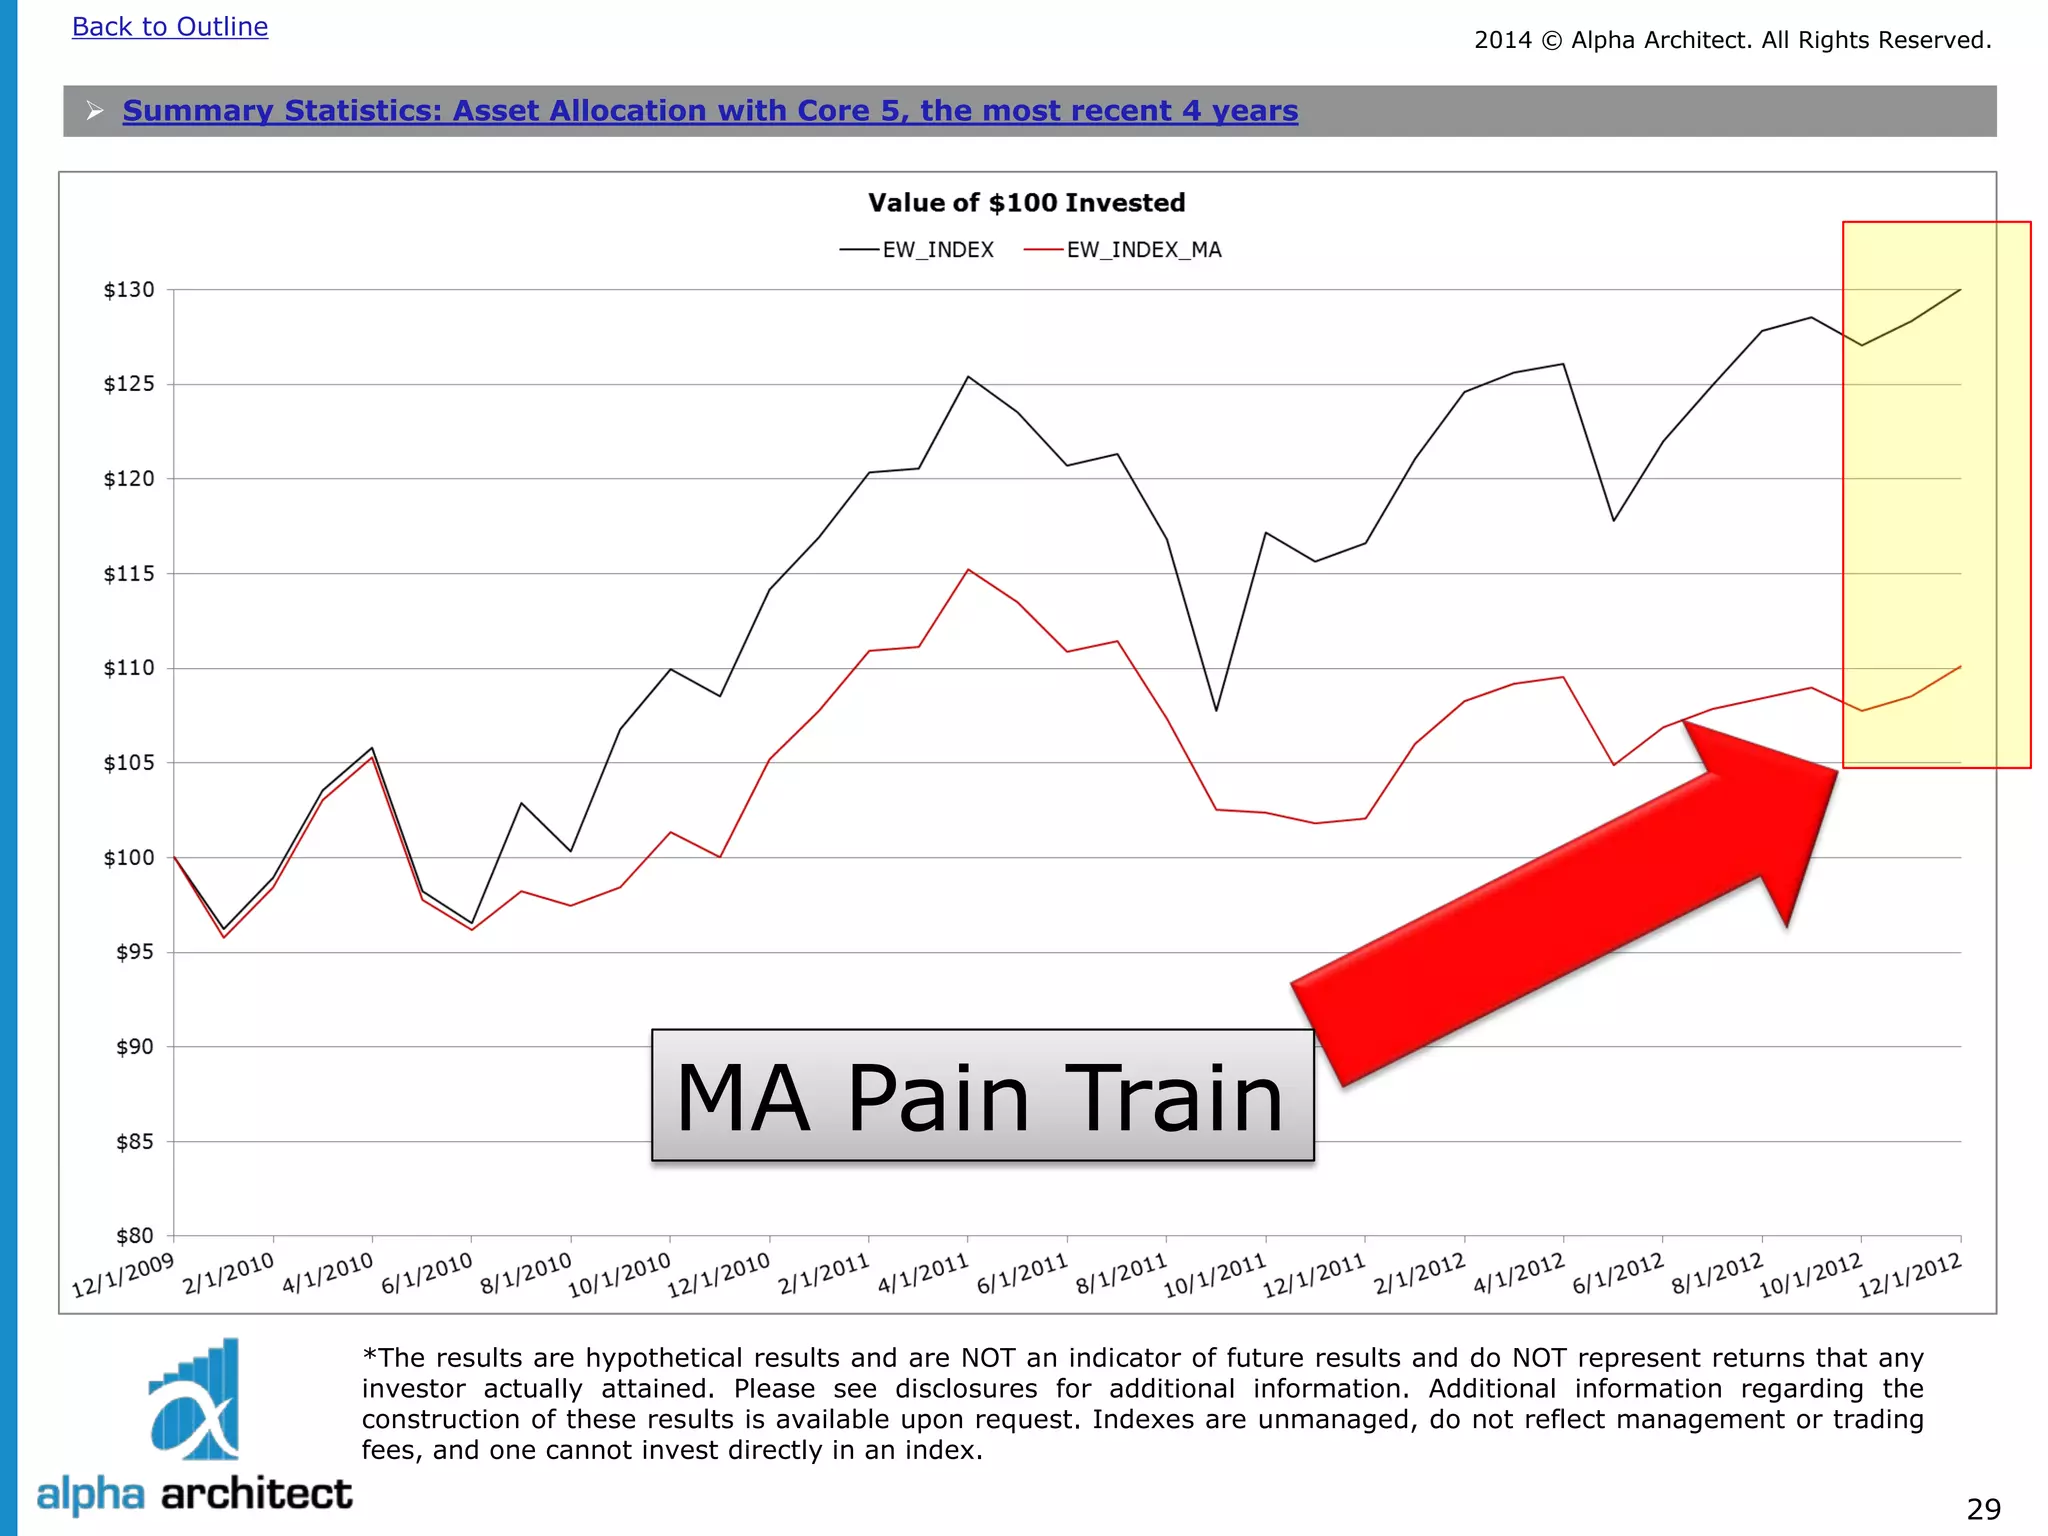
EW_INDEX = Equal-weight, monthly rebalanced across core 5 asset classes
11.
EW_INDEX_MA = Equal-weight, monthly rebalanced across core 5 asset classes, with 12-month moving average rule
12.
RANDOM = ¼ random chance of moving to risk-free rate, monthly rebalanced across core 5 asset classes
Hypothetical performance results have many inherent limitations, some of which, but not all, are described in the disclosures at the end of this document. No representation is being made that any fund or account will or is likely to achieve profits or losses similar to those shown herein. In fact, there are frequently sharp differences between hypothetical performance results and the actual results subsequently realized by any particular trading program.
Indexes are unmanaged, do not reflect management or trading fees, and one cannot invest directly in an index.
Please see the disclosures at the end of this document for additional information.
Source: Alpha Architect, LLC](https://image.slidesharecdn.com/qowopkjcqem5zyuptbbr-signature-84ec022d29aa7e3deb56110570f86814155597db3dc6272a6c6aef7ec8227eed-poli-140923161423-phpapp01/75/Asset-allocation-facts_and_fiction_v03-23-2048.jpg)


The document discusses tactical asset allocation, emphasizing definitions, performance techniques, and the impact of complexity on investment outcomes. It provides insights into portfolios using various strategies like risk parity and momentum, and highlights the historical performance of different asset classes. Additionally, it presents a caution against relying solely on models due to inherent estimation errors in diversification strategies.