Download to read offline

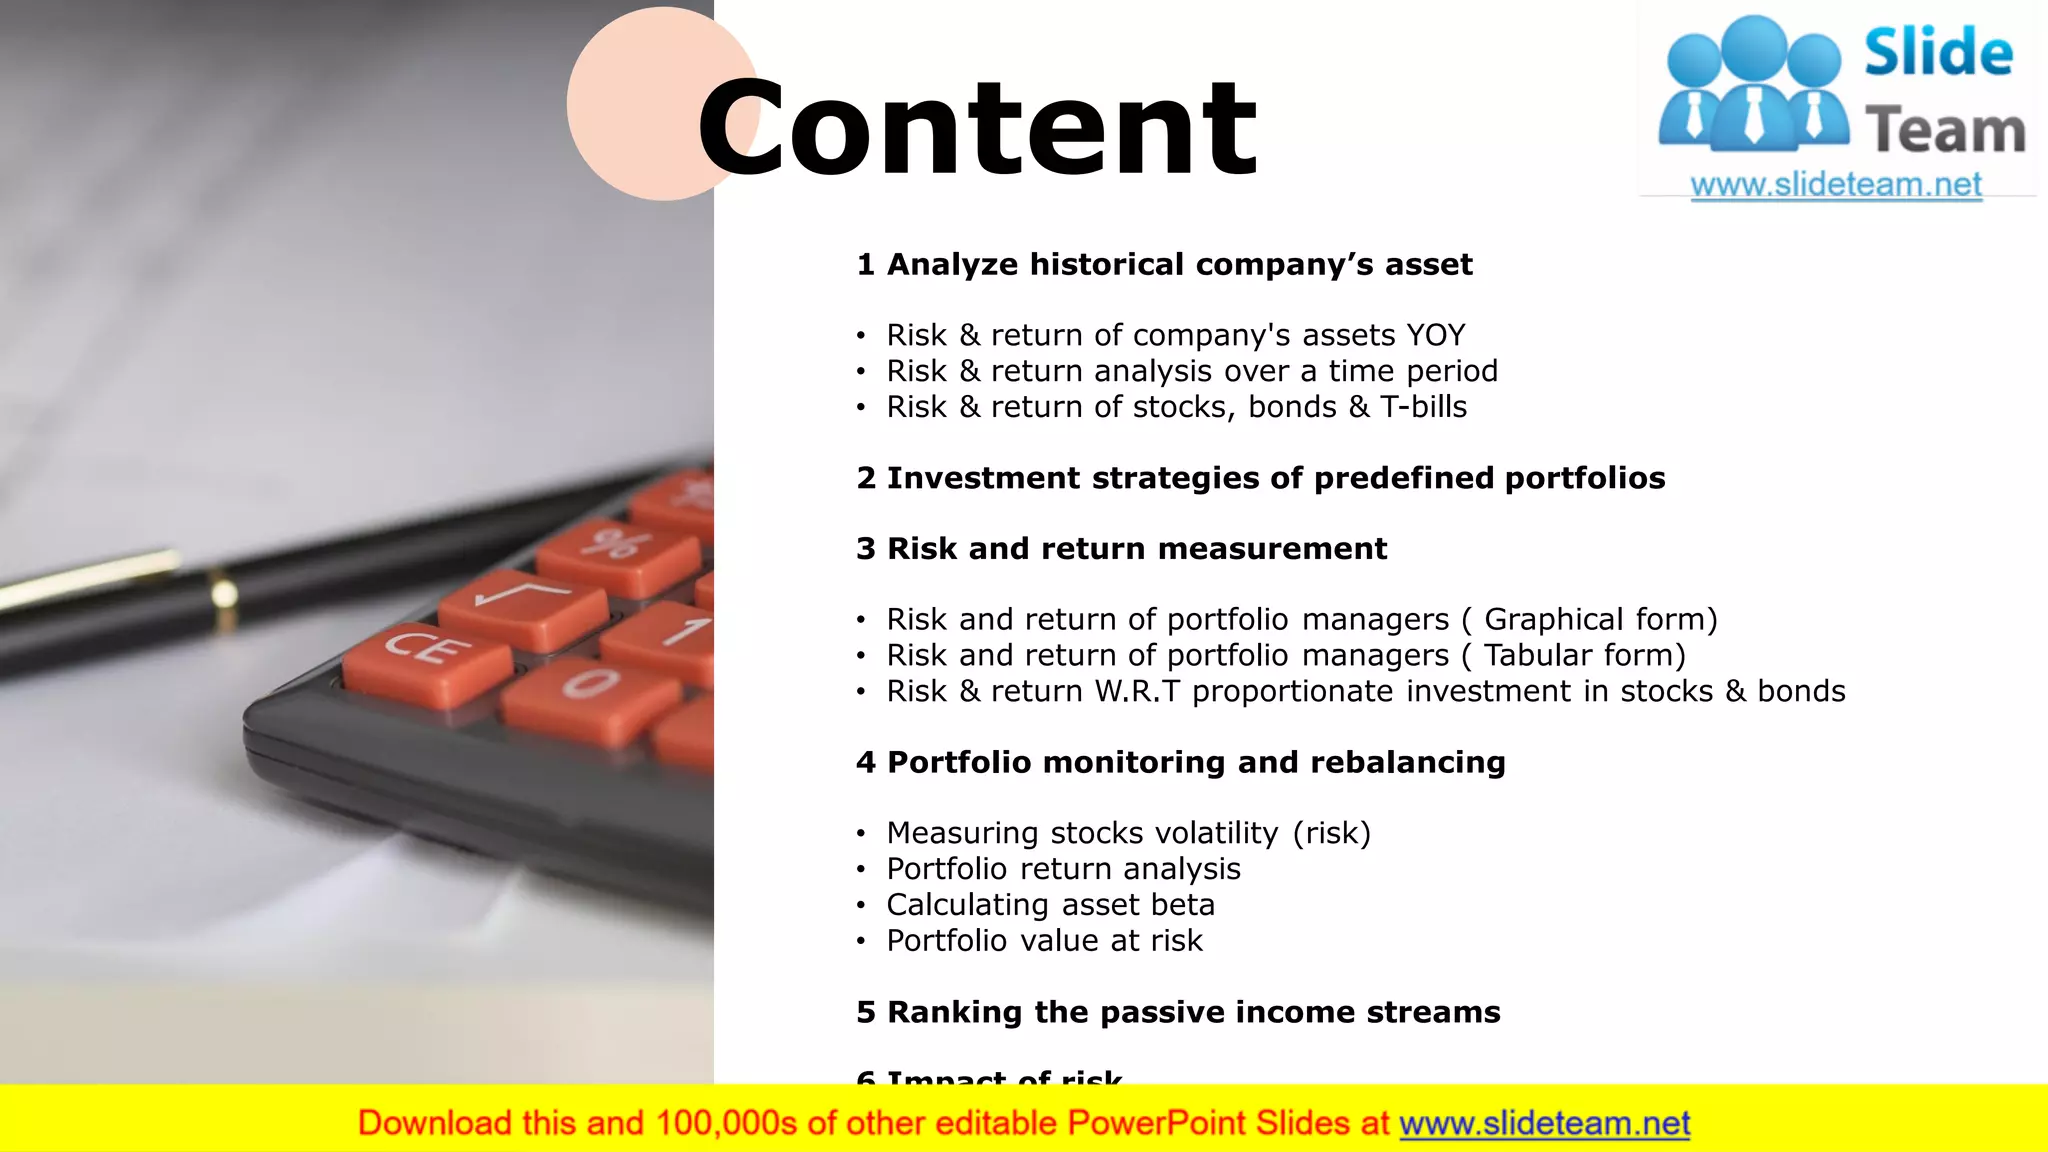
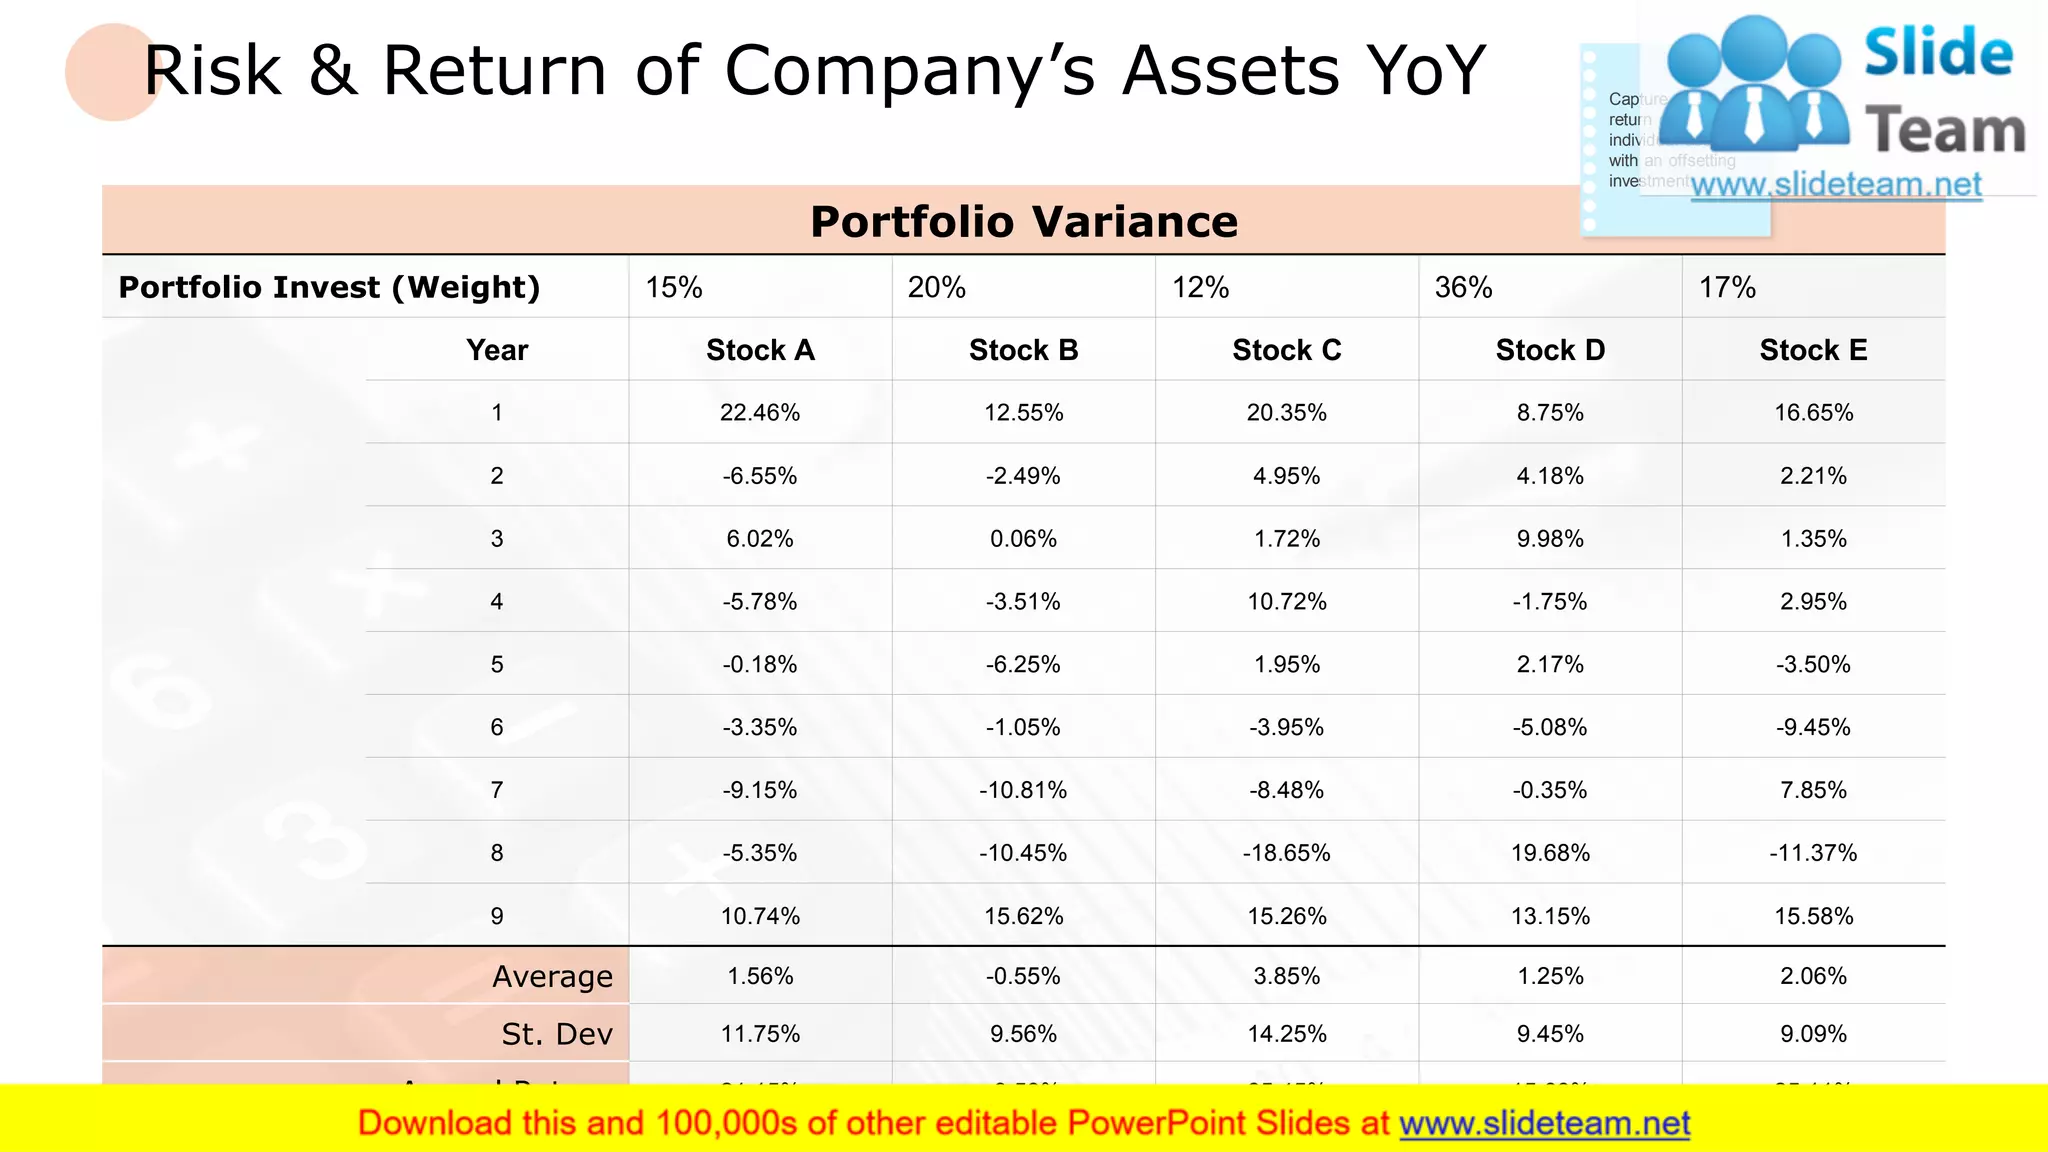
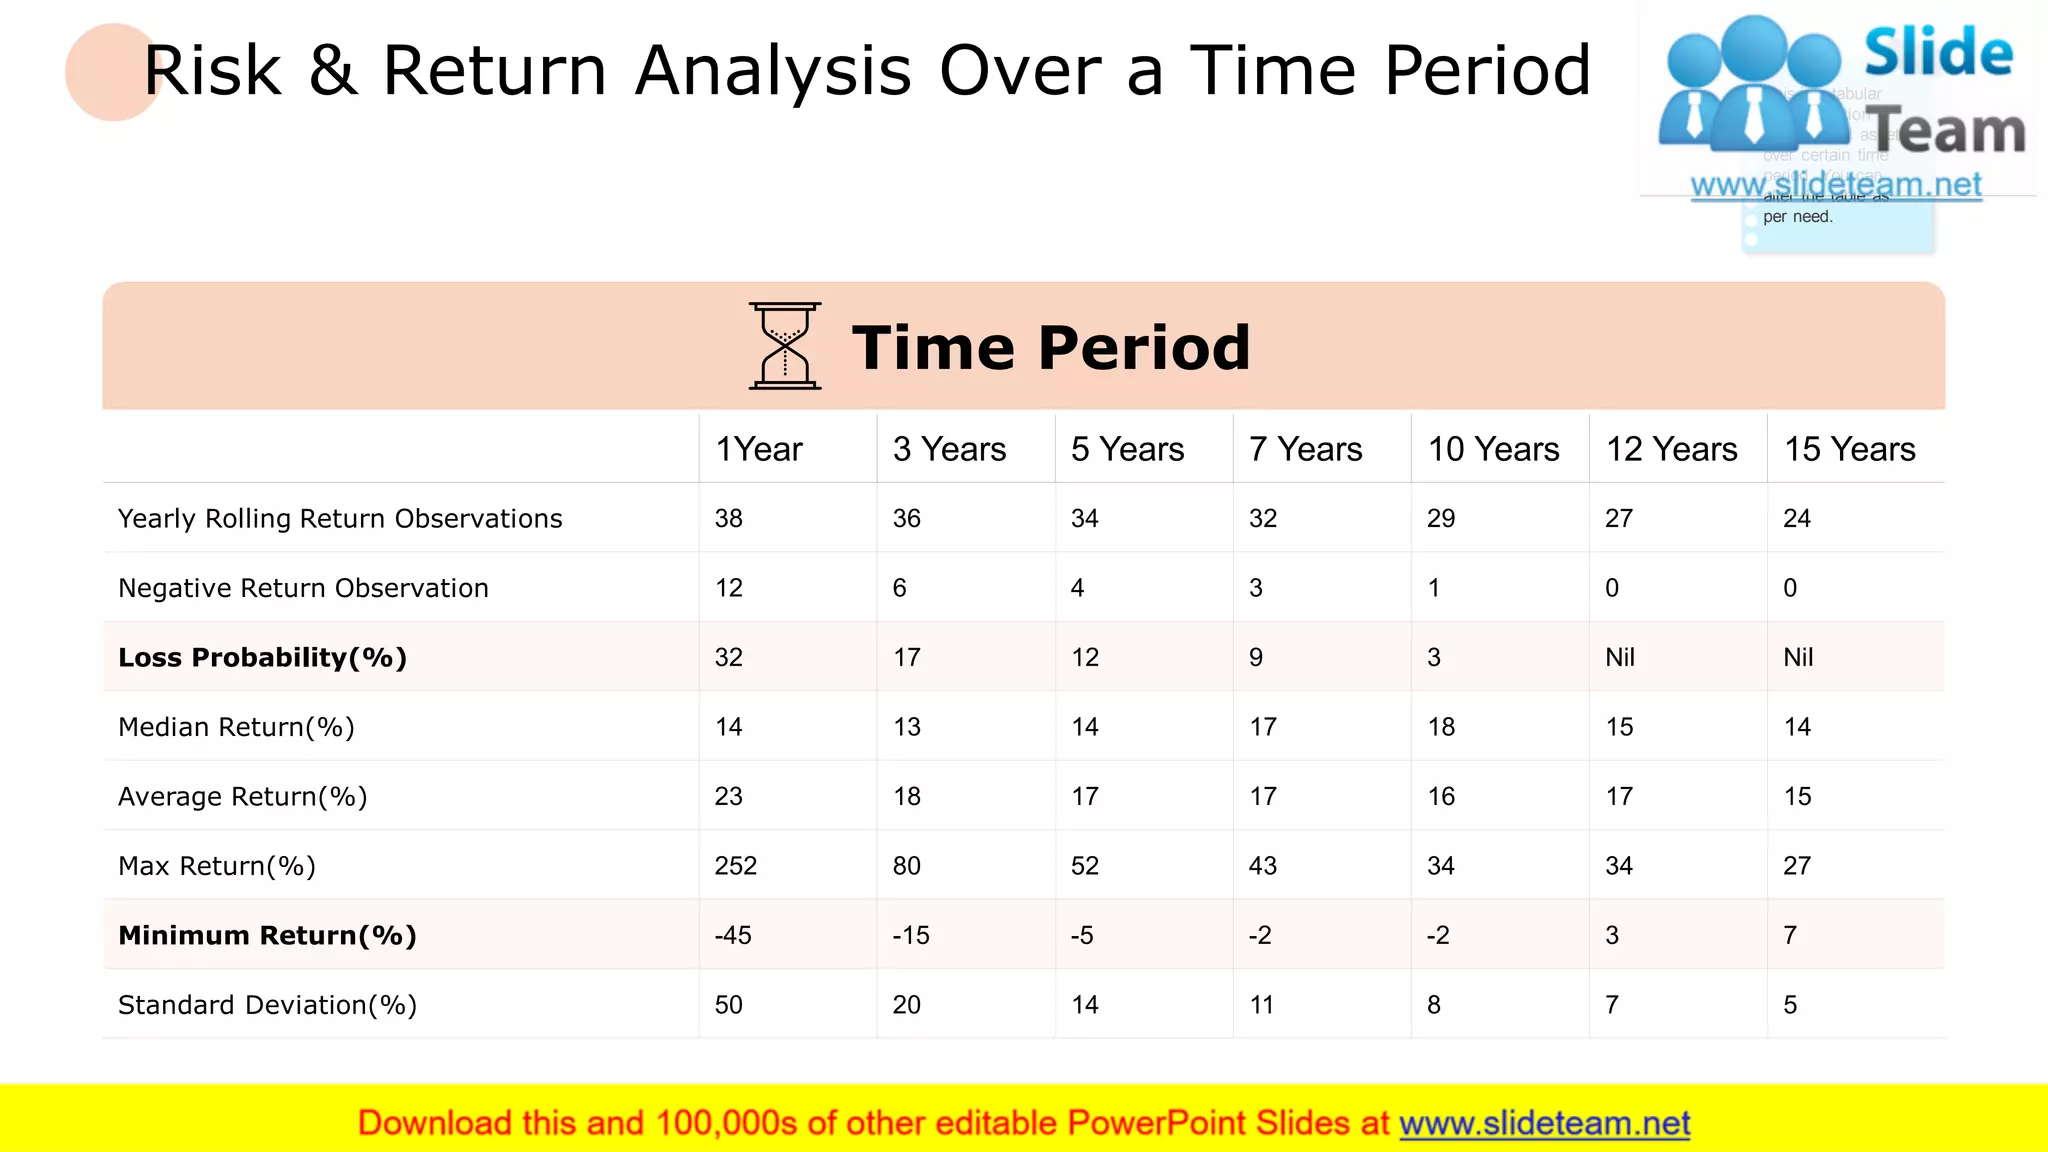
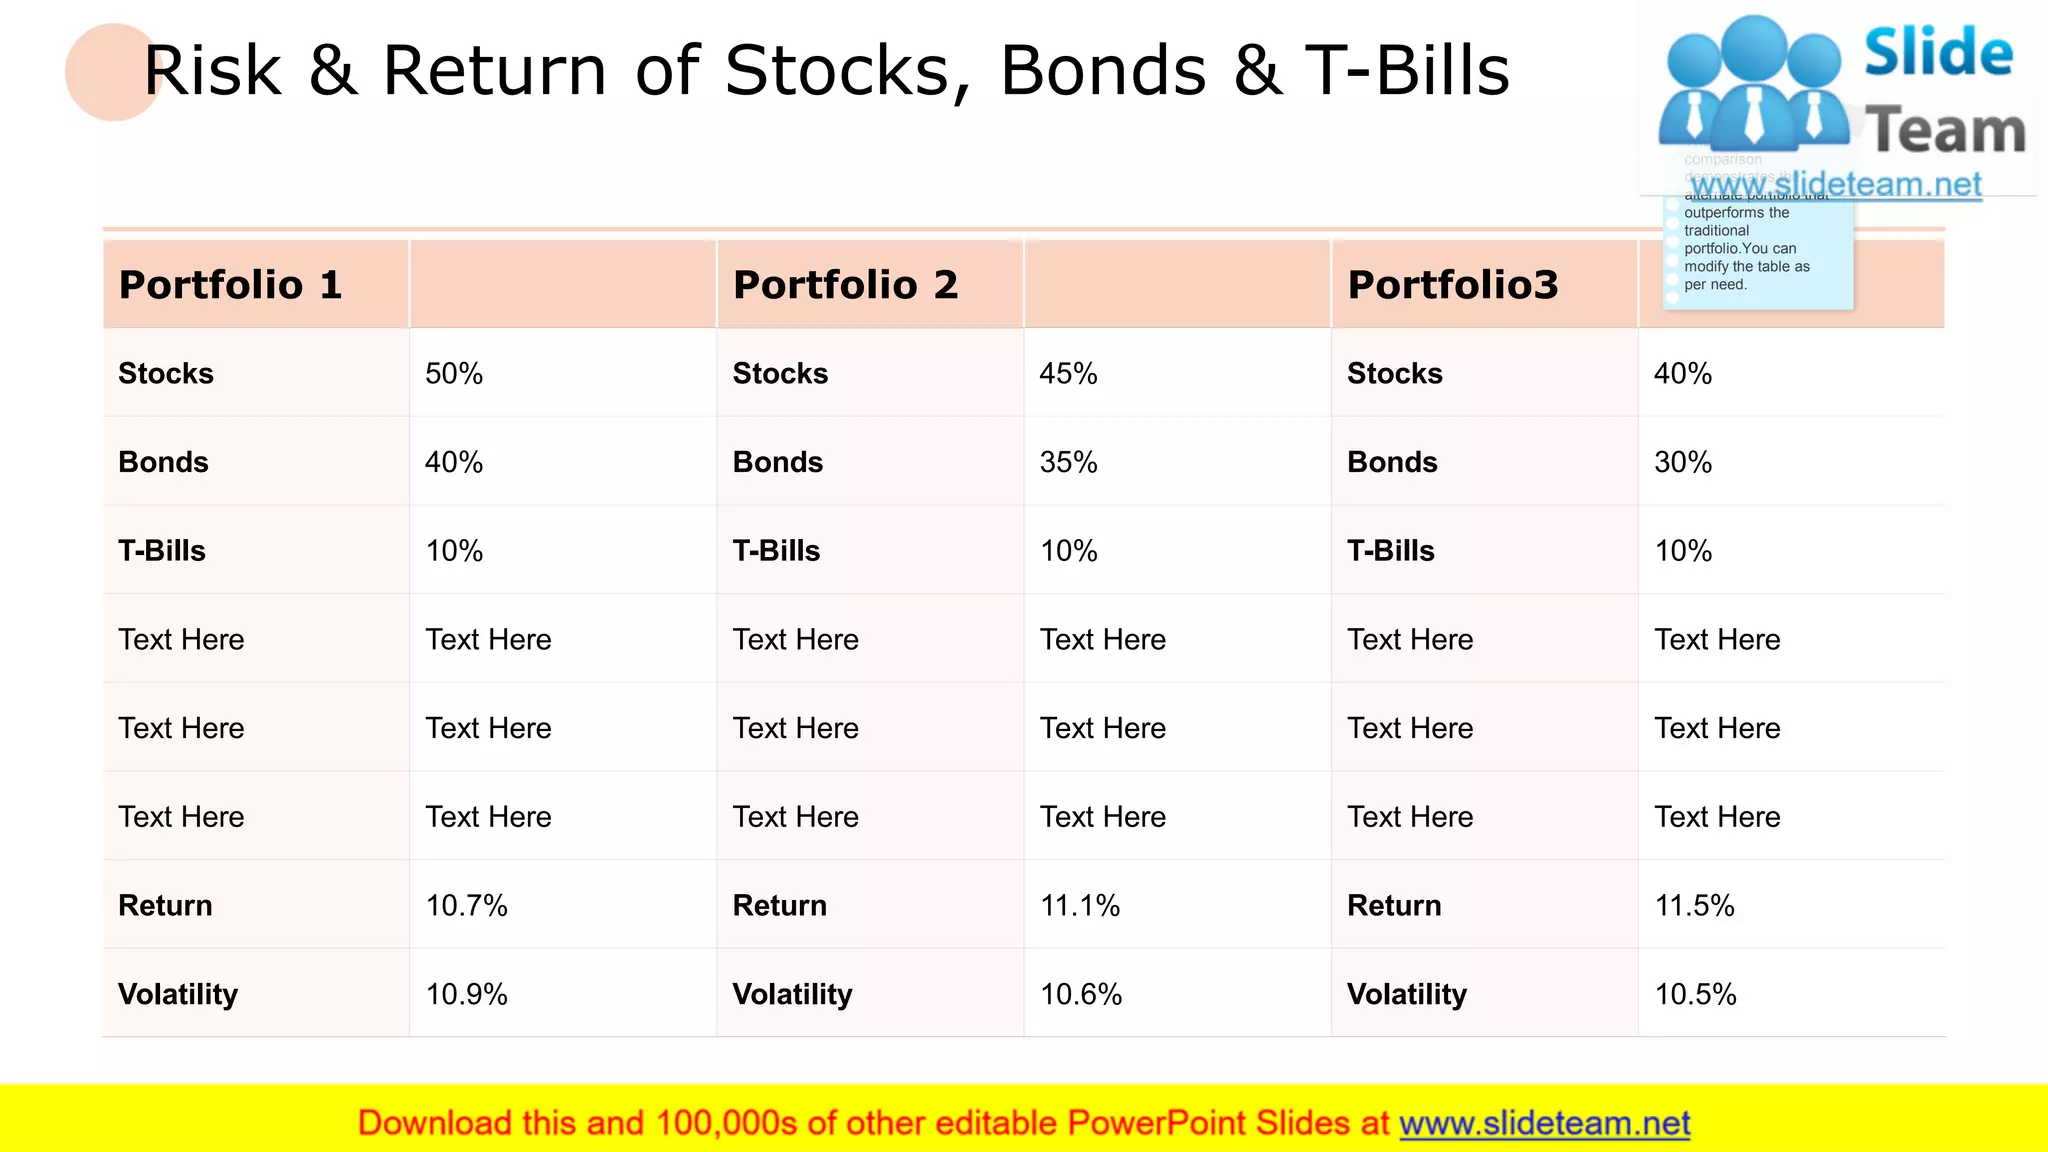
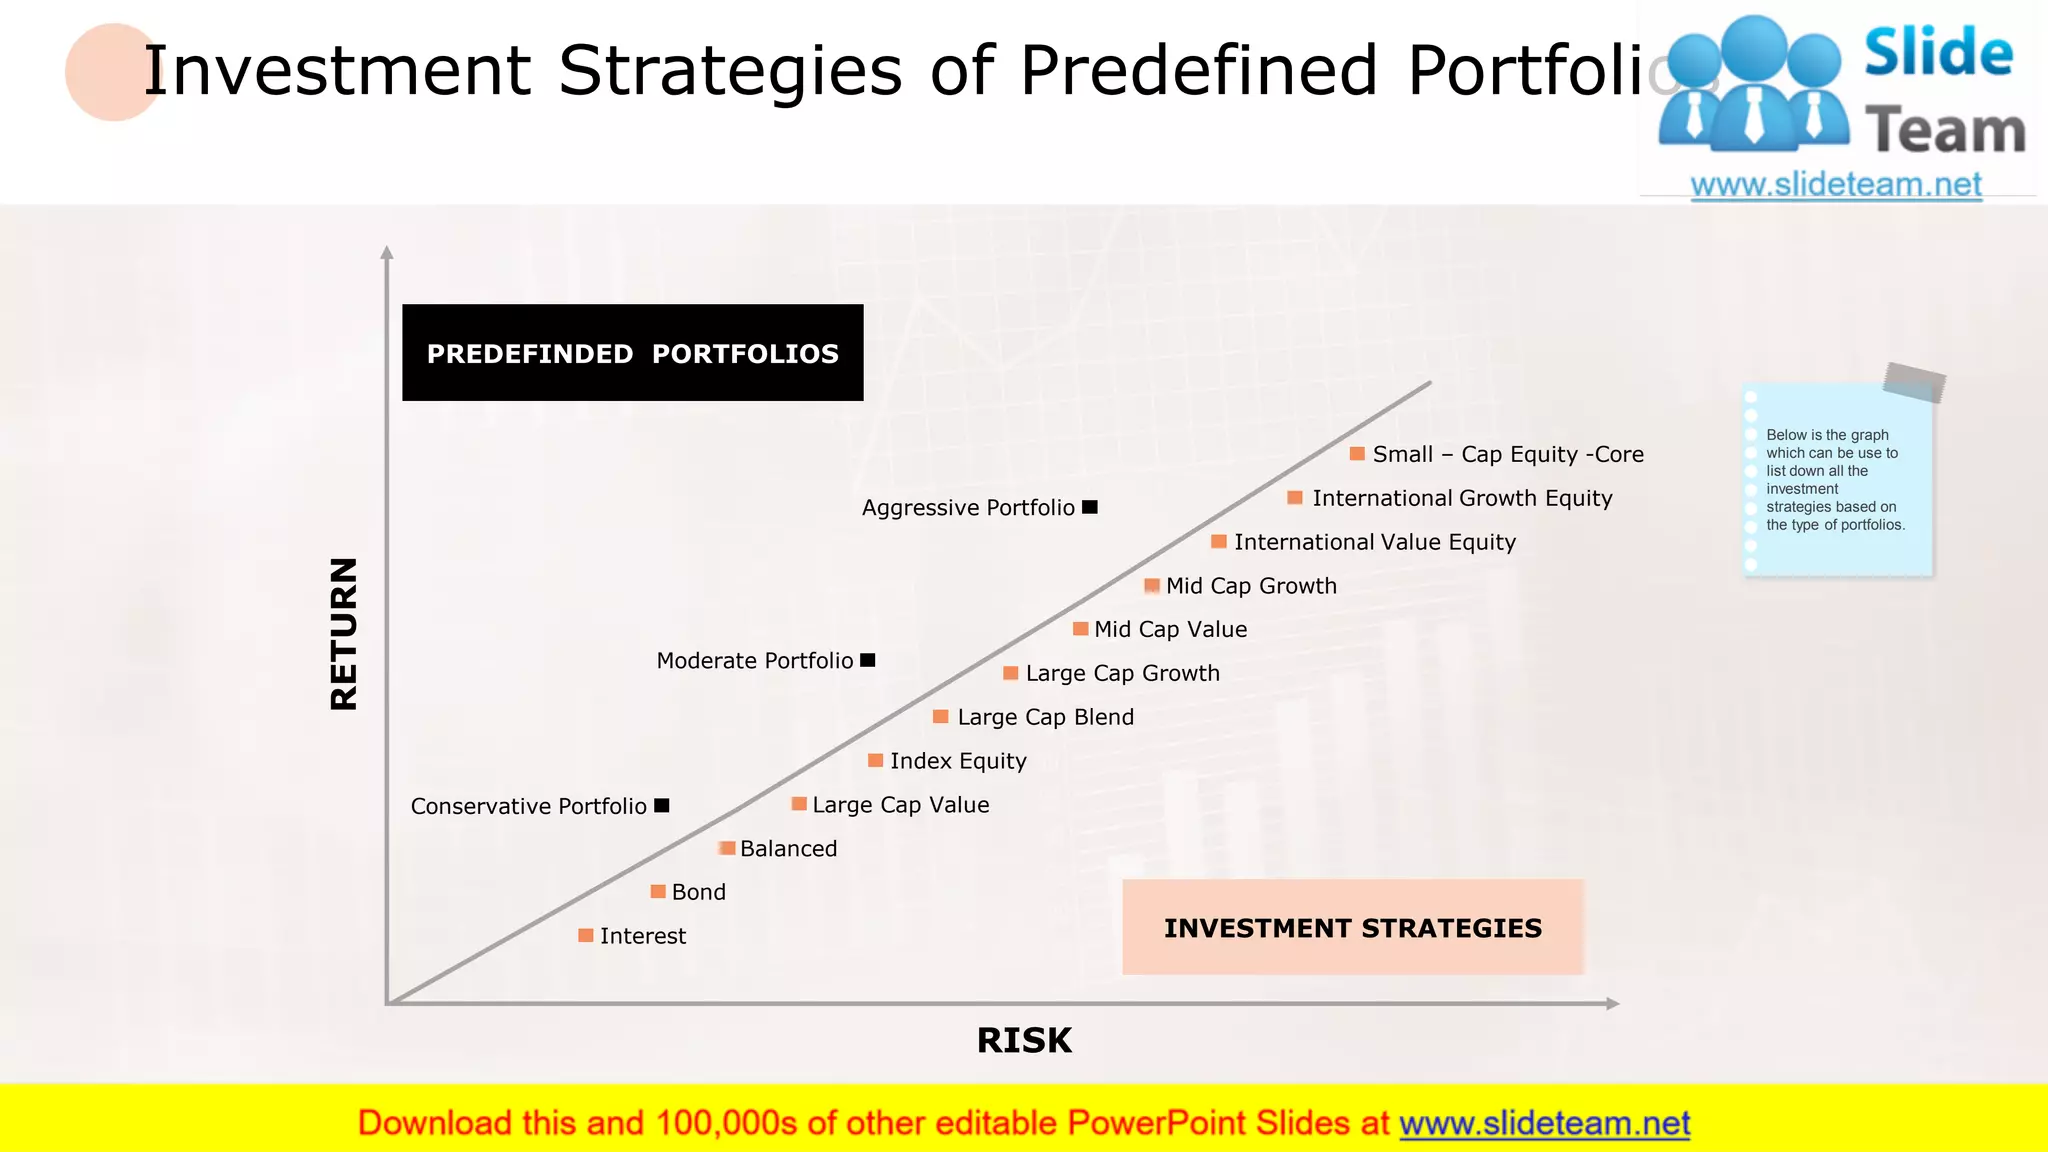
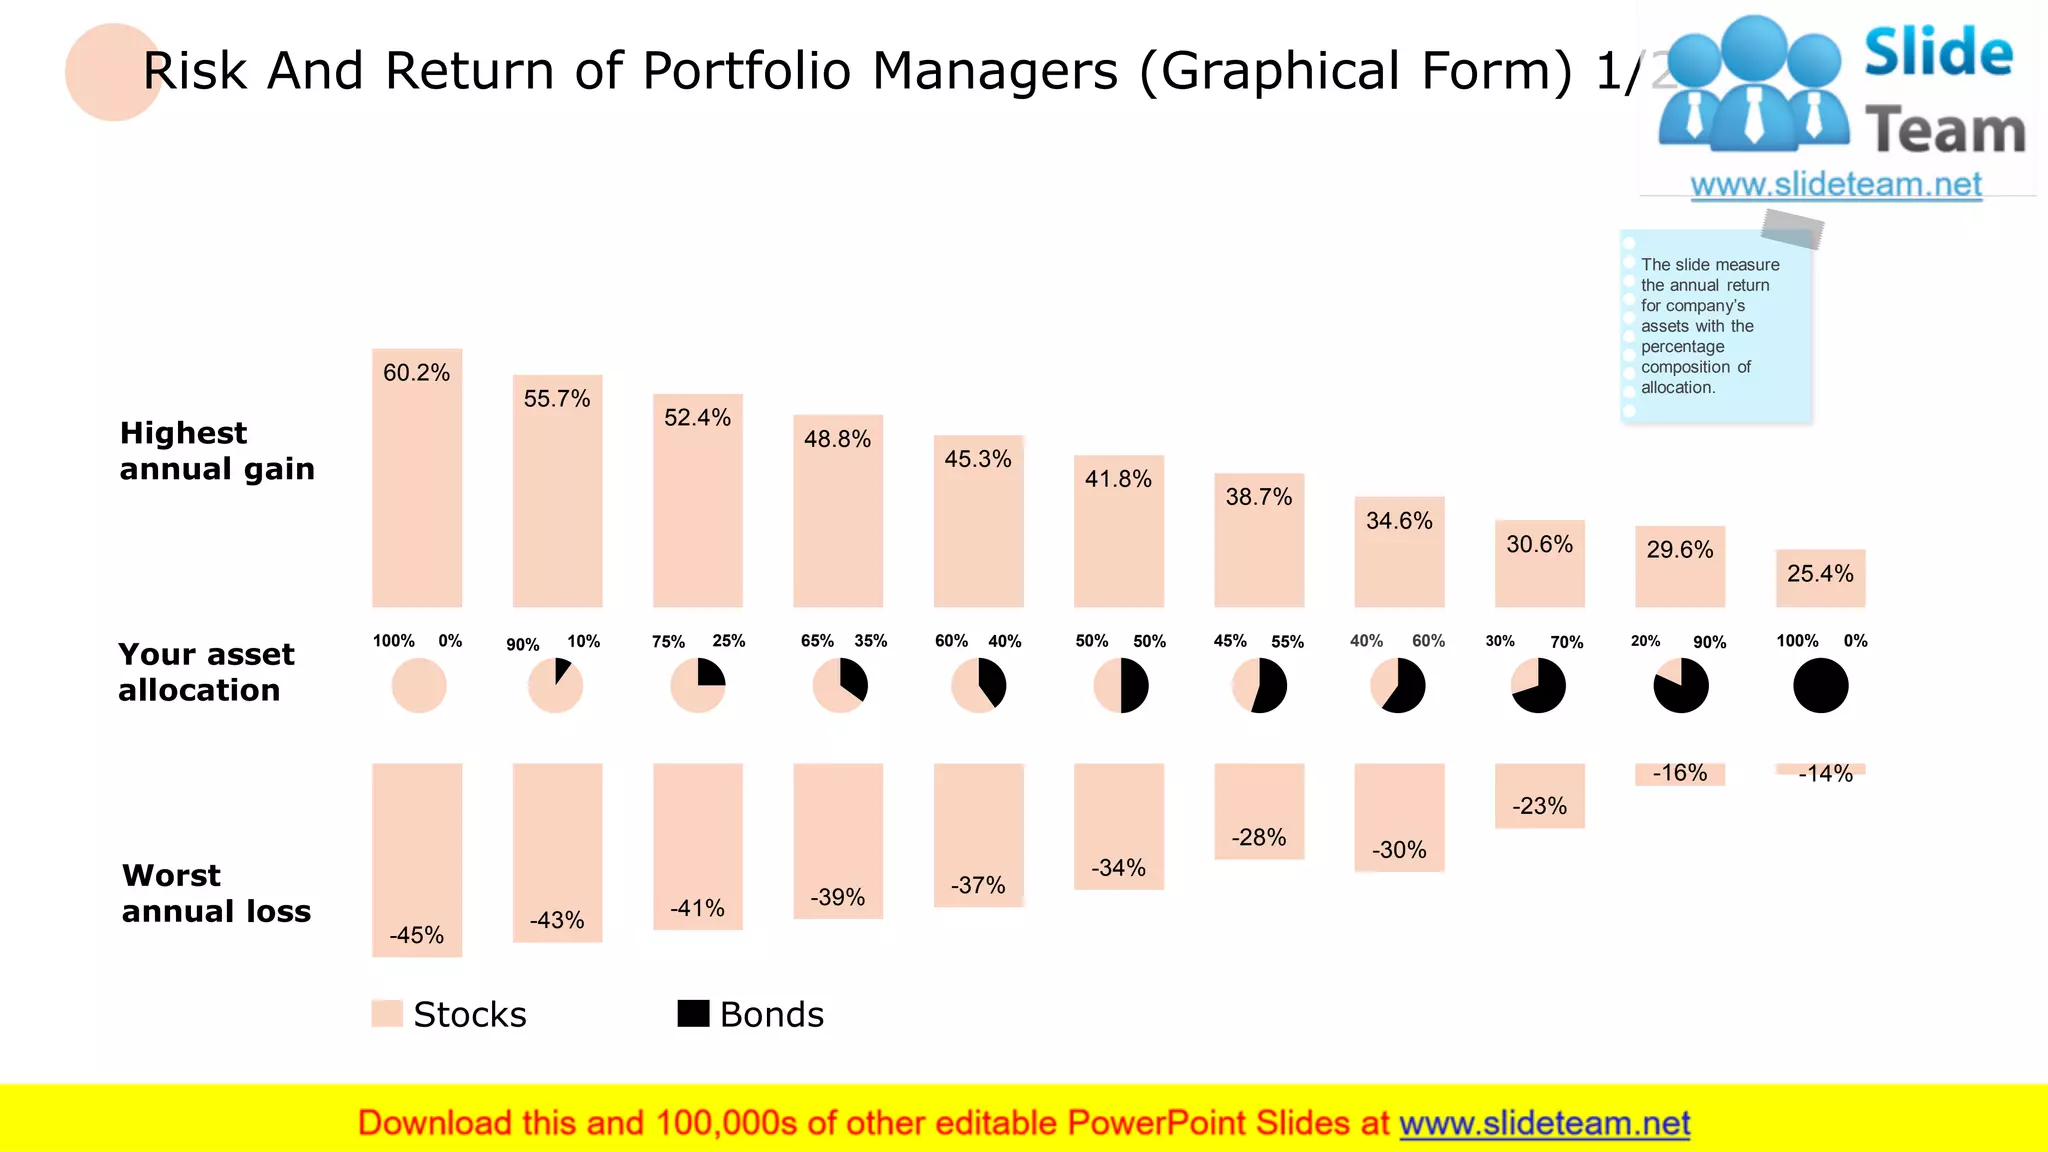
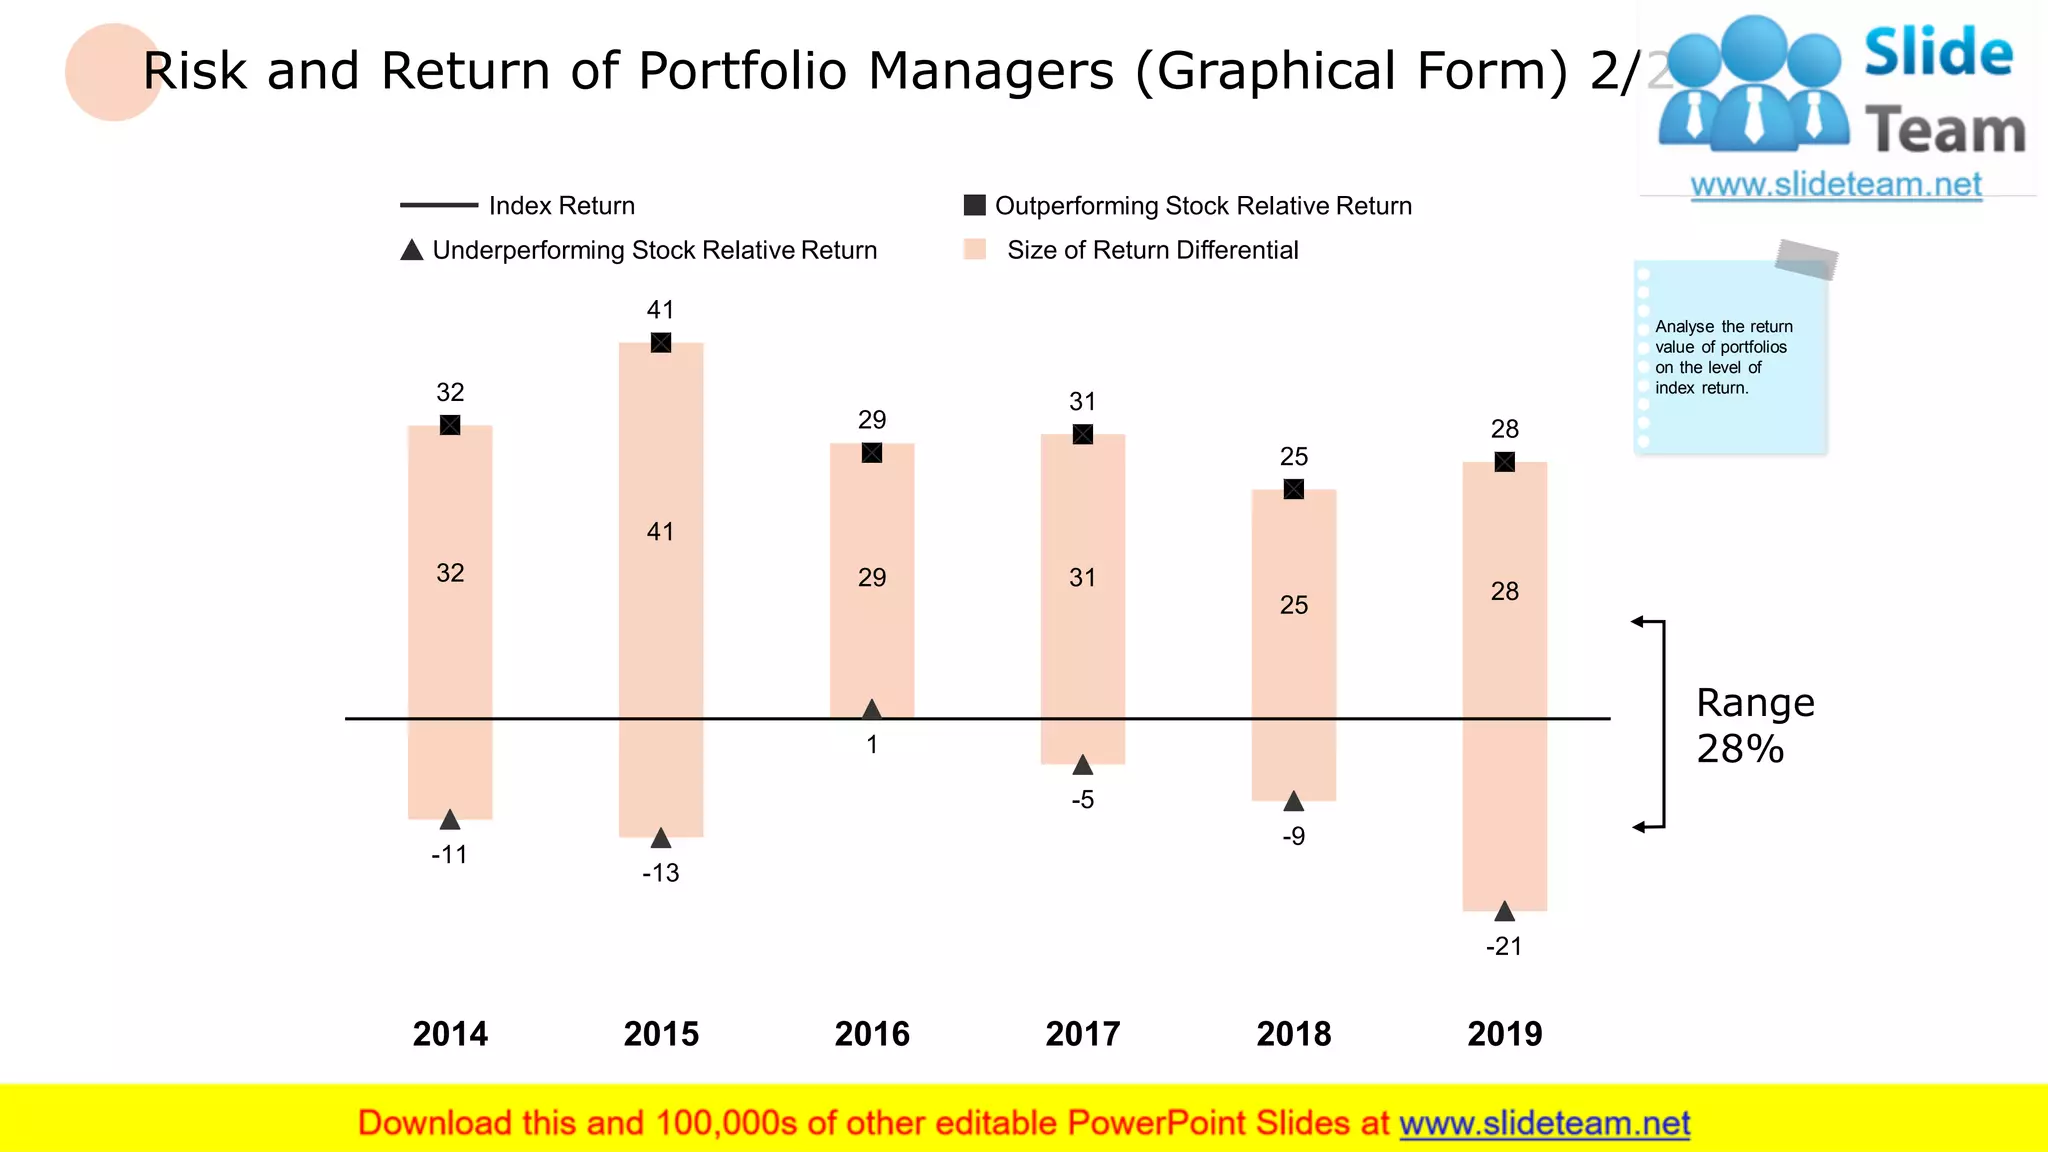
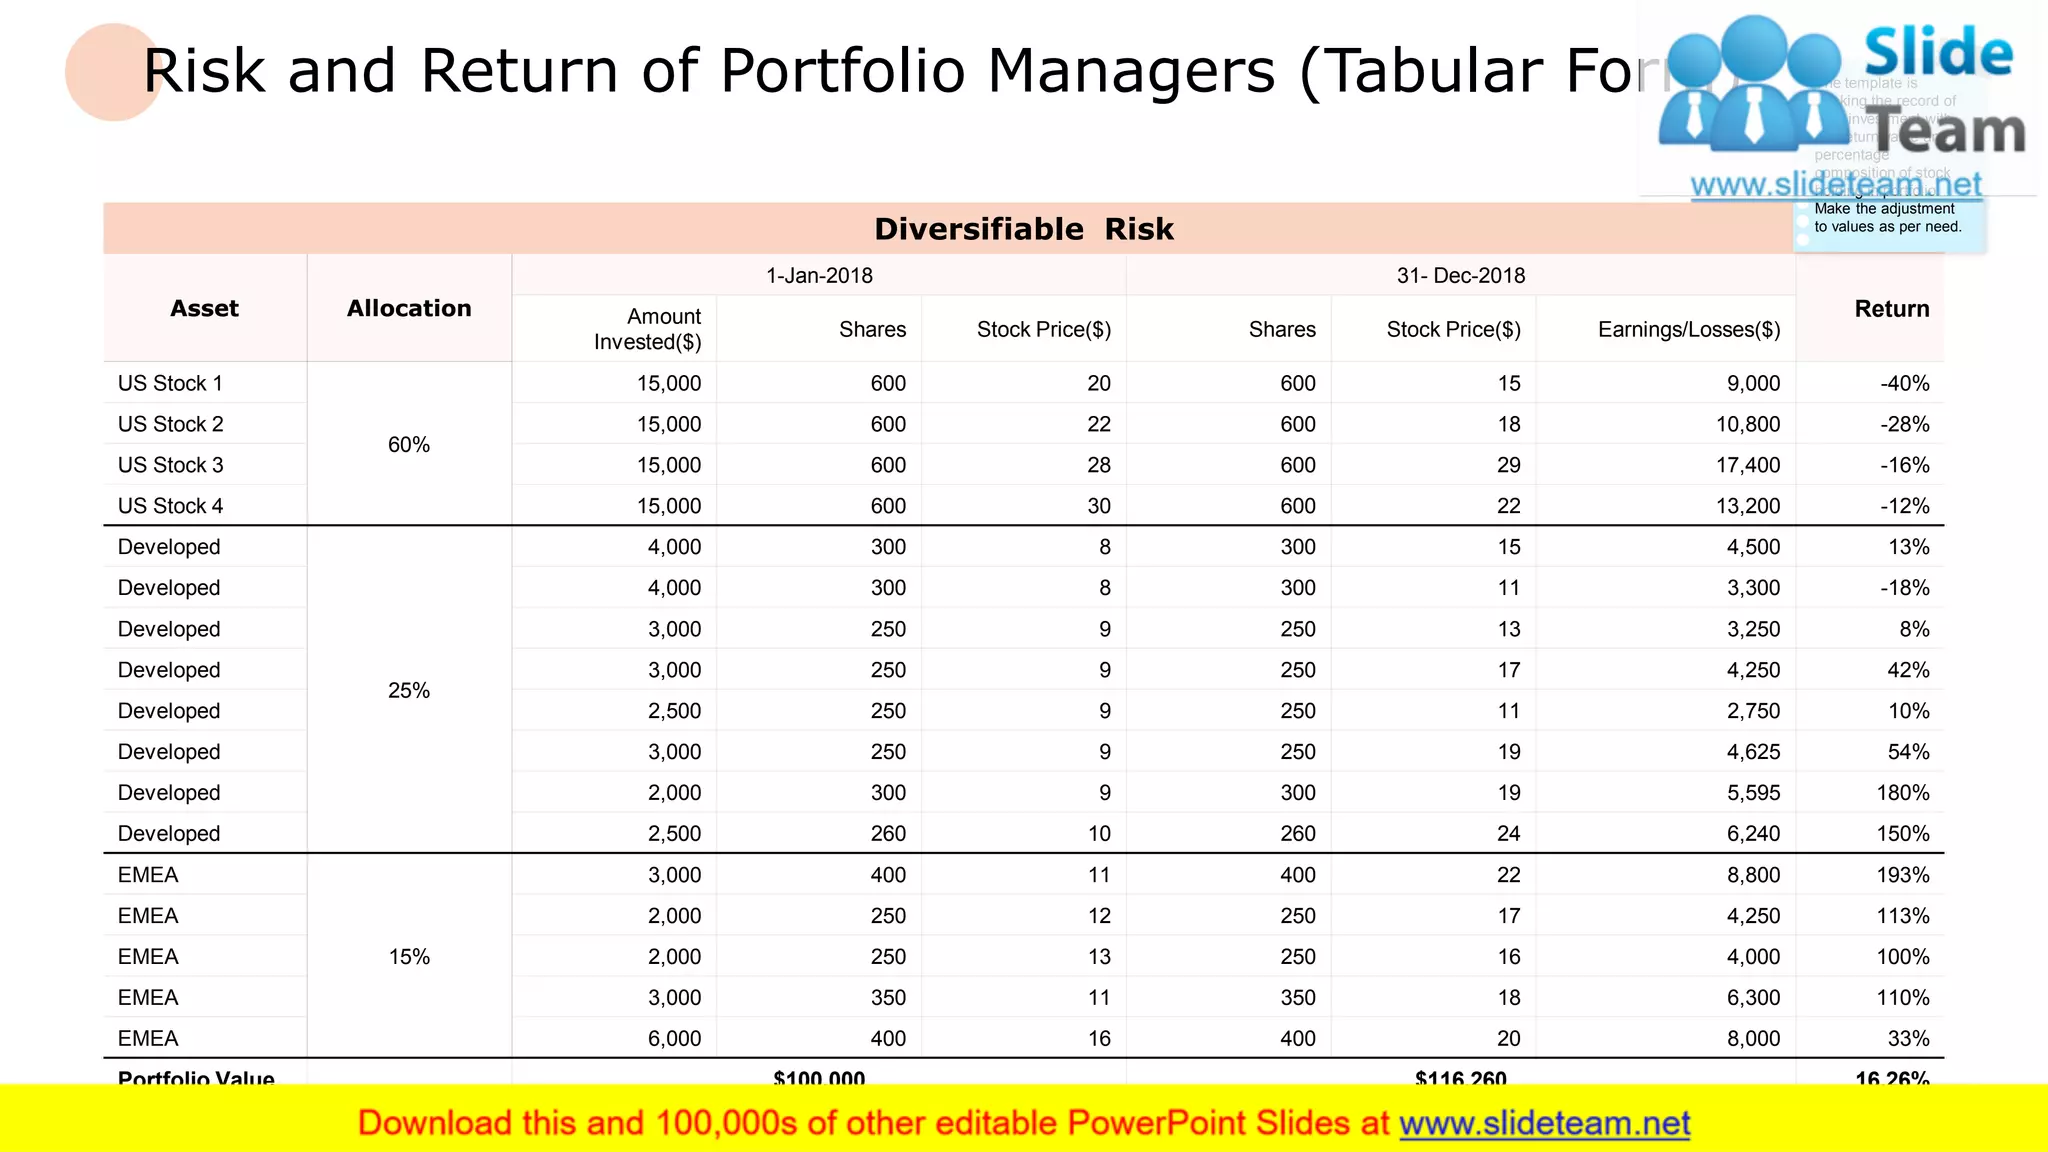
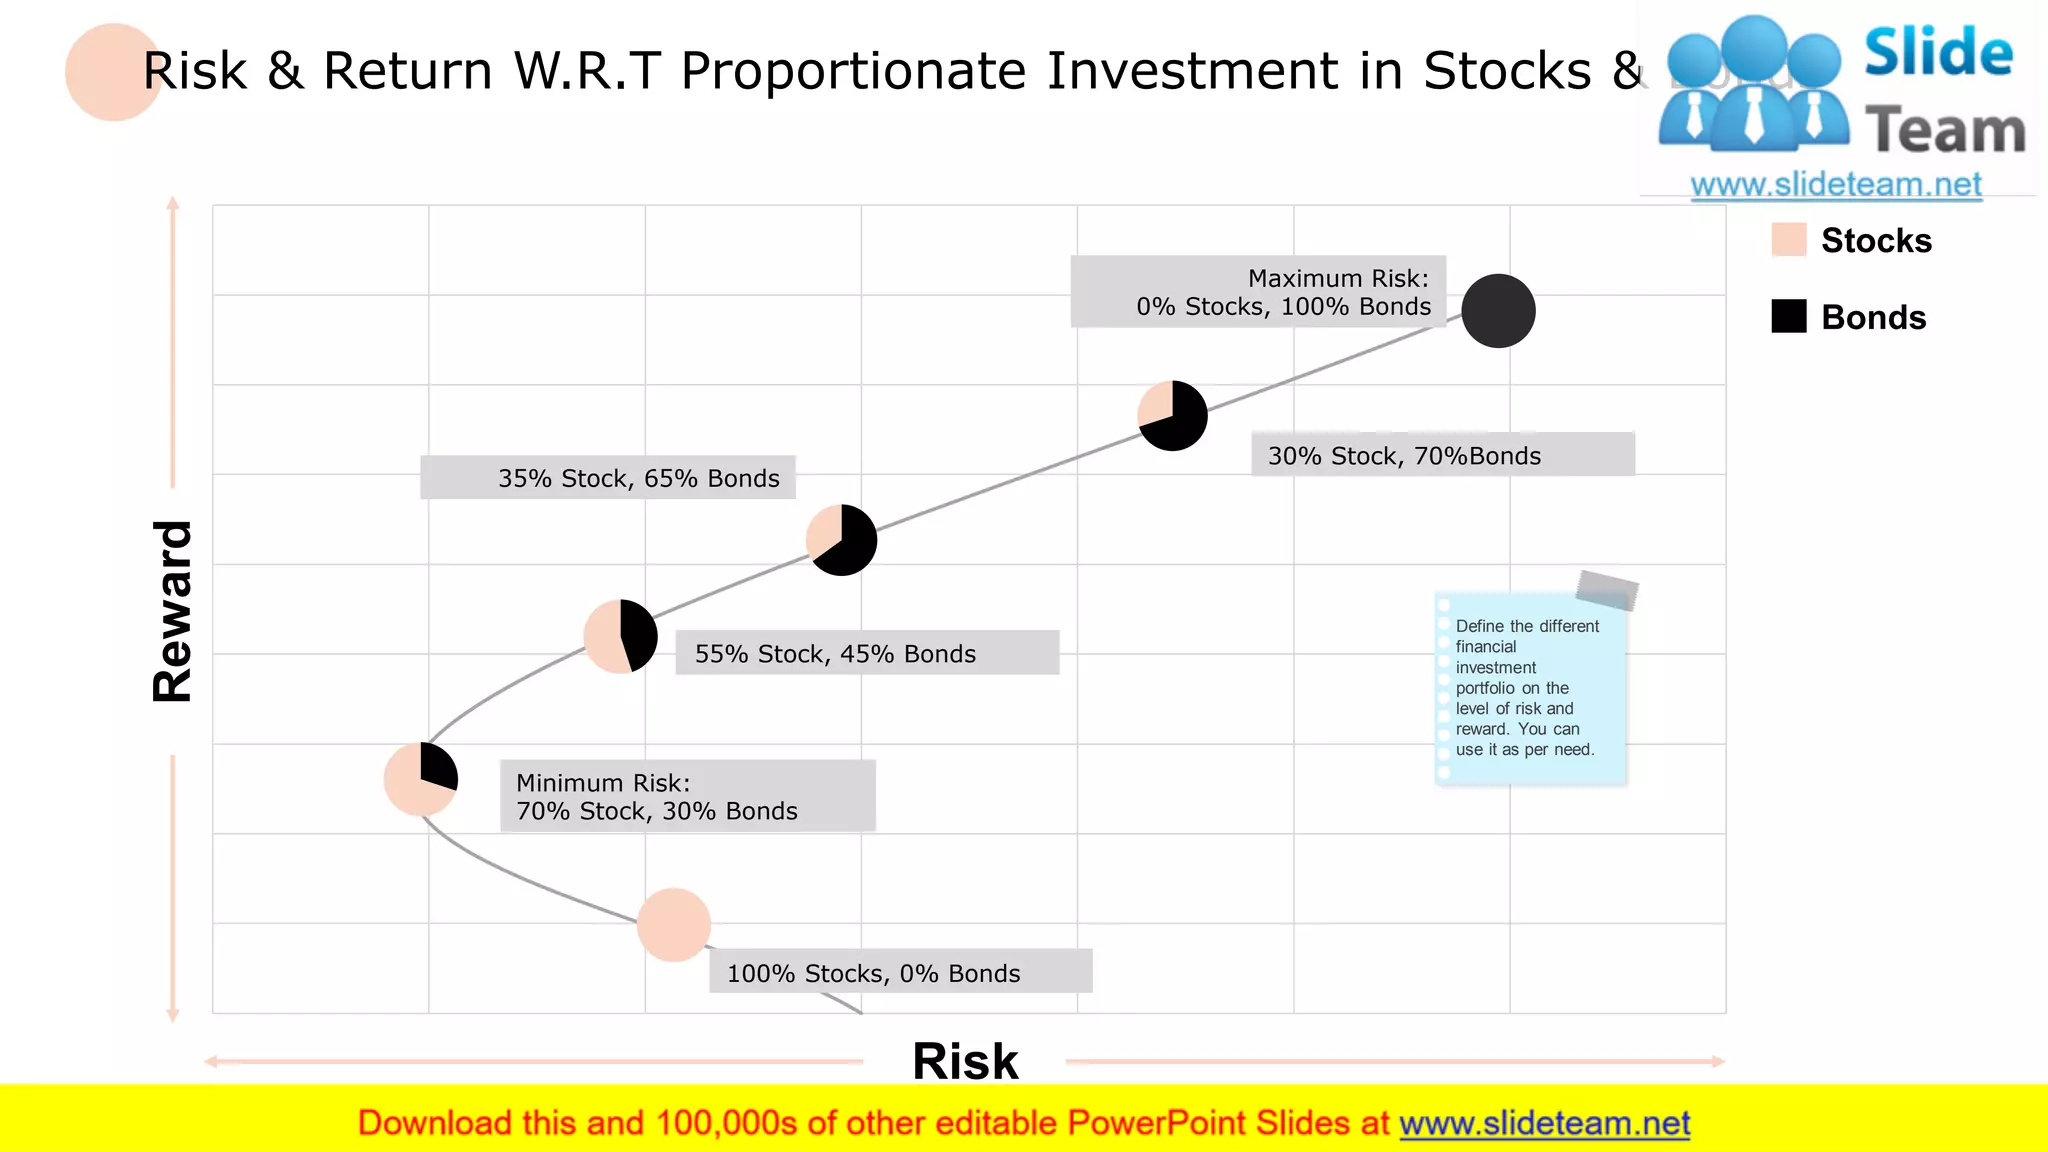
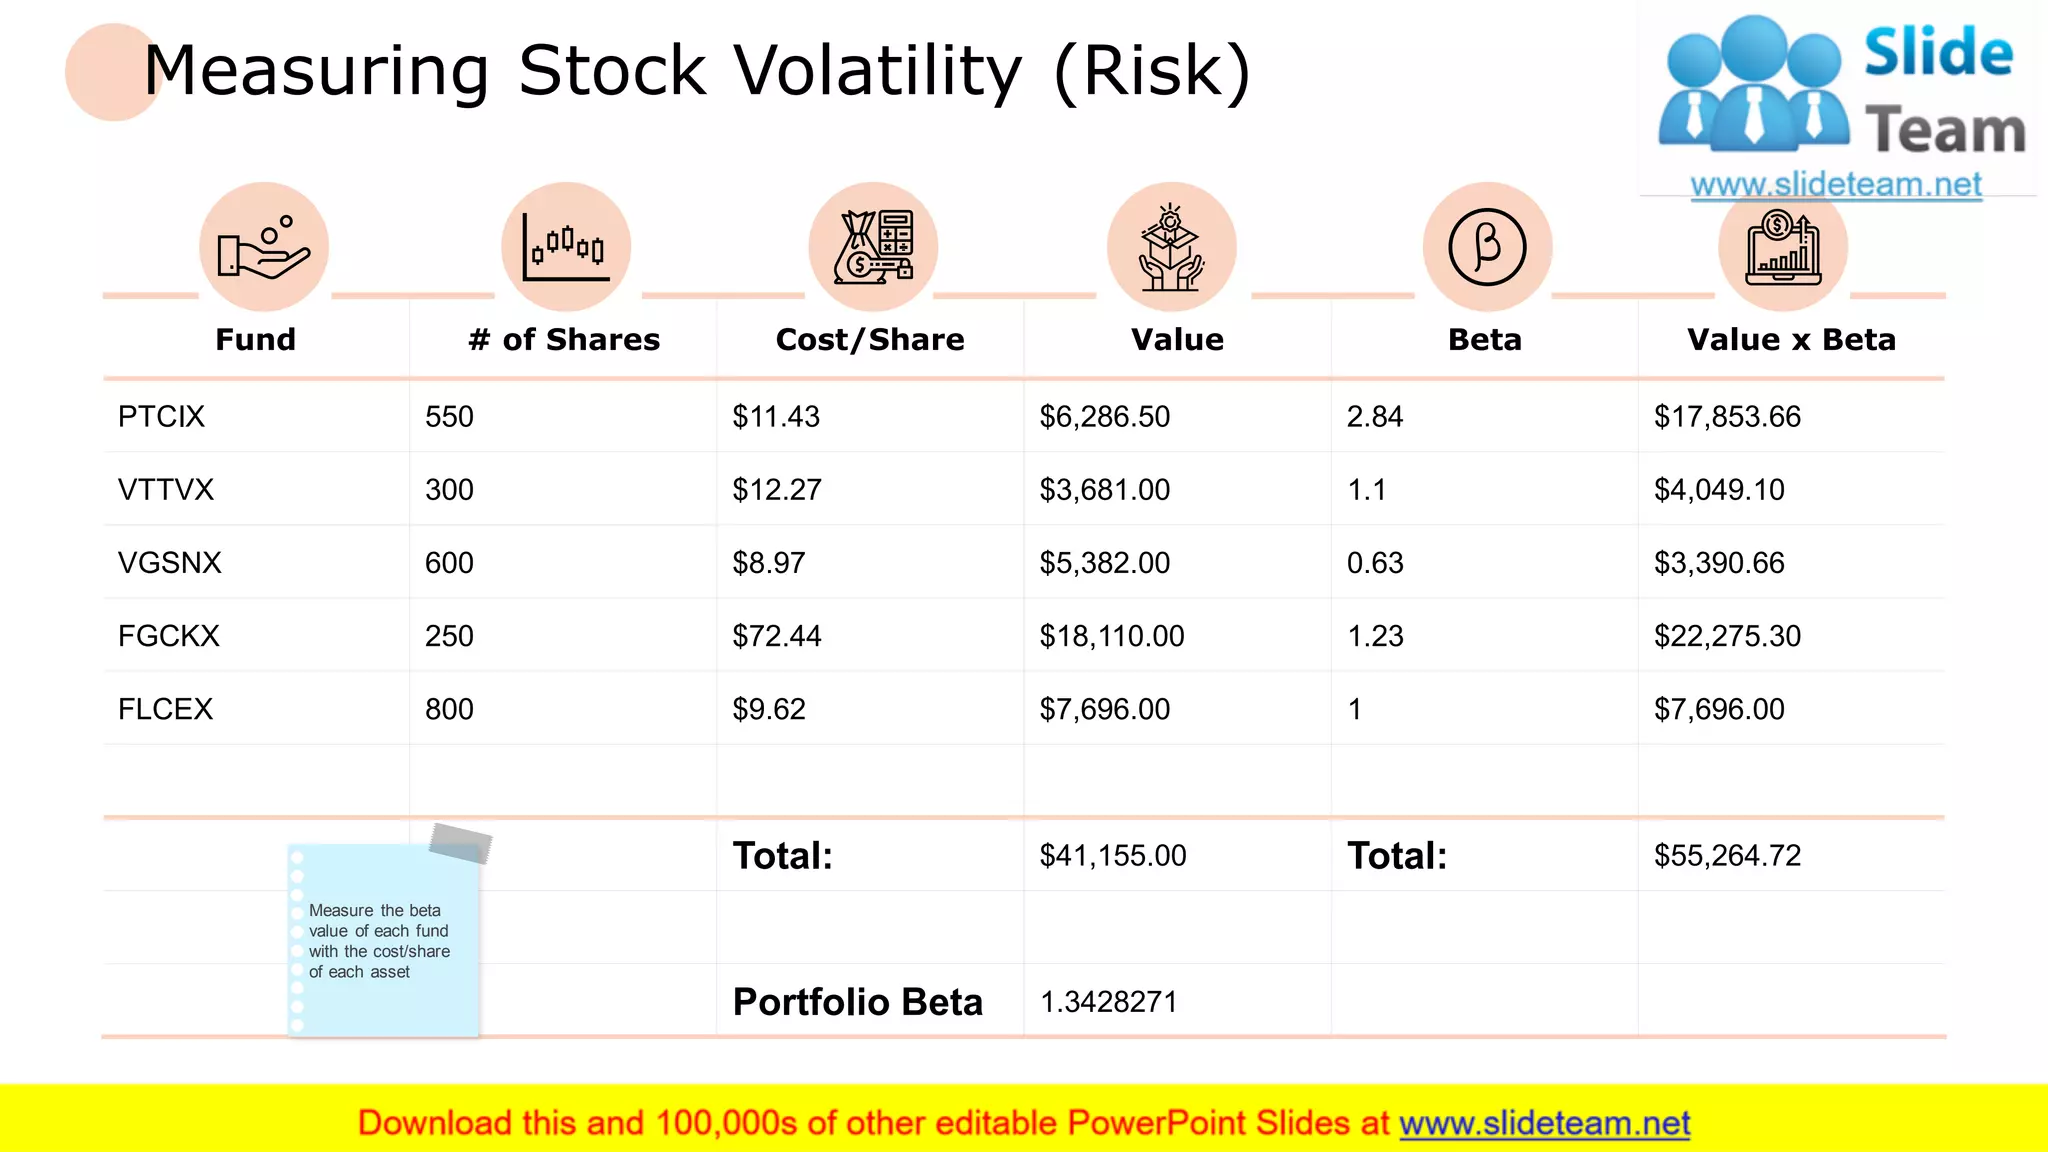
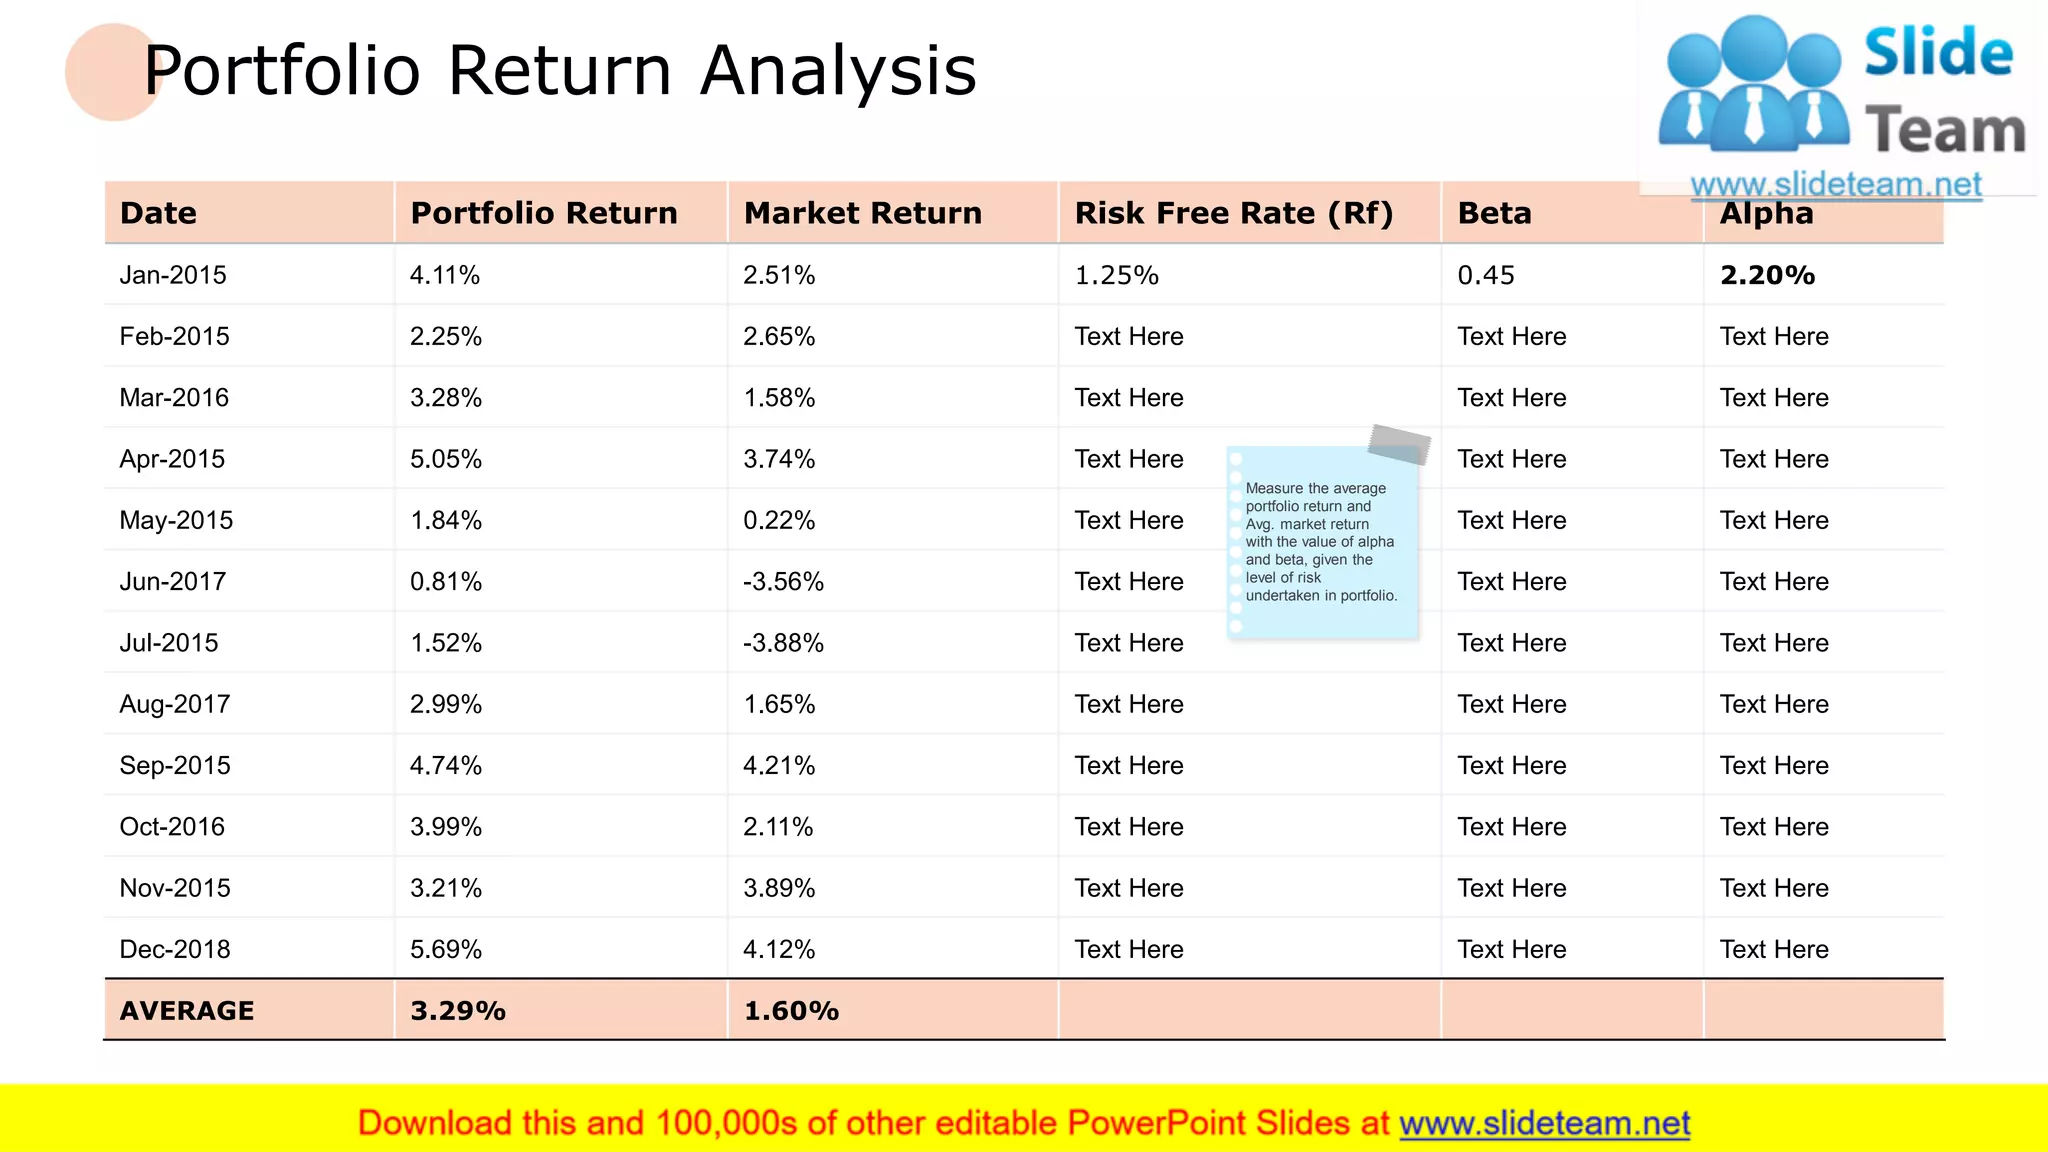
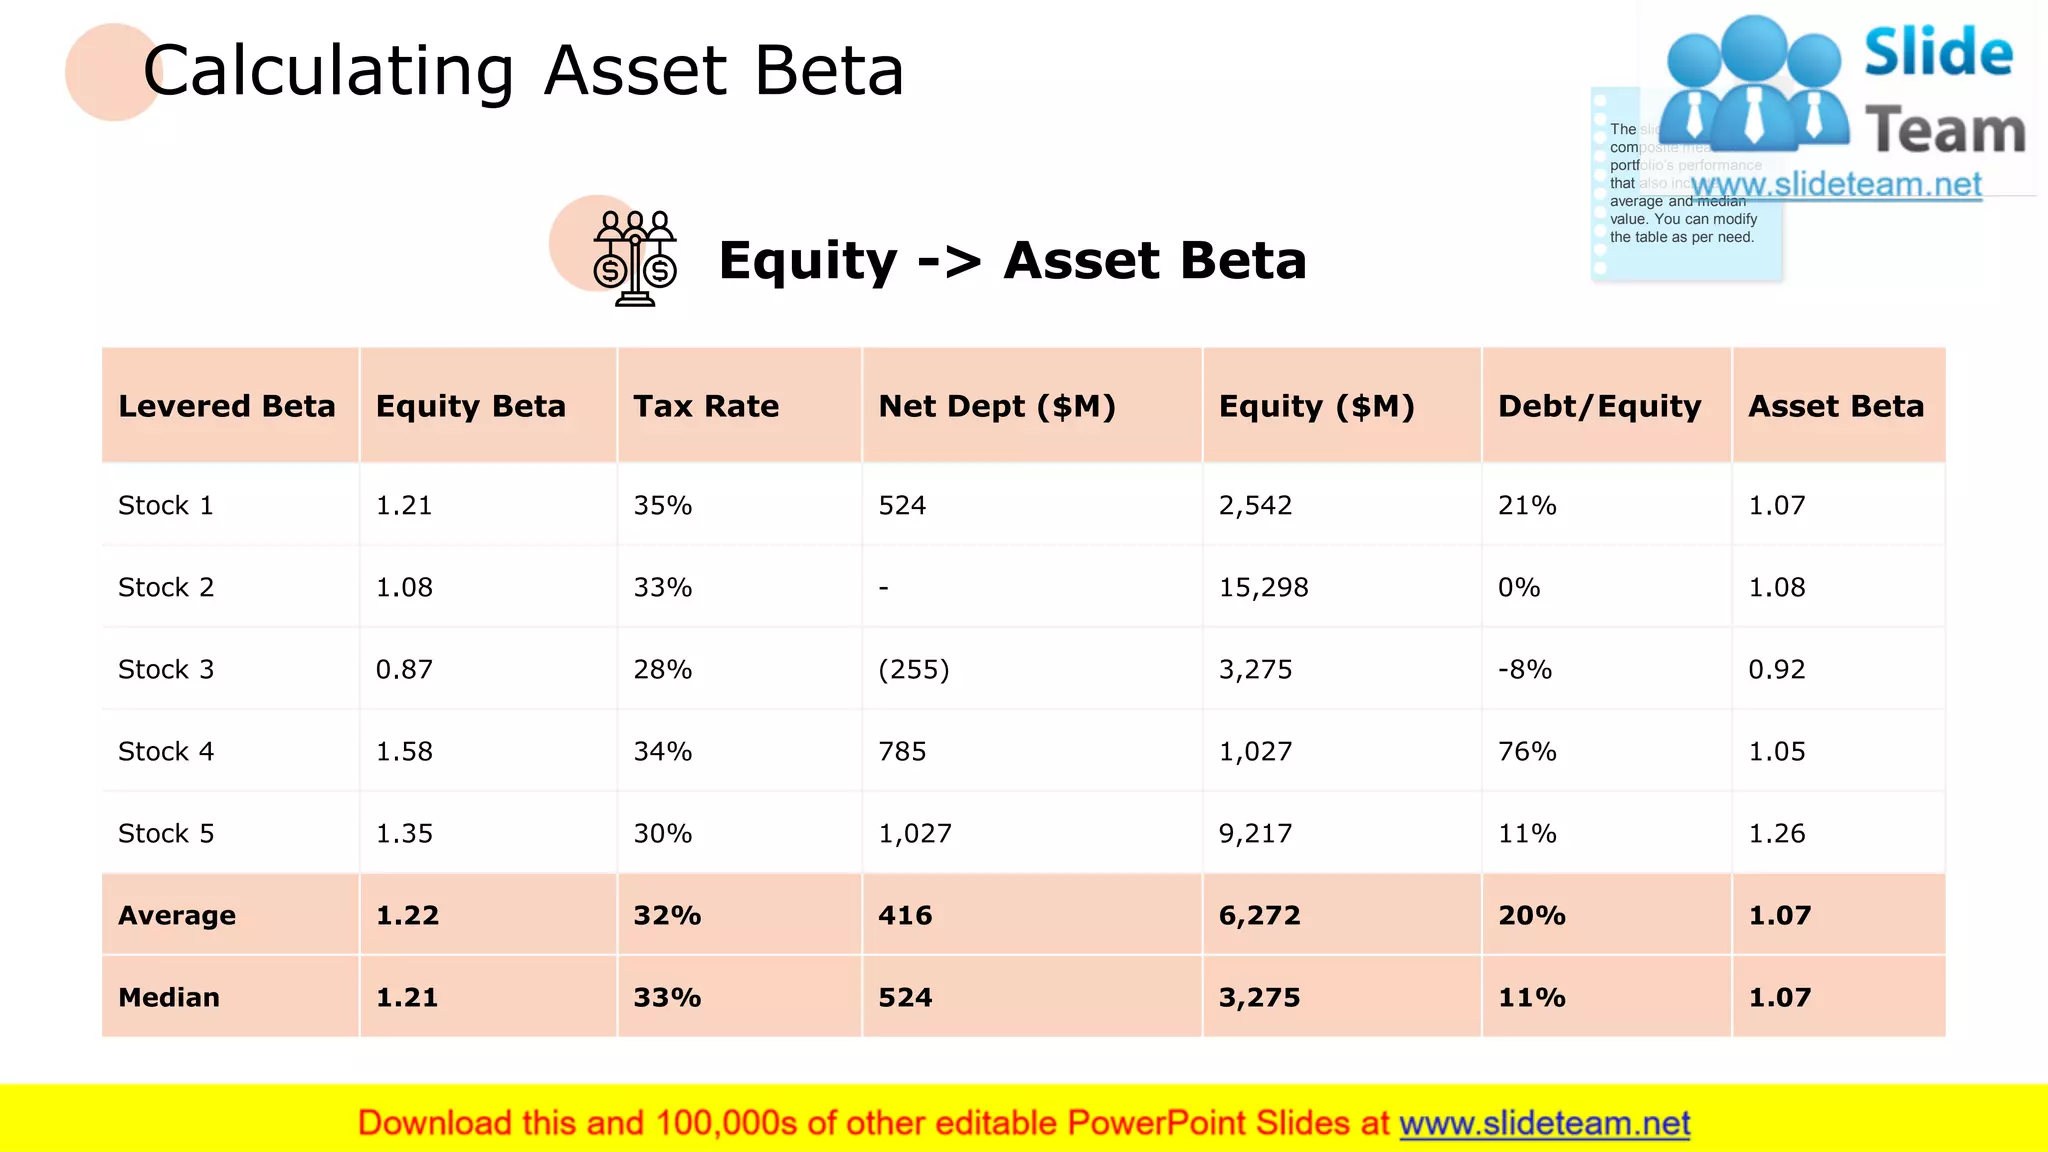
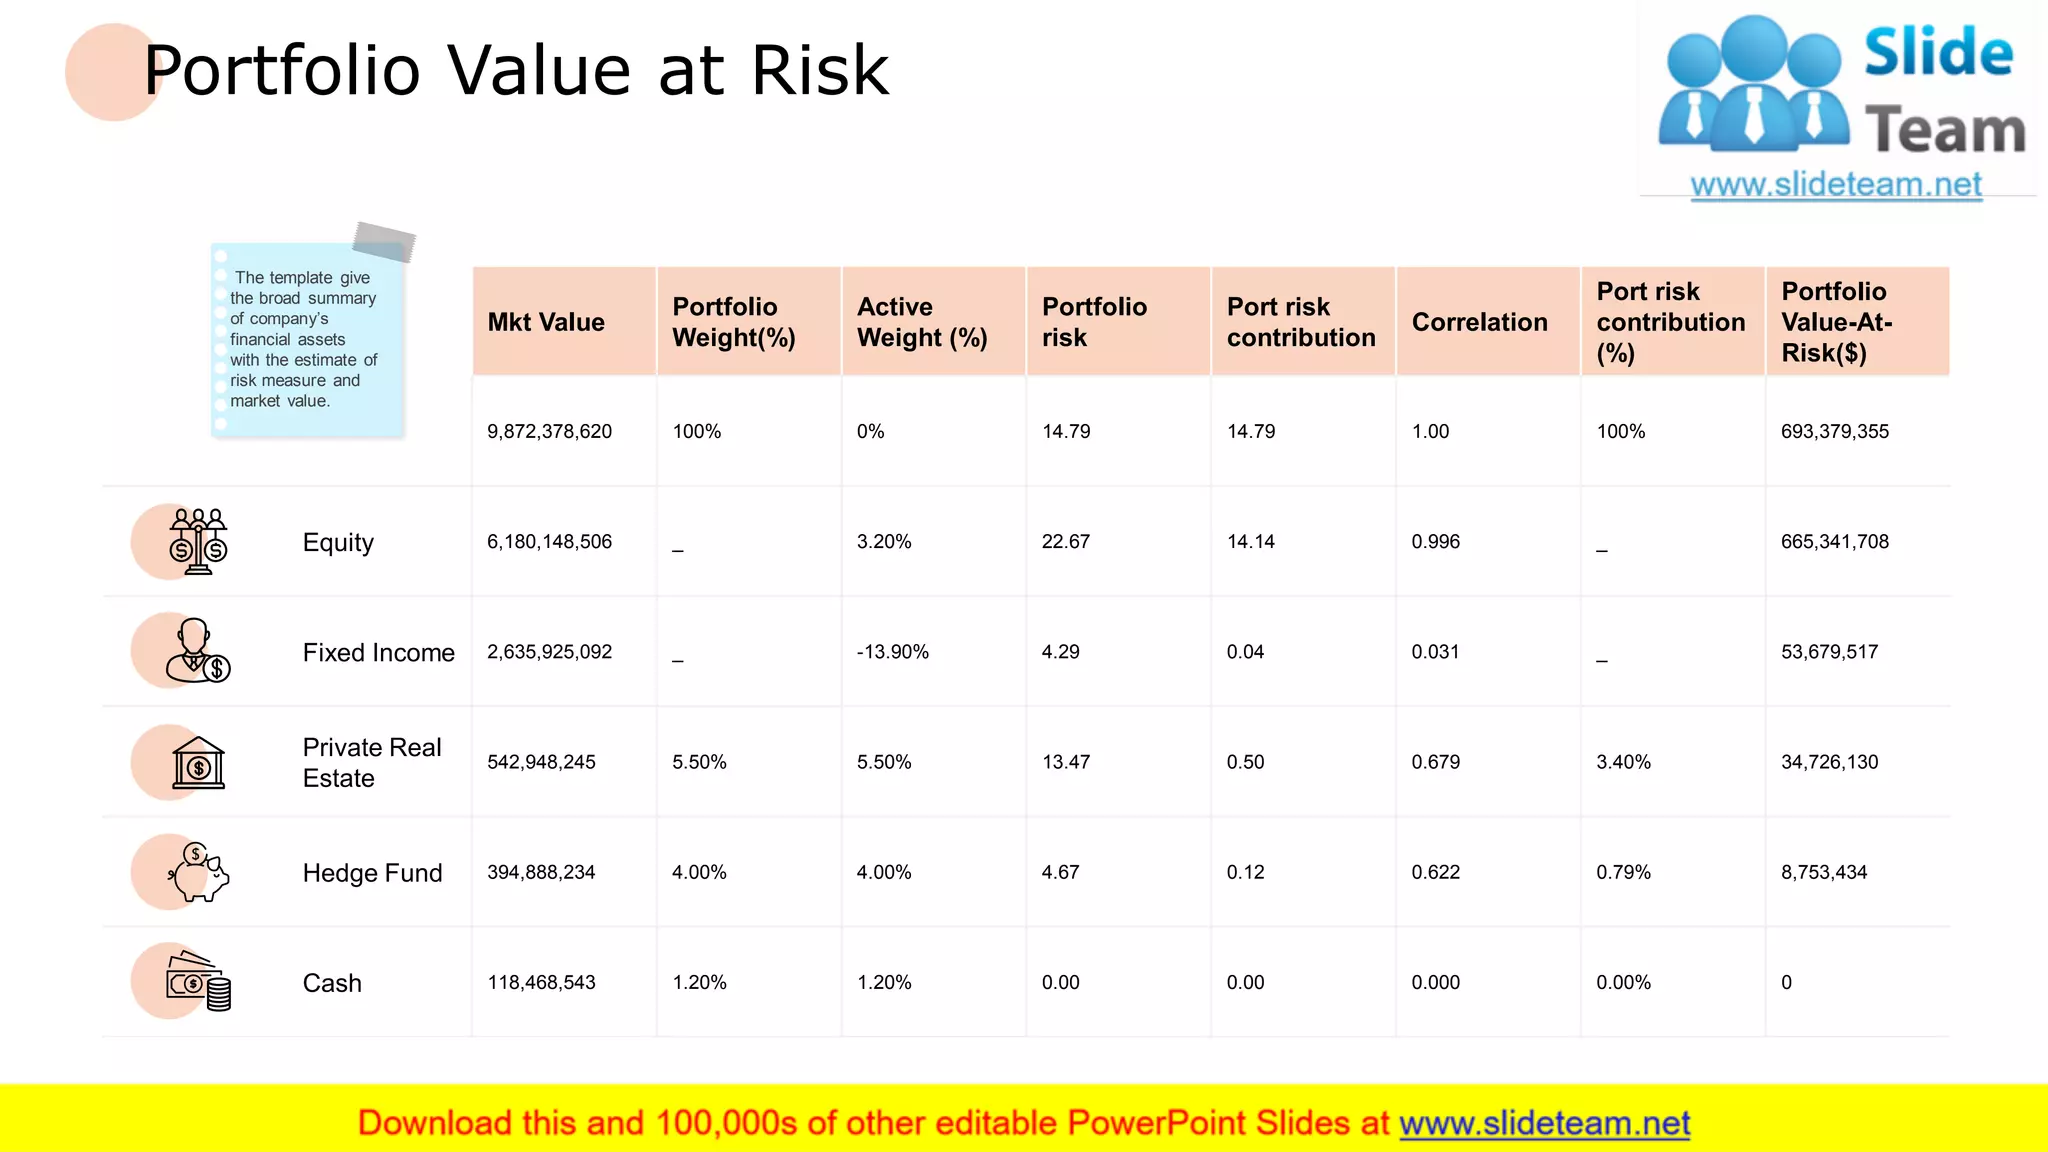
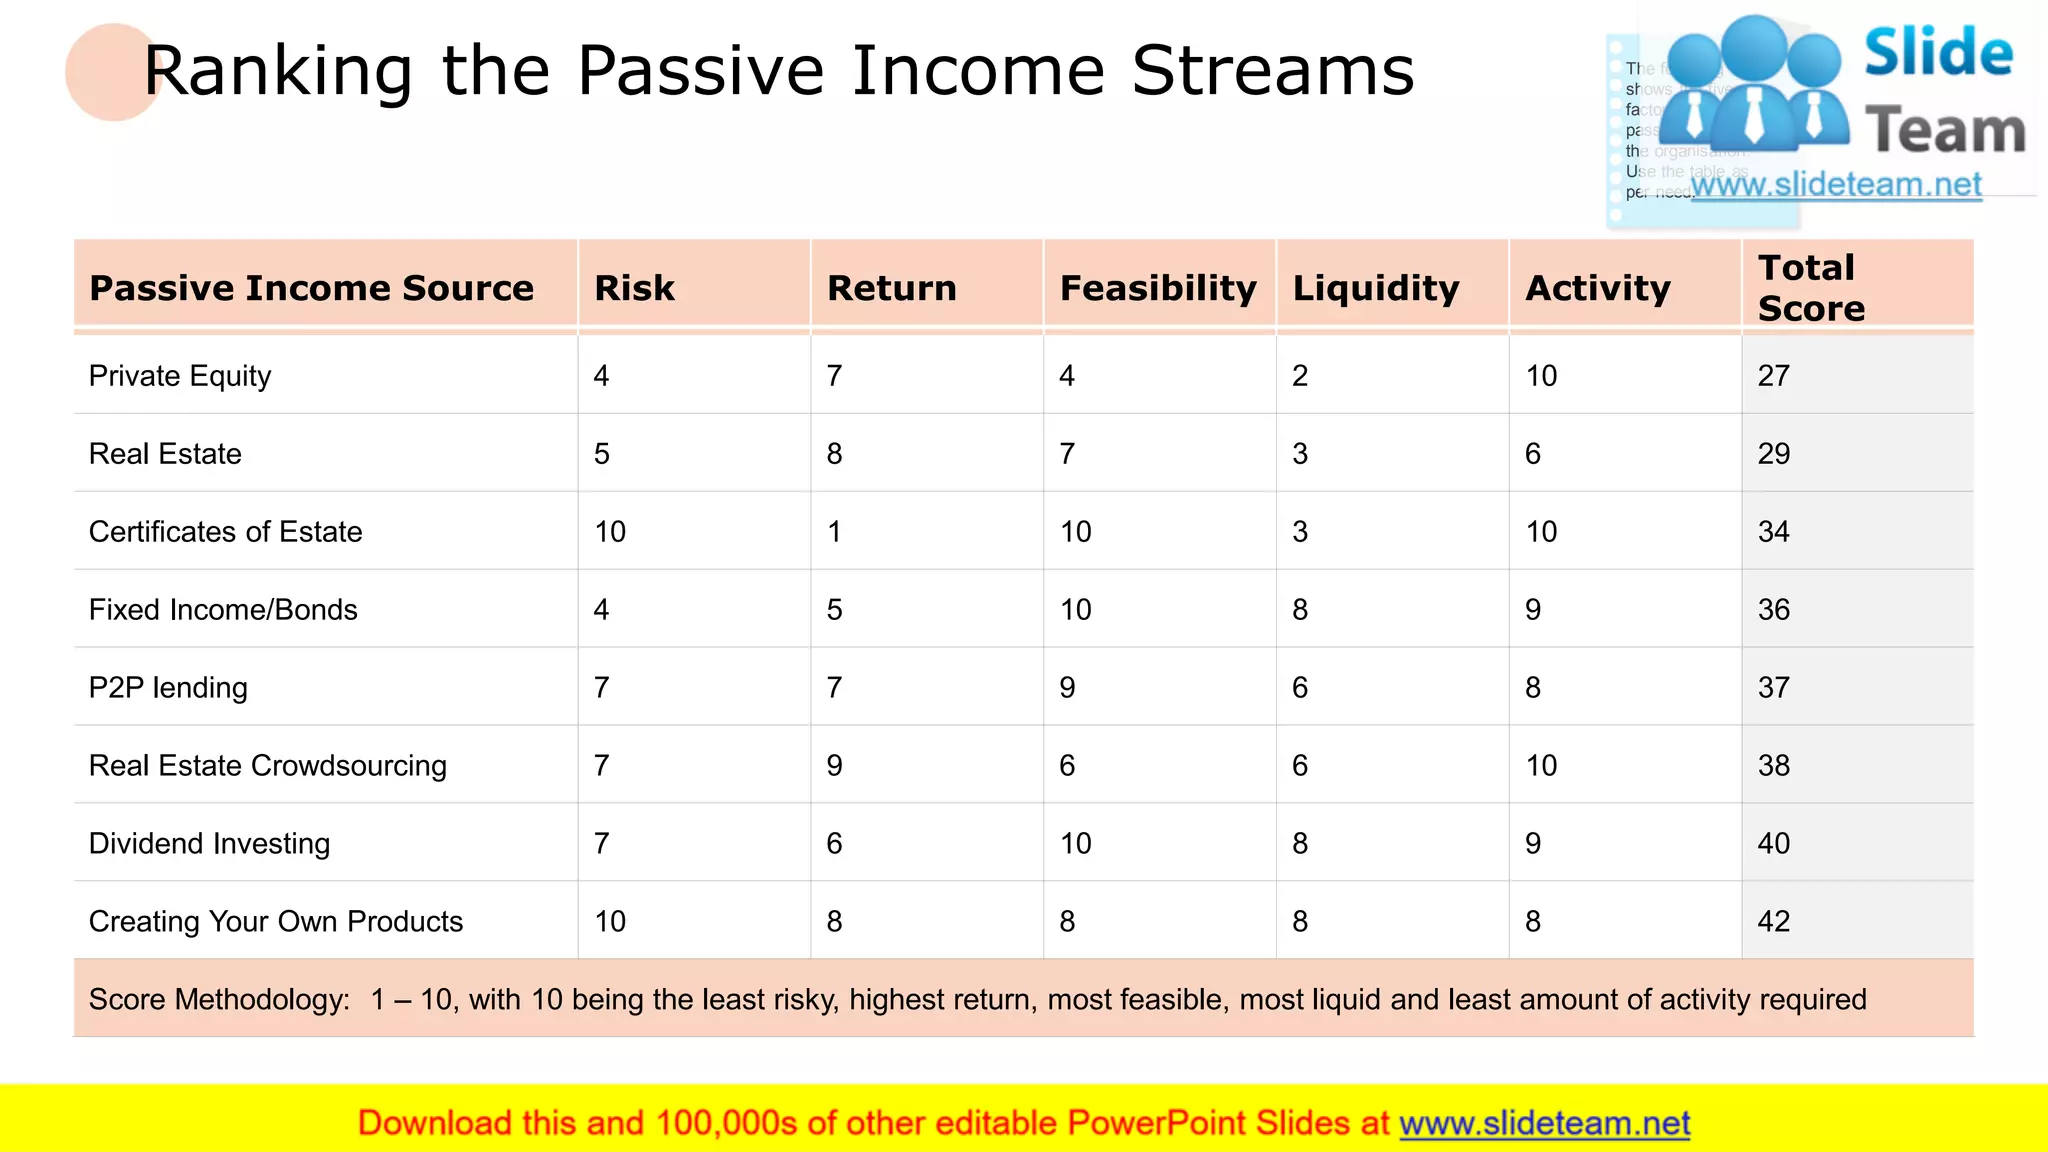


The document provides a comprehensive analysis of financial assets, focusing on risk and return measurements over various time periods. It includes investment strategies, portfolio monitoring, and performance metrics for predefined portfolios in stocks, bonds, and other asset classes. Additionally, the document features tables and graphical representations to illustrate the historical performance, volatility, and passive income rankings of different investment options.


![Chapter4_Initiation_of_Sediment_Motion_v2[1].pptx](https://cdn.slidesharecdn.com/ss_thumbnails/chapter4initiationofsedimentmotionv21-251208223747-f94ef163-thumbnail.jpg?width=640&height=640&fit=bounds)


![CleanMyMac X v5.2.8 Crack for MacOS Full Version [Latest] pptx](https://cdn.slidesharecdn.com/ss_thumbnails/softwareoverview-251207194121-a81f0142-thumbnail.jpg?width=640&height=640&fit=bounds)


![PowerISO 9.2 Mac Crack + Serial Key Free Download 2026 [Latest] Software.pptx](https://cdn.slidesharecdn.com/ss_thumbnails/software-251207185653-5d5700e6-thumbnail.jpg?width=640&height=640&fit=bounds)


![iStat Menus 7.20 Crack for MacOS 2026 Full Version [Latest] pptx](https://cdn.slidesharecdn.com/ss_thumbnails/softwareoverview-251207191544-22b737dc-thumbnail.jpg?width=640&height=640&fit=bounds)

![AnyTrans for iOS 8.9.14.20251127 With Crack for MacOS [Latest] pptx](https://cdn.slidesharecdn.com/ss_thumbnails/softwareoverview-251207190907-2316965f-thumbnail.jpg?width=640&height=640&fit=bounds)
![Wondershare Filmora 15.0.11 Crack for Mac Key Full Download [Latest] pptx](https://cdn.slidesharecdn.com/ss_thumbnails/software-251207184836-1d16ba16-thumbnail.jpg?width=640&height=640&fit=bounds)
