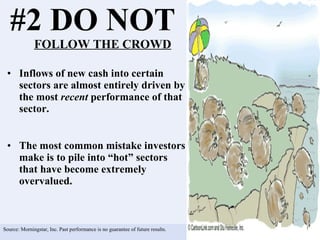
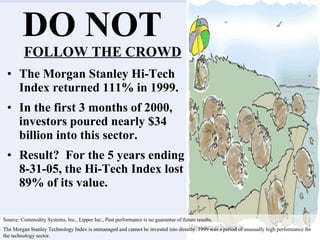
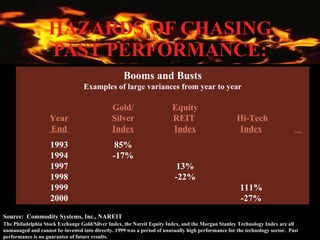
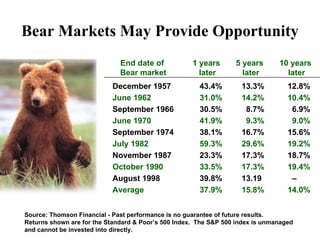
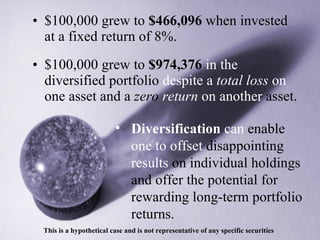
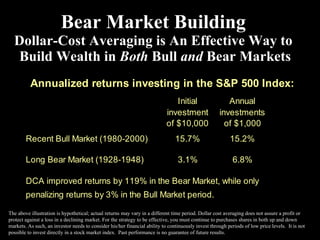
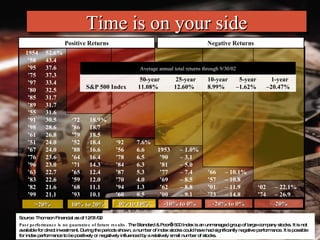
TEN WAYS TO WEALTH Lon W. Broske, CFS
TEN WAYS TO WEALTH 1. Have a long-term plan to reach 2 your goals 2. Do not follow the crowd 3. Do not speculate 4. Do not buy stocks on rumor 5. Do not use margin
TEN WAYS TO WEALTH 6. Hire a professional financial advisor 7. Do not let emotion overrule logic 8. Own a diversified portfolio 9. Do not time the market 10.Update your plan every two years
Define Specific Goals   Define Your Investment Objectives Know Your Risk Tolerance Build A Portfolio That Fits Your Objectives And Your Risk Tolerance #1  HAVE A LONG-TERM PLAN TO REACH MY FINANCIAL GOALS
#2 DO NOT  FOLLOW THE CROWD Inflows of new cash into certain sectors are almost entirely driven by the most  recent  performance of that sector. The most common mistake investors make is to pile into “hot” sectors that have become extremely overvalued.  Source: Morningstar, Inc. Past performance is no guarantee of future results.
DO NOT  FOLLOW THE CROWD The Morgan Stanley Hi-Tech Index returned 111% in 1999.  In the first 3 months of 2000, investors poured nearly $34 billion into this sector. Result?  For the 5 years ending 8-31-05, the Hi-Tech Index lost 89% of its value. Source: Commodity Systems, Inc., Lipper Inc., Past performance is no guarantee of future results. The Morgan Stanley Technology Index is unmanaged and cannot be invested into directly. 1999 was a period of unusually high performance for the technology sector.
HAZARDS OF CHASING PAST PERFORMANCE: Source:  Commodity Systems, Inc., NAREIT Booms and Busts Examples of large variances from year to year Gold/ Equity   Year  Silver REIT   Hi-Tech   End  Index Index Index   1993 85% 1994 -17% 1997 13% 1998 -22% 1999 111% 2000 -27% The Philadelphia Stock Exchange Gold/Silver Index, the Nareit Equity Index, and the Morgan Stanley Technology Index are all unmanaged and cannot be invested into directly. 1999 was a period of unusually high performance for the technology sector.  Past performance is no guarantee of future results.
#3  DO NOT SPECULATE “ Everyone knows that most people who speculate or gamble in the market lose money at it in the end. The people who persist in trying it are either unintelligent or    willing to lose money    for the fun of the    game…In any case,   they are not really    investors at all.”   -- Benjamin Graham R W  =  Q  +  T  +  D
#4  DO NOT BUY STOCKS ON RUMOR
#5  DO NOT USE MARGIN “What’s in Your Wallet?”
#5  DO NOT USE MARGIN “What’s in Your Wallet?” Borrowing money to buy stock dramatically increases your risk You have to pay interest on the money you borrow to buy the stock on margin A margin call could force you to sell your stock at a depressed price
Assume that shortly after Berkshire Hathaway acquired General Re in April 1998, a friend told you that “No one has  ever  lost money in Berkshire, and this is the  biggest  bet that Warren Buffett has ever made.” A Margin Horror Story
You decide to buy 10 shares of Berkshire Class A on June 22, 1998 for $84,000 per share-- an $840,000 total investment.  Feeling confident, you decide to use 50% margin…. Unfortunately Berkshire declines to $40,800 by February of 2000. Unable to put up more margin, you are forced to sell. Your $420,000 investment is now worth ZERO.  By the end of 2002, Berkshire recovers to $72,750, but unfortunately, you were forced out of your position.
#6  Hire a Professional Financial Advisor
WHY HIRE A PROFESSIONAL  FINANCIAL ADVISOR? Quality advice can make a difference. To help you work toward financial security. To help you clarify your goals and identify your ability to withstand market fluctuations.
WHY HIRE A PROFESSIONAL  FINANCIAL ADVISOR? To develop and monitor a diversified portfolio designed to help you meet your goals. To help you remain “on course” with your long term objectives especially in those times when it is emotionally difficult to do so.
WHY HIRE A PROFESSIONAL  FINANCIAL ADVISOR? To help you get your financial matters in order so you are prepared for the unexpected. To help you maximize tax savings and take advantage of money saving opportunities. “Our job is not to make you rich, but to save you from becoming poor.”
What do each of the following have in common?
ANSWER:  THEY ALL HAVE PERSONAL COACHES
A Professional  Advisor’s Most  Important Job According to University of Nebraska Sports Psychologist, Dr. Jack Stark: “ Behavior management  is probably the most important element in the service that a professional financial advisor can provide for his clients.”
#7  DO NOT LET EMOTION  OVERRULE LOGIC Do not let the news of the day distract you from your long-term plan.
The Cycle of Market Emotions Optimism Excitement Thrill Euphoria Anxiety Denial Fear Desperation Capitulation Panic Despondency Depression Hope Relief Optimism Point of Maximum Financial Opportunity - Investors Realize Investment Opportunity Point of Maximum Financial Risk - Investors Beware of Higther Investment Risk
Bear Markets May Provide Opportunity December 1957 43.4% 13.3% 12.8% June 1962 31.0% 14.2% 10.4% September 1966 30.5% 8.7% 6.9% June 1970 41.9% 9.3% 9.0% September 1974 38.1% 16.7% 15.6% July 1982 59.3% 29.6% 19.2% November 1987 23.3% 17.3% 18.7% October 1990 33.5% 17.3% 19.4% August 1998 39.8% 13.19 – Average 37.9% 15.8% 14.0% Source: Thomson Financial - Past performance is no guarantee of future results.  Returns shown are for the Standard & Poor’s 500 Index.  The S&P 500 index is unmanaged and cannot be invested into directly. End date of  Bear market 10 years later 5 years later 1 years later
S&P 500 vs “Panic Points”   It is not possible to invest directly in a market index.  Past performance is no guarantee of future performance. Since World War II
If, at December 31, 1925,  you  knew  what was coming 1929 - Stock Market crashes 1933 - U.S. banks closed, depression 1939 - World War II begins  1941 - Japan bombs Pearl Harbor  1950 -  Korean War begins  1962 - Cuban Missile Crisis 1963 - Kennedy assassinated 1973 - OPEC oil embargo 1974 -Nixon Resigns, Watergate 1980 - Inflation rate rises to 14% 1982 - Worst recession in 50 years 1987 - Dow crashes 23 % in one day 1989 - S&L crisis, $500bn bailout 1990 - Persian Gulf War, recession 1997 - Asian financial crisis 1998 - Russian default 1999 - Clinton impeachment trials  2001 - Terrorist attacks on America
Stocks? T-Bills? What would  you have invested in?
If you answered “stocks”,  you would have been right: Ibbotson Associates cumulative total return indices for S&P 500 and 3-Month Treasury Bills.  It is not possible to invest directly in an index.  Past performance is no guarantee of future results. Stocks T-Bills Reflects the growth of $10,000 invested on Dec. 31, 1927 to Dec. 31, 2004 $174,400 $9,799,411
What if you wanted  to seek preservation of principal?
T-BILLS MAY NOT BE    THE BEST SOLUTION….” After inflation and taxes, $10,000 continuously reinvested in 3-month T-bills was worth only  $5,221 .  Your after-tax, inflation-adjusted purchasing power would’ve been  reduced by 48%  after having invested for 76 years ! Ibbotson Associates cumulative total return indices for 3-Month Treasury Bills adjusted for both inflation and taxes.  Investment period from 12/31/25 - 12/31/01.  It is not possible to invest directly in an index.  Past performance is no guarantee of future results.  Your results will vary.  Taxes are based upon the top marginal personal income tax rate in the U.S. each year.  Inflation is based upon the change in the Consumer Price Index.
How diversified are you really?
#8  OWN A DIVERSIFIED PORTFOLIO Assume it is 12/31/71 and you are blessed with perfect foresight about these annual asset class returns over the next 29 years.  How would you allocate your retirement plan? Indices used to represent asset classes depicted above are the S&P 500, the Morgan Stanley EAFE Index, the NAREIT Equity REITs Index and the Goldman Sachs Commodity Total Return Index, respectively.  It is not possible to invest directly in a market index.  Past performance is no guarantee of future performance.
  AND THE WINNER IS... By  combining  four non-correlated asset classes, you were actually able to obtain a portfolio return which is  higher  than any of the four individual asset classes in which you invested and with less risk! The “25% of Each” Portfolio was rebalanced on January 1 of each year, 1972-2000.  Indices used to represent asset classes depicted above are the S&P 500, the Morgan Stanley EAFE Index, the NAREIT Equity REITs Index and the Goldman Sachs Commodity Total Return Index, respectively.  It is not possible to invest directly in a market index.  Past performance is no guarantee of future performance.
Why Diversify?  Because Winners Rotate: The indices used for Large-cap, Small-cap, Real Estate, and Foreign Stocks are the S&P 500, Russell 2000, NAREIT Equity REITs Index, and the Morgan Stanley EAFE Index, respectively.  One cannot invest directly in an index.  Past performance does not guarantee future results.  LARGE- SMALL- REAL YEAR COMPANY COMPANY  ESTATE FOREIGN STOCKS STOCKS STOCKS STOCKS 1982 21.6 25.0 21.6 -1.9 1983 22.6 29.1 30.6 23.7 1984 6.3 -7.3 20.9 7.4 1985 31.7 31.1 19.1 56.2 1986 18.7 5.7 19.2 69.4 1987 5.3 -8.8 -3.6 24.6 1988 16.6 25.0 13.5 28.3 1989 31.6 16.3 8.8 10.5 1990 -3.1 -19.5 -15.4 -23.5 1991 30.4 46.0 35.7 12.1 1992 7.6 18.4 14.6 -12.2 1993 10.1 18.9 19.7 32.6 1994 1.3 -1.8 3.2 7.8 1995 37.5 28.5 15.3 11.2 1996 23.0 16.5 35.3 6.1 1997 33.4 22.4 20.3 1.8 1998 28.6 -2.6 -17.5 20.0 1999 21.0 21.3 -4.6 27.0 2000 -9.1 -3.0 26.4 -14.0 2001 -11.9 2.5 13.9 -21.4 2002 -22.1 -20.5 3.9 -15.9
Which $100,000 investment would have a higher return over  20 years?   A guaranteed interest  rate of 8% per   year  or- An equal- weighted portfolio of   five  asset  classes with the following  returns:  A has a 100% loss B returns 0% a year C returns 5% a year D returns 10% a year E returns 20% a year
$100,000 grew to  $466,096  when invested at a fixed return of 8%. $100,000 grew to  $974,376   in the  diversified portfolio  despite a  total loss  on  one asset and a  zero  return  on another  asset. This is a hypothetical case and is not representative of any specific securities Diversification  can  enable  one to   offset  disappointing  results  on individual holdings and offer the potential for rewarding long-term portfolio returns.
#9  DO NOT TIME  THE MARKET Mark Hulbert runs the Hulbert Financial Digest, which independently monitors the investment performance of stock market newsletters Hulbert has tracked 137 newsletters since 1980 There is no evidence of any market-timing ability even by those who make it a full time job:  Only 4 of 137 (2.9%) outperformed the performance of simply buying and holding the Wilshire 5000 Index. Source: Hulbert Financial Digest.  It is not possible to invest directly in a market index.  Past performance is no guarantee of future performance.
#9  DO NOT TIME  THE MARKET Warren Buffett offered some useful counsel on this subject:  “We make no attempt to predict how security markets will behave; successfully forecasting short-term stock price movements is something we think neither we, nor anyone else, can do… We’ve long felt that the only value of stock market forecasters is to make fortune tellers look good.”
#9  DO NOT TIME  THE MARKET Market Prophecy is a Waste of Time Predicted   Actual   Margin Year S&P   S&P   of Gain   Gain   Error 1996 6.1% 26.0% 19.9% 1997 3.4% 31.0% 27.6% 1998 4.9% 26.7% 21.8% 1999 0.1% 19.5% 19.5% 2000 6.1% -10.1% 16.2% 2001 18.0% -12.1% 30.0% 2002 15.0% -22.1% 37.1% Source:  Business Week’s Consensus Yearend Forecast  The S&P 500 index is unmanaged and cannot be invested into directly.
Dollar-cost averaging involves spreading out your investments over several future time periods. This can significantly reduce the risk of being locked into a low equity return due to unusually bad timing in investing a lump sum. By investing at regular intervals, periods of adverse volatility may actually be working to the investor’s  advantage. REDUCE TIMING-RISK WITH DOLLAR-COST AVERAGING
Bear Market Building Dollar-Cost Averaging is a Potential Way to  Build Wealth in  Both  Bull  and  Bear Markets
Bear Market Building Dollar-Cost Averaging is An Effective Way to  Build Wealth in  Both  Bull  and  Bear Markets The above illustration is hypothetical; actual returns may vary in a different time period. Dollar cost averaging does not assure a profit or protect against a loss in a declining market. For the strategy to be effective, you must continue to purchases shares in both up and down markets. As such, an investor needs to consider his/her financial ability to continuously invest through periods of low price levels.  It is not possible to invest directly in a stock market index.  Past performance is no guarantee of future results.
Have your goals changed? Were the assumptions made two years ago still valid today? Do you need to adjust… Time, Risk Level, Amount Saved, Retirement Date, Desired Standard of Living at Retirement? #10 - UPDATE YOUR PLAN EVERY 2-YEARS
 YEAR 1 HAVE A LONG-TERM PLAN TO REACH MY FINANCIAL GOALS STARTING POINT
 YEAR 1 YEAR 2 HAVE A LONG-TERM PLAN TO REACH MY FINANCIAL GOALS STARTING POINT
Time is on your side Source: Thomson Financial as of 12/31/02 Past performance is no guarantee of future results.  The Standard & Poor’s 500 Index is an unmanaged group of large-company stocks. It is not available for direct investment. During the periods shown, a number of index stocks could have had significantly negative performance. It is possible for index performance to be positively or negatively influenced by a relatively small number of stocks. Stocks have offered positive performance more often than not ‘ 02  – 22.1% Time is on your side Source: Thomson Financial as of 12/31/02 Past performance is no guarantee of future results.  The Standard & Poor’s 500 Index is an unmanaged group of large-company stocks. It is not available for direct investment. During the periods shown, a number of index stocks could have had significantly negative performance. It is possible for index performance to be positively or negatively influenced by a relatively small number of stocks. 1954 52.6% ’ 58 43.4 ’ 95 37.6 ’ 75 37.3 ’ 97 33.4 ’ 80 32.5 ’ 85 31.7 ’ 89 31.7 ’ 55 31.6 ’ 91 30.5 ’ 72 18.9% ’ 98 28.6 ’86 18.7 ’ 61 26.8 ’79 18.5 ’ 51 24.0 ’52 18.4 ’ 92 7.6% ’ 67 24.0 ’88 16.6 ’56 6.6 1953 – 1.0% ’ 76 23.6 ’64 16.4 ’78 6.5 ’90  – 3.1 ’ 96 23.0 ’71 14.3 ’84 6.3 ’81  – 5.0 ’ 63 22.7 ’65 12.4 ’87 5.3 ’77  – 7.4 ’66  – 10.1% ’ 83 22.6 ’59 12.0 ’70 4.0 ’69  – 8.5 ’57  – 10.8 ’ 82 21.6 ’68 11.1 ’94 1.3 ’62  – 8.8 ’01  – 11.9 ‘02  – 22.1% ’ 99 21.1 ’93 10.1 ’60 0.5 ’00  – 9.1 ’73  – 14.8 ’74  – 26.9 Positive Returns Negative Returns 50-year 25-year 10-year 5-year 1-year S&P 500 Index 11.08% 12.60% 8.99% –1.62% –20.47% Average annual total returns through 9/30/02 > 20% 10% to 20% 0% to 10% -10% to 0% -20% to 0% < - 20% Stocks have offered positive performance more often than not 1954 52.6% ’ 58 43.4 ’ 95 37.6 ’ 75 37.3 ’ 97 33.4 ’ 80 32.5 ’ 85 31.7 ’ 89 31.7 ’ 55 31.6 ’ 91 30.5 ’72 18.9% ’ 98 28.6 ’86 18.7 ’ 61 26.8 ’79 18.5 ’ 51 24.0 ’52 18.4 ’92 7.6% ’ 67 24.0 ’88 16.6 ’56 6.6 1953 – 1.0% ’ 76 23.6 ’64 16.4 ’78 6.5 ’90  – 3.1 ’ 96 23.0 ’71 14.3 ’84 6.3 ’81  – 5.0 ’ 63 22.7 ’65 12.4 ’87 5.3 ’77  – 7.4 ’66  – 10.1% ’ 83 22.6 ’59 12.0 ’70 4.0 ’69  – 8.5 ’57  – 10.8 ’ 82 21.6 ’68 11.1 ’94 1.3 ’62  – 8.8 ’01  – 11.9 ‘ 02   – 22.1 % ’ 99 21.1 ’93 10.1 ’60 0.5 ’00  – 9.1 ’73  – 14.8 ’74  – 26.9 Positive returns Negative returns >20% 10% to 20% 0% to 10% – 10% to 0% – 20% to –10% <–20% 50-year 25-year 10-year 5-year 1-year S&P 500 Index 11.08% 12.60% 8.99% –1.62% –20.47% Average annual total returns  through 9/30/02
I already have a plan Do you know your chances of it succeeding? A plan is only as good as the assumptions within it Most plans are based on many poor assumptions
WHAT Bull and bear markets will occur and planning for them is important. Your average return has little to do with your investments. Aiming for higher return by taking on more risk might lower your odds. Having and adjusting a plan could be the single most important component in determining your success. learned? have we
POSITIVES FOR 2005 Economy Earnings Inflation Productivity Interest Rates Cash Federal Reserve
We will contact you within 48 hours to set up your complimentary consultation which will include a probability analysis of your current strategy. OUR COMMITMENT TO YOU
QUESTIONS? Securities offered through Royal Alliance Associates Inc., Member  NASD/SIPC   and an Investment Advisor

Ten Ways to Wealth

  • 1.
    TEN WAYS TOWEALTH Lon W. Broske, CFS
  • 2.
    TEN WAYS TOWEALTH 1. Have a long-term plan to reach 2 your goals 2. Do not follow the crowd 3. Do not speculate 4. Do not buy stocks on rumor 5. Do not use margin
  • 3.
    TEN WAYS TOWEALTH 6. Hire a professional financial advisor 7. Do not let emotion overrule logic 8. Own a diversified portfolio 9. Do not time the market 10.Update your plan every two years
  • 4.
    Define Specific Goals Define Your Investment Objectives Know Your Risk Tolerance Build A Portfolio That Fits Your Objectives And Your Risk Tolerance #1 HAVE A LONG-TERM PLAN TO REACH MY FINANCIAL GOALS
  • 5.
    #2 DO NOT FOLLOW THE CROWD Inflows of new cash into certain sectors are almost entirely driven by the most recent performance of that sector. The most common mistake investors make is to pile into “hot” sectors that have become extremely overvalued. Source: Morningstar, Inc. Past performance is no guarantee of future results.
  • 6.
    DO NOT FOLLOW THE CROWD The Morgan Stanley Hi-Tech Index returned 111% in 1999. In the first 3 months of 2000, investors poured nearly $34 billion into this sector. Result? For the 5 years ending 8-31-05, the Hi-Tech Index lost 89% of its value. Source: Commodity Systems, Inc., Lipper Inc., Past performance is no guarantee of future results. The Morgan Stanley Technology Index is unmanaged and cannot be invested into directly. 1999 was a period of unusually high performance for the technology sector.
  • 7.
    HAZARDS OF CHASINGPAST PERFORMANCE: Source: Commodity Systems, Inc., NAREIT Booms and Busts Examples of large variances from year to year Gold/ Equity Year Silver REIT Hi-Tech End Index Index Index 1993 85% 1994 -17% 1997 13% 1998 -22% 1999 111% 2000 -27% The Philadelphia Stock Exchange Gold/Silver Index, the Nareit Equity Index, and the Morgan Stanley Technology Index are all unmanaged and cannot be invested into directly. 1999 was a period of unusually high performance for the technology sector. Past performance is no guarantee of future results.
  • 8.
    #3 DONOT SPECULATE “ Everyone knows that most people who speculate or gamble in the market lose money at it in the end. The people who persist in trying it are either unintelligent or willing to lose money for the fun of the game…In any case, they are not really investors at all.” -- Benjamin Graham R W = Q + T + D
  • 9.
    #4 DONOT BUY STOCKS ON RUMOR
  • 10.
    #5 DONOT USE MARGIN “What’s in Your Wallet?”
  • 11.
    #5 DONOT USE MARGIN “What’s in Your Wallet?” Borrowing money to buy stock dramatically increases your risk You have to pay interest on the money you borrow to buy the stock on margin A margin call could force you to sell your stock at a depressed price
  • 12.
    Assume that shortlyafter Berkshire Hathaway acquired General Re in April 1998, a friend told you that “No one has ever lost money in Berkshire, and this is the biggest bet that Warren Buffett has ever made.” A Margin Horror Story
  • 13.
    You decide tobuy 10 shares of Berkshire Class A on June 22, 1998 for $84,000 per share-- an $840,000 total investment. Feeling confident, you decide to use 50% margin…. Unfortunately Berkshire declines to $40,800 by February of 2000. Unable to put up more margin, you are forced to sell. Your $420,000 investment is now worth ZERO. By the end of 2002, Berkshire recovers to $72,750, but unfortunately, you were forced out of your position.
  • 14.
    #6 Hirea Professional Financial Advisor
  • 15.
    WHY HIRE APROFESSIONAL FINANCIAL ADVISOR? Quality advice can make a difference. To help you work toward financial security. To help you clarify your goals and identify your ability to withstand market fluctuations.
  • 16.
    WHY HIRE APROFESSIONAL FINANCIAL ADVISOR? To develop and monitor a diversified portfolio designed to help you meet your goals. To help you remain “on course” with your long term objectives especially in those times when it is emotionally difficult to do so.
  • 17.
    WHY HIRE APROFESSIONAL FINANCIAL ADVISOR? To help you get your financial matters in order so you are prepared for the unexpected. To help you maximize tax savings and take advantage of money saving opportunities. “Our job is not to make you rich, but to save you from becoming poor.”
  • 18.
    What do eachof the following have in common?
  • 19.
    ANSWER: THEYALL HAVE PERSONAL COACHES
  • 20.
    A Professional Advisor’s Most Important Job According to University of Nebraska Sports Psychologist, Dr. Jack Stark: “ Behavior management is probably the most important element in the service that a professional financial advisor can provide for his clients.”
  • 21.
    #7 DONOT LET EMOTION OVERRULE LOGIC Do not let the news of the day distract you from your long-term plan.
  • 22.
    The Cycle ofMarket Emotions Optimism Excitement Thrill Euphoria Anxiety Denial Fear Desperation Capitulation Panic Despondency Depression Hope Relief Optimism Point of Maximum Financial Opportunity - Investors Realize Investment Opportunity Point of Maximum Financial Risk - Investors Beware of Higther Investment Risk
  • 23.
    Bear Markets MayProvide Opportunity December 1957 43.4% 13.3% 12.8% June 1962 31.0% 14.2% 10.4% September 1966 30.5% 8.7% 6.9% June 1970 41.9% 9.3% 9.0% September 1974 38.1% 16.7% 15.6% July 1982 59.3% 29.6% 19.2% November 1987 23.3% 17.3% 18.7% October 1990 33.5% 17.3% 19.4% August 1998 39.8% 13.19 – Average 37.9% 15.8% 14.0% Source: Thomson Financial - Past performance is no guarantee of future results. Returns shown are for the Standard & Poor’s 500 Index. The S&P 500 index is unmanaged and cannot be invested into directly. End date of Bear market 10 years later 5 years later 1 years later
  • 24.
    S&P 500 vs“Panic Points” It is not possible to invest directly in a market index. Past performance is no guarantee of future performance. Since World War II
  • 25.
    If, at December31, 1925, you knew what was coming 1929 - Stock Market crashes 1933 - U.S. banks closed, depression 1939 - World War II begins 1941 - Japan bombs Pearl Harbor 1950 - Korean War begins 1962 - Cuban Missile Crisis 1963 - Kennedy assassinated 1973 - OPEC oil embargo 1974 -Nixon Resigns, Watergate 1980 - Inflation rate rises to 14% 1982 - Worst recession in 50 years 1987 - Dow crashes 23 % in one day 1989 - S&L crisis, $500bn bailout 1990 - Persian Gulf War, recession 1997 - Asian financial crisis 1998 - Russian default 1999 - Clinton impeachment trials 2001 - Terrorist attacks on America
  • 26.
    Stocks? T-Bills? Whatwould you have invested in?
  • 27.
    If you answered“stocks”, you would have been right: Ibbotson Associates cumulative total return indices for S&P 500 and 3-Month Treasury Bills. It is not possible to invest directly in an index. Past performance is no guarantee of future results. Stocks T-Bills Reflects the growth of $10,000 invested on Dec. 31, 1927 to Dec. 31, 2004 $174,400 $9,799,411
  • 28.
    What if youwanted to seek preservation of principal?
  • 29.
    T-BILLS MAY NOTBE THE BEST SOLUTION….” After inflation and taxes, $10,000 continuously reinvested in 3-month T-bills was worth only $5,221 . Your after-tax, inflation-adjusted purchasing power would’ve been reduced by 48% after having invested for 76 years ! Ibbotson Associates cumulative total return indices for 3-Month Treasury Bills adjusted for both inflation and taxes. Investment period from 12/31/25 - 12/31/01. It is not possible to invest directly in an index. Past performance is no guarantee of future results. Your results will vary. Taxes are based upon the top marginal personal income tax rate in the U.S. each year. Inflation is based upon the change in the Consumer Price Index.
  • 30.
  • 31.
    #8 OWNA DIVERSIFIED PORTFOLIO Assume it is 12/31/71 and you are blessed with perfect foresight about these annual asset class returns over the next 29 years. How would you allocate your retirement plan? Indices used to represent asset classes depicted above are the S&P 500, the Morgan Stanley EAFE Index, the NAREIT Equity REITs Index and the Goldman Sachs Commodity Total Return Index, respectively. It is not possible to invest directly in a market index. Past performance is no guarantee of future performance.
  • 32.
    ANDTHE WINNER IS... By combining four non-correlated asset classes, you were actually able to obtain a portfolio return which is higher than any of the four individual asset classes in which you invested and with less risk! The “25% of Each” Portfolio was rebalanced on January 1 of each year, 1972-2000. Indices used to represent asset classes depicted above are the S&P 500, the Morgan Stanley EAFE Index, the NAREIT Equity REITs Index and the Goldman Sachs Commodity Total Return Index, respectively. It is not possible to invest directly in a market index. Past performance is no guarantee of future performance.
  • 33.
    Why Diversify? Because Winners Rotate: The indices used for Large-cap, Small-cap, Real Estate, and Foreign Stocks are the S&P 500, Russell 2000, NAREIT Equity REITs Index, and the Morgan Stanley EAFE Index, respectively. One cannot invest directly in an index. Past performance does not guarantee future results. LARGE- SMALL- REAL YEAR COMPANY COMPANY ESTATE FOREIGN STOCKS STOCKS STOCKS STOCKS 1982 21.6 25.0 21.6 -1.9 1983 22.6 29.1 30.6 23.7 1984 6.3 -7.3 20.9 7.4 1985 31.7 31.1 19.1 56.2 1986 18.7 5.7 19.2 69.4 1987 5.3 -8.8 -3.6 24.6 1988 16.6 25.0 13.5 28.3 1989 31.6 16.3 8.8 10.5 1990 -3.1 -19.5 -15.4 -23.5 1991 30.4 46.0 35.7 12.1 1992 7.6 18.4 14.6 -12.2 1993 10.1 18.9 19.7 32.6 1994 1.3 -1.8 3.2 7.8 1995 37.5 28.5 15.3 11.2 1996 23.0 16.5 35.3 6.1 1997 33.4 22.4 20.3 1.8 1998 28.6 -2.6 -17.5 20.0 1999 21.0 21.3 -4.6 27.0 2000 -9.1 -3.0 26.4 -14.0 2001 -11.9 2.5 13.9 -21.4 2002 -22.1 -20.5 3.9 -15.9
  • 34.
    Which $100,000 investmentwould have a higher return over 20 years? A guaranteed interest rate of 8% per year or- An equal- weighted portfolio of five asset classes with the following returns: A has a 100% loss B returns 0% a year C returns 5% a year D returns 10% a year E returns 20% a year
  • 35.
    $100,000 grew to $466,096 when invested at a fixed return of 8%. $100,000 grew to $974,376 in the diversified portfolio despite a total loss on one asset and a zero return on another asset. This is a hypothetical case and is not representative of any specific securities Diversification can enable one to offset disappointing results on individual holdings and offer the potential for rewarding long-term portfolio returns.
  • 36.
    #9 DONOT TIME THE MARKET Mark Hulbert runs the Hulbert Financial Digest, which independently monitors the investment performance of stock market newsletters Hulbert has tracked 137 newsletters since 1980 There is no evidence of any market-timing ability even by those who make it a full time job: Only 4 of 137 (2.9%) outperformed the performance of simply buying and holding the Wilshire 5000 Index. Source: Hulbert Financial Digest. It is not possible to invest directly in a market index. Past performance is no guarantee of future performance.
  • 37.
    #9 DONOT TIME THE MARKET Warren Buffett offered some useful counsel on this subject: “We make no attempt to predict how security markets will behave; successfully forecasting short-term stock price movements is something we think neither we, nor anyone else, can do… We’ve long felt that the only value of stock market forecasters is to make fortune tellers look good.”
  • 38.
    #9 DONOT TIME THE MARKET Market Prophecy is a Waste of Time Predicted Actual Margin Year S&P S&P of Gain Gain Error 1996 6.1% 26.0% 19.9% 1997 3.4% 31.0% 27.6% 1998 4.9% 26.7% 21.8% 1999 0.1% 19.5% 19.5% 2000 6.1% -10.1% 16.2% 2001 18.0% -12.1% 30.0% 2002 15.0% -22.1% 37.1% Source: Business Week’s Consensus Yearend Forecast The S&P 500 index is unmanaged and cannot be invested into directly.
  • 39.
    Dollar-cost averaging involvesspreading out your investments over several future time periods. This can significantly reduce the risk of being locked into a low equity return due to unusually bad timing in investing a lump sum. By investing at regular intervals, periods of adverse volatility may actually be working to the investor’s advantage. REDUCE TIMING-RISK WITH DOLLAR-COST AVERAGING
  • 40.
    Bear Market BuildingDollar-Cost Averaging is a Potential Way to Build Wealth in Both Bull and Bear Markets
  • 41.
    Bear Market BuildingDollar-Cost Averaging is An Effective Way to Build Wealth in Both Bull and Bear Markets The above illustration is hypothetical; actual returns may vary in a different time period. Dollar cost averaging does not assure a profit or protect against a loss in a declining market. For the strategy to be effective, you must continue to purchases shares in both up and down markets. As such, an investor needs to consider his/her financial ability to continuously invest through periods of low price levels. It is not possible to invest directly in a stock market index. Past performance is no guarantee of future results.
  • 42.
    Have your goalschanged? Were the assumptions made two years ago still valid today? Do you need to adjust… Time, Risk Level, Amount Saved, Retirement Date, Desired Standard of Living at Retirement? #10 - UPDATE YOUR PLAN EVERY 2-YEARS
  • 43.
     YEAR 1HAVE A LONG-TERM PLAN TO REACH MY FINANCIAL GOALS STARTING POINT
  • 44.
     YEAR 1YEAR 2 HAVE A LONG-TERM PLAN TO REACH MY FINANCIAL GOALS STARTING POINT
  • 45.
     YEAR 1YEAR 2 HAVE A LONG-TERM PLAN TO REACH MY FINANCIAL GOALS STARTING POINT
  • 46.
    Time is onyour side Source: Thomson Financial as of 12/31/02 Past performance is no guarantee of future results. The Standard & Poor’s 500 Index is an unmanaged group of large-company stocks. It is not available for direct investment. During the periods shown, a number of index stocks could have had significantly negative performance. It is possible for index performance to be positively or negatively influenced by a relatively small number of stocks. Stocks have offered positive performance more often than not ‘ 02 – 22.1% Time is on your side Source: Thomson Financial as of 12/31/02 Past performance is no guarantee of future results. The Standard & Poor’s 500 Index is an unmanaged group of large-company stocks. It is not available for direct investment. During the periods shown, a number of index stocks could have had significantly negative performance. It is possible for index performance to be positively or negatively influenced by a relatively small number of stocks. 1954 52.6% ’ 58 43.4 ’ 95 37.6 ’ 75 37.3 ’ 97 33.4 ’ 80 32.5 ’ 85 31.7 ’ 89 31.7 ’ 55 31.6 ’ 91 30.5 ’ 72 18.9% ’ 98 28.6 ’86 18.7 ’ 61 26.8 ’79 18.5 ’ 51 24.0 ’52 18.4 ’ 92 7.6% ’ 67 24.0 ’88 16.6 ’56 6.6 1953 – 1.0% ’ 76 23.6 ’64 16.4 ’78 6.5 ’90 – 3.1 ’ 96 23.0 ’71 14.3 ’84 6.3 ’81 – 5.0 ’ 63 22.7 ’65 12.4 ’87 5.3 ’77 – 7.4 ’66 – 10.1% ’ 83 22.6 ’59 12.0 ’70 4.0 ’69 – 8.5 ’57 – 10.8 ’ 82 21.6 ’68 11.1 ’94 1.3 ’62 – 8.8 ’01 – 11.9 ‘02 – 22.1% ’ 99 21.1 ’93 10.1 ’60 0.5 ’00 – 9.1 ’73 – 14.8 ’74 – 26.9 Positive Returns Negative Returns 50-year 25-year 10-year 5-year 1-year S&P 500 Index 11.08% 12.60% 8.99% –1.62% –20.47% Average annual total returns through 9/30/02 > 20% 10% to 20% 0% to 10% -10% to 0% -20% to 0% < - 20% Stocks have offered positive performance more often than not 1954 52.6% ’ 58 43.4 ’ 95 37.6 ’ 75 37.3 ’ 97 33.4 ’ 80 32.5 ’ 85 31.7 ’ 89 31.7 ’ 55 31.6 ’ 91 30.5 ’72 18.9% ’ 98 28.6 ’86 18.7 ’ 61 26.8 ’79 18.5 ’ 51 24.0 ’52 18.4 ’92 7.6% ’ 67 24.0 ’88 16.6 ’56 6.6 1953 – 1.0% ’ 76 23.6 ’64 16.4 ’78 6.5 ’90 – 3.1 ’ 96 23.0 ’71 14.3 ’84 6.3 ’81 – 5.0 ’ 63 22.7 ’65 12.4 ’87 5.3 ’77 – 7.4 ’66 – 10.1% ’ 83 22.6 ’59 12.0 ’70 4.0 ’69 – 8.5 ’57 – 10.8 ’ 82 21.6 ’68 11.1 ’94 1.3 ’62 – 8.8 ’01 – 11.9 ‘ 02 – 22.1 % ’ 99 21.1 ’93 10.1 ’60 0.5 ’00 – 9.1 ’73 – 14.8 ’74 – 26.9 Positive returns Negative returns >20% 10% to 20% 0% to 10% – 10% to 0% – 20% to –10% <–20% 50-year 25-year 10-year 5-year 1-year S&P 500 Index 11.08% 12.60% 8.99% –1.62% –20.47% Average annual total returns through 9/30/02
  • 47.
    I already havea plan Do you know your chances of it succeeding? A plan is only as good as the assumptions within it Most plans are based on many poor assumptions
  • 48.
    WHAT Bull andbear markets will occur and planning for them is important. Your average return has little to do with your investments. Aiming for higher return by taking on more risk might lower your odds. Having and adjusting a plan could be the single most important component in determining your success. learned? have we
  • 49.
    POSITIVES FOR 2005Economy Earnings Inflation Productivity Interest Rates Cash Federal Reserve
  • 50.
    We will contactyou within 48 hours to set up your complimentary consultation which will include a probability analysis of your current strategy. OUR COMMITMENT TO YOU
  • 51.
    QUESTIONS? Securities offeredthrough Royal Alliance Associates Inc., Member NASD/SIPC and an Investment Advisor

Editor's Notes

  • #47 Mandatory script: Okay, you understand that historically stocks have offered better returns. But aren’t they pretty volatile? Yes, they can be, and we’re seeing that right now. But the fact remains, if you look at the long term, stocks have offered positive performance more often than not.