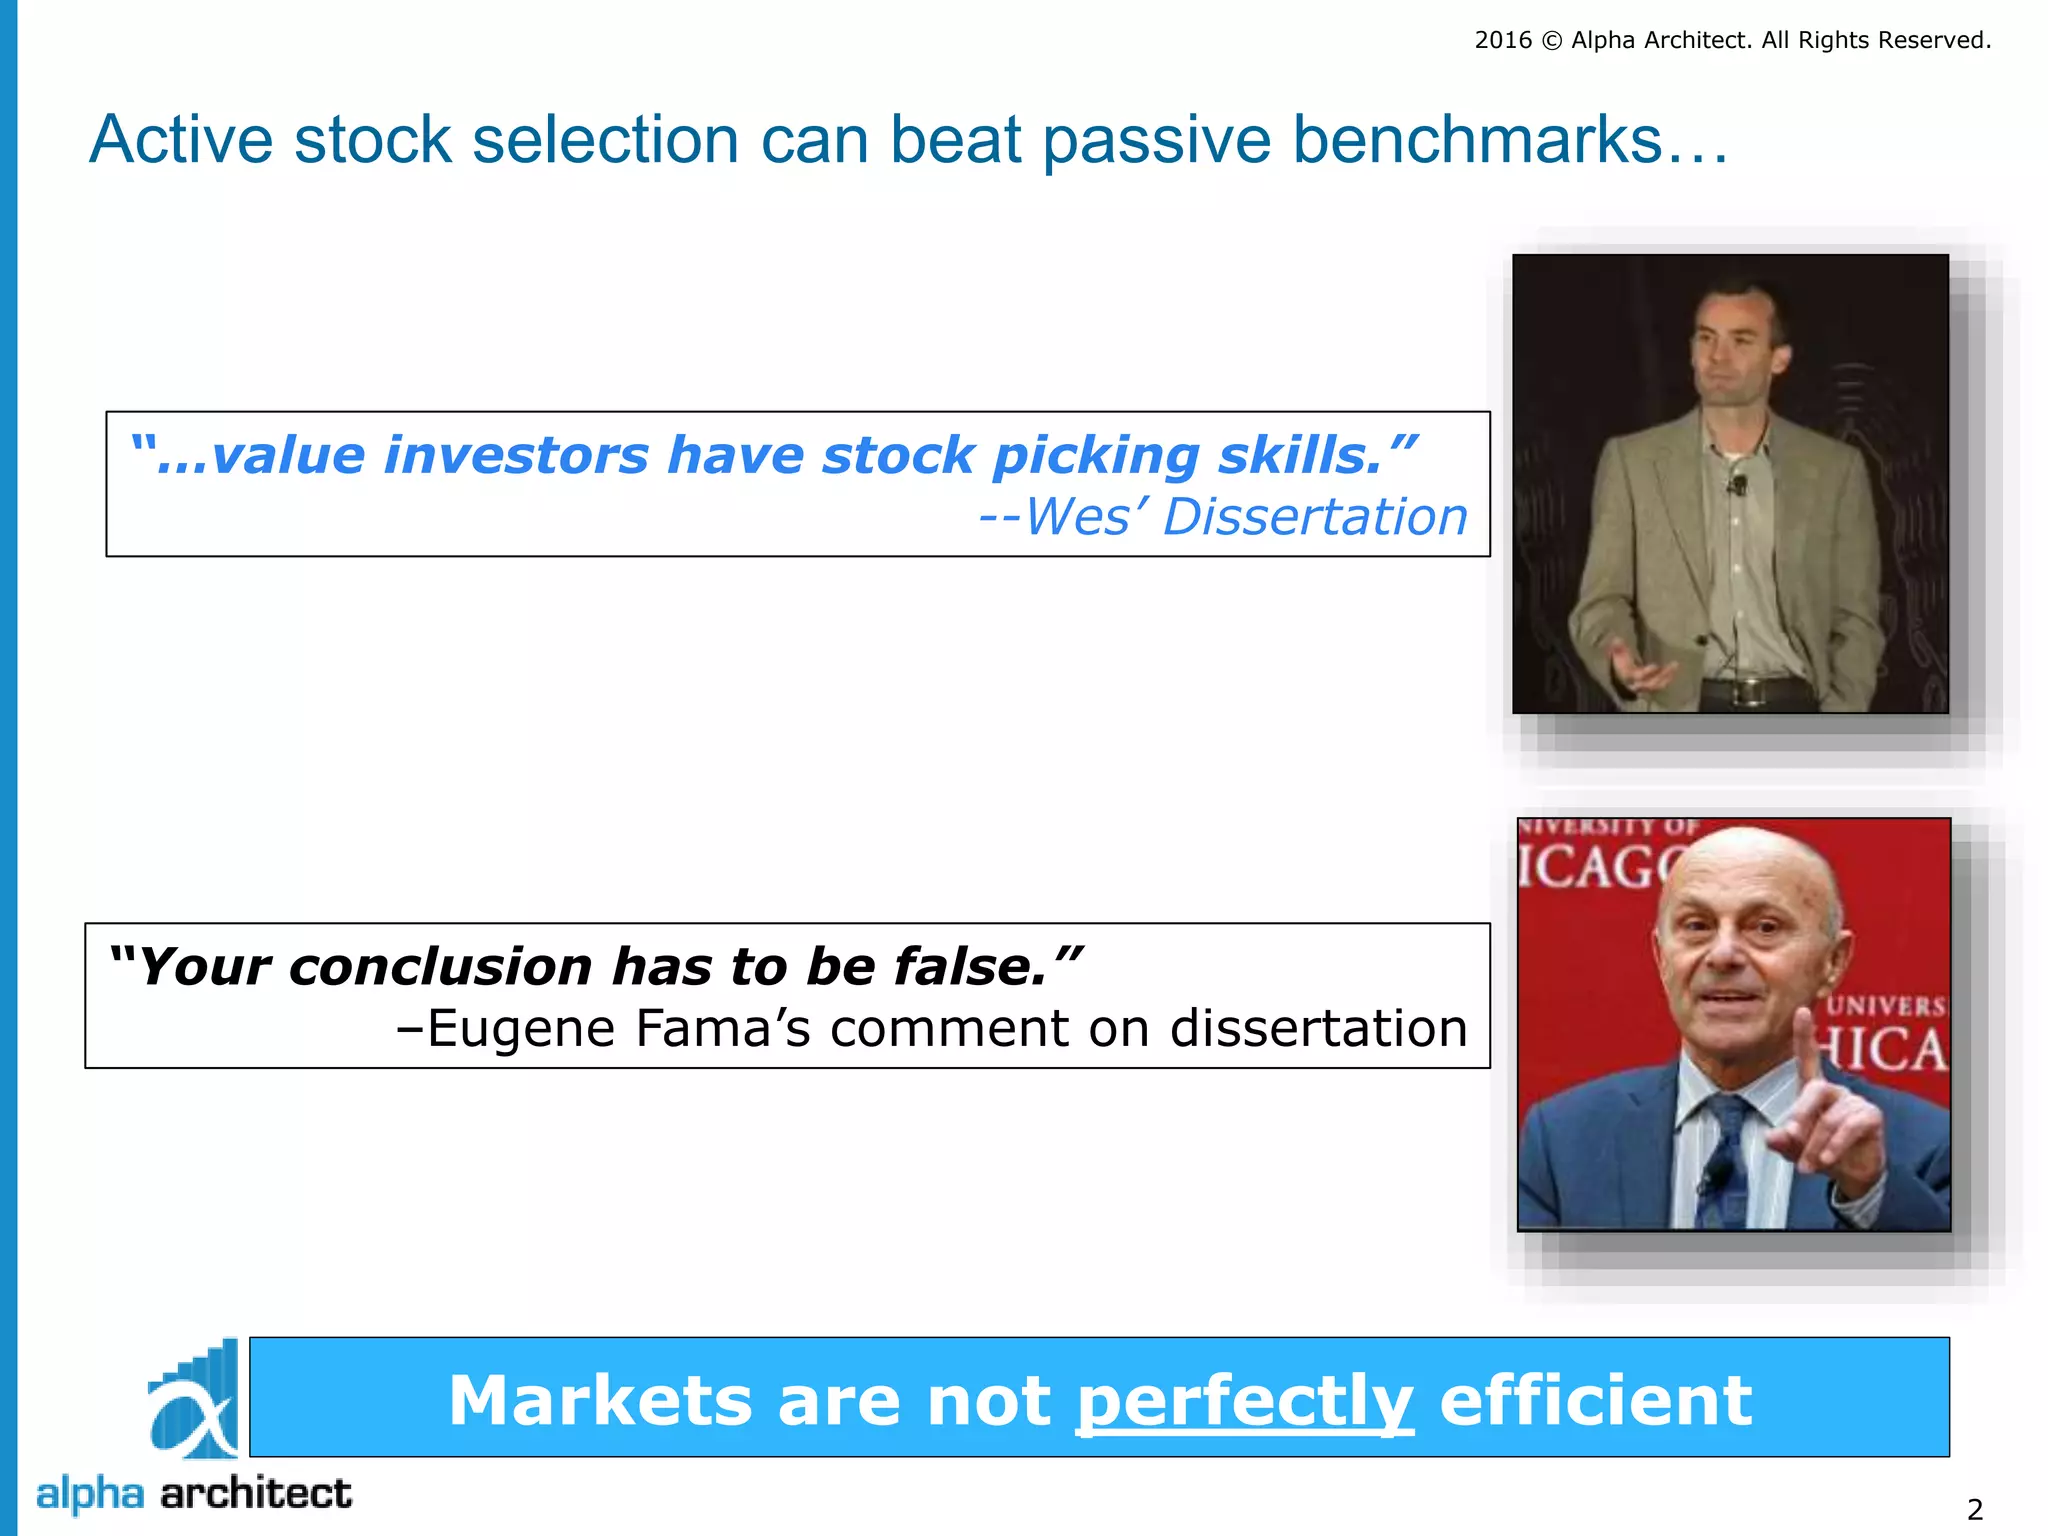
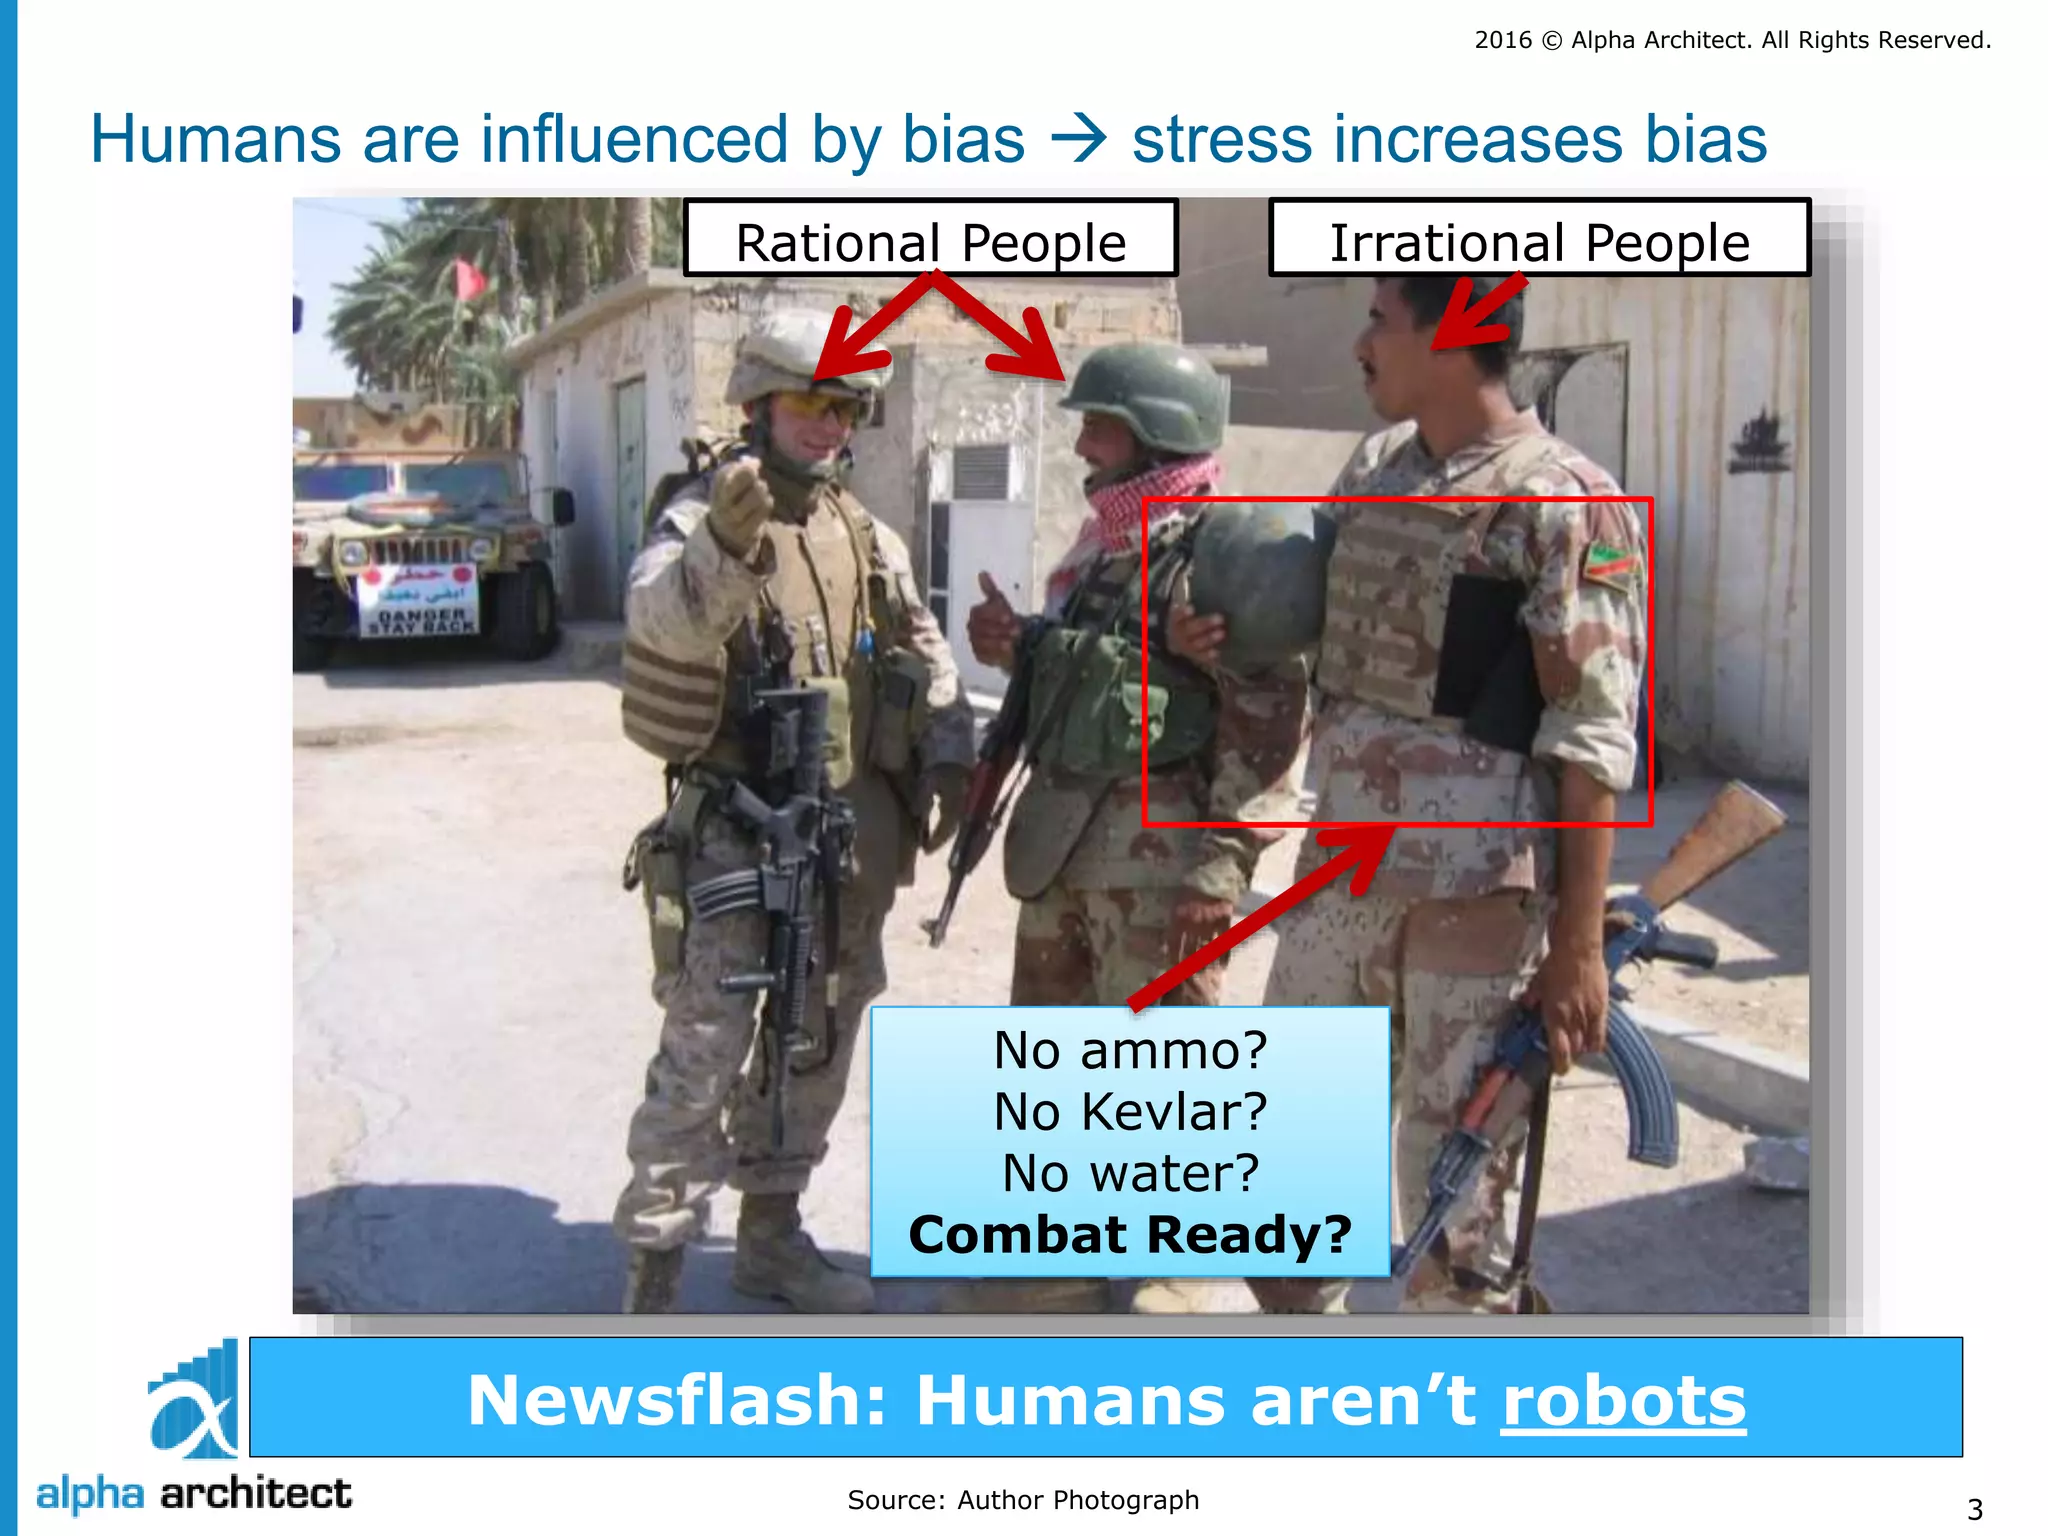
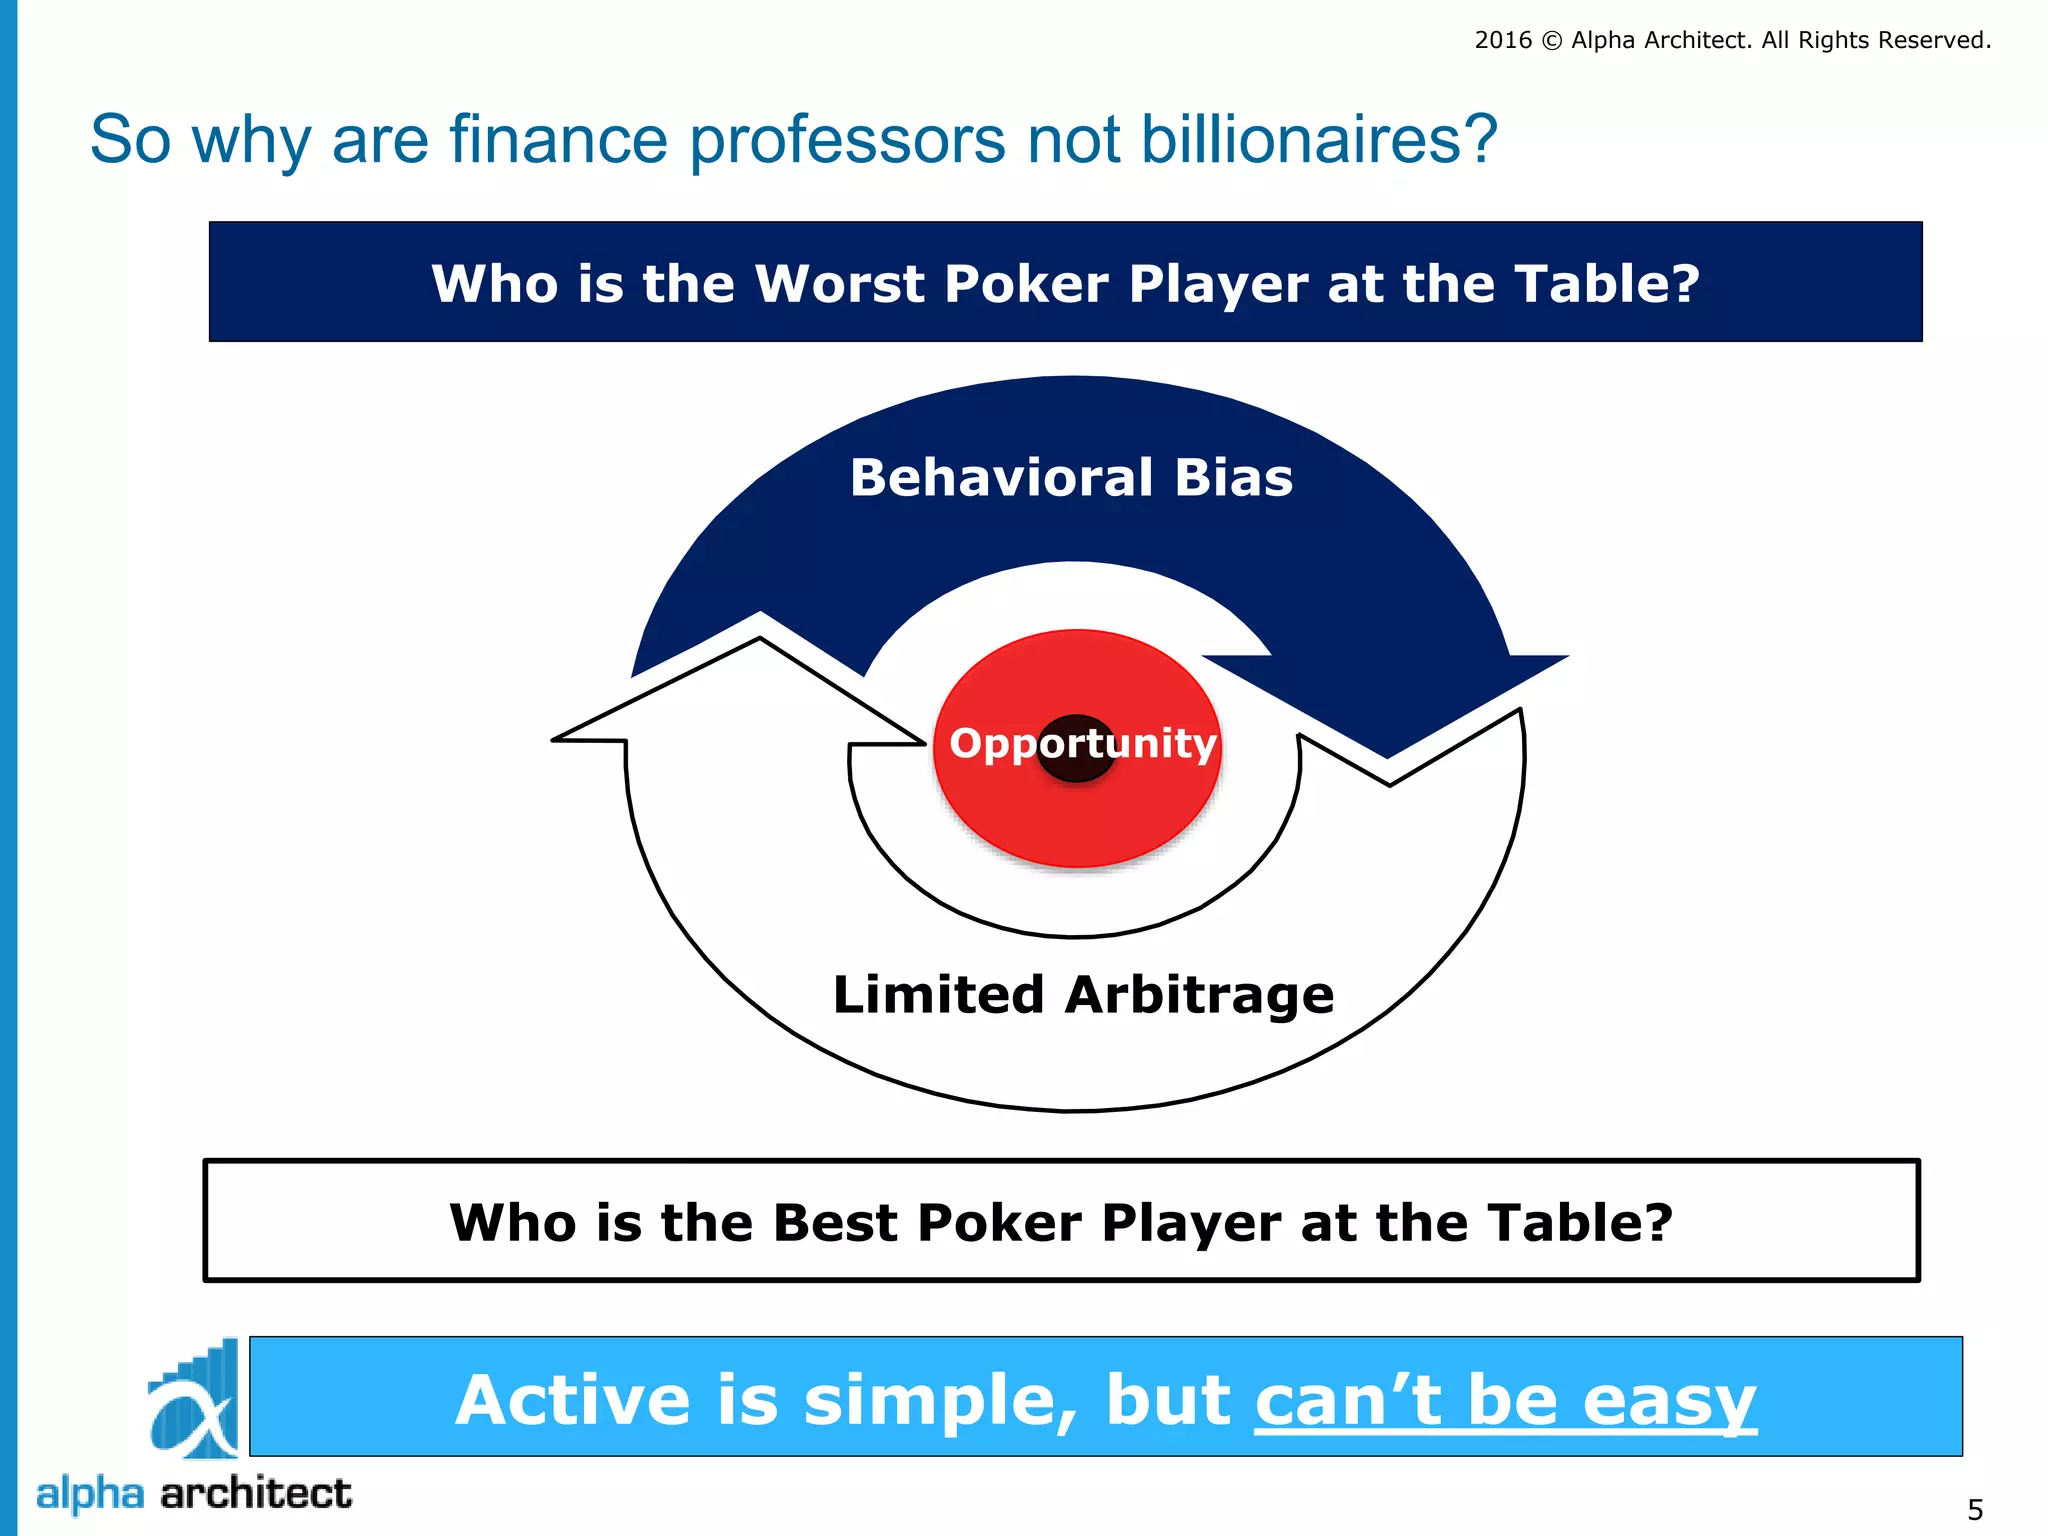
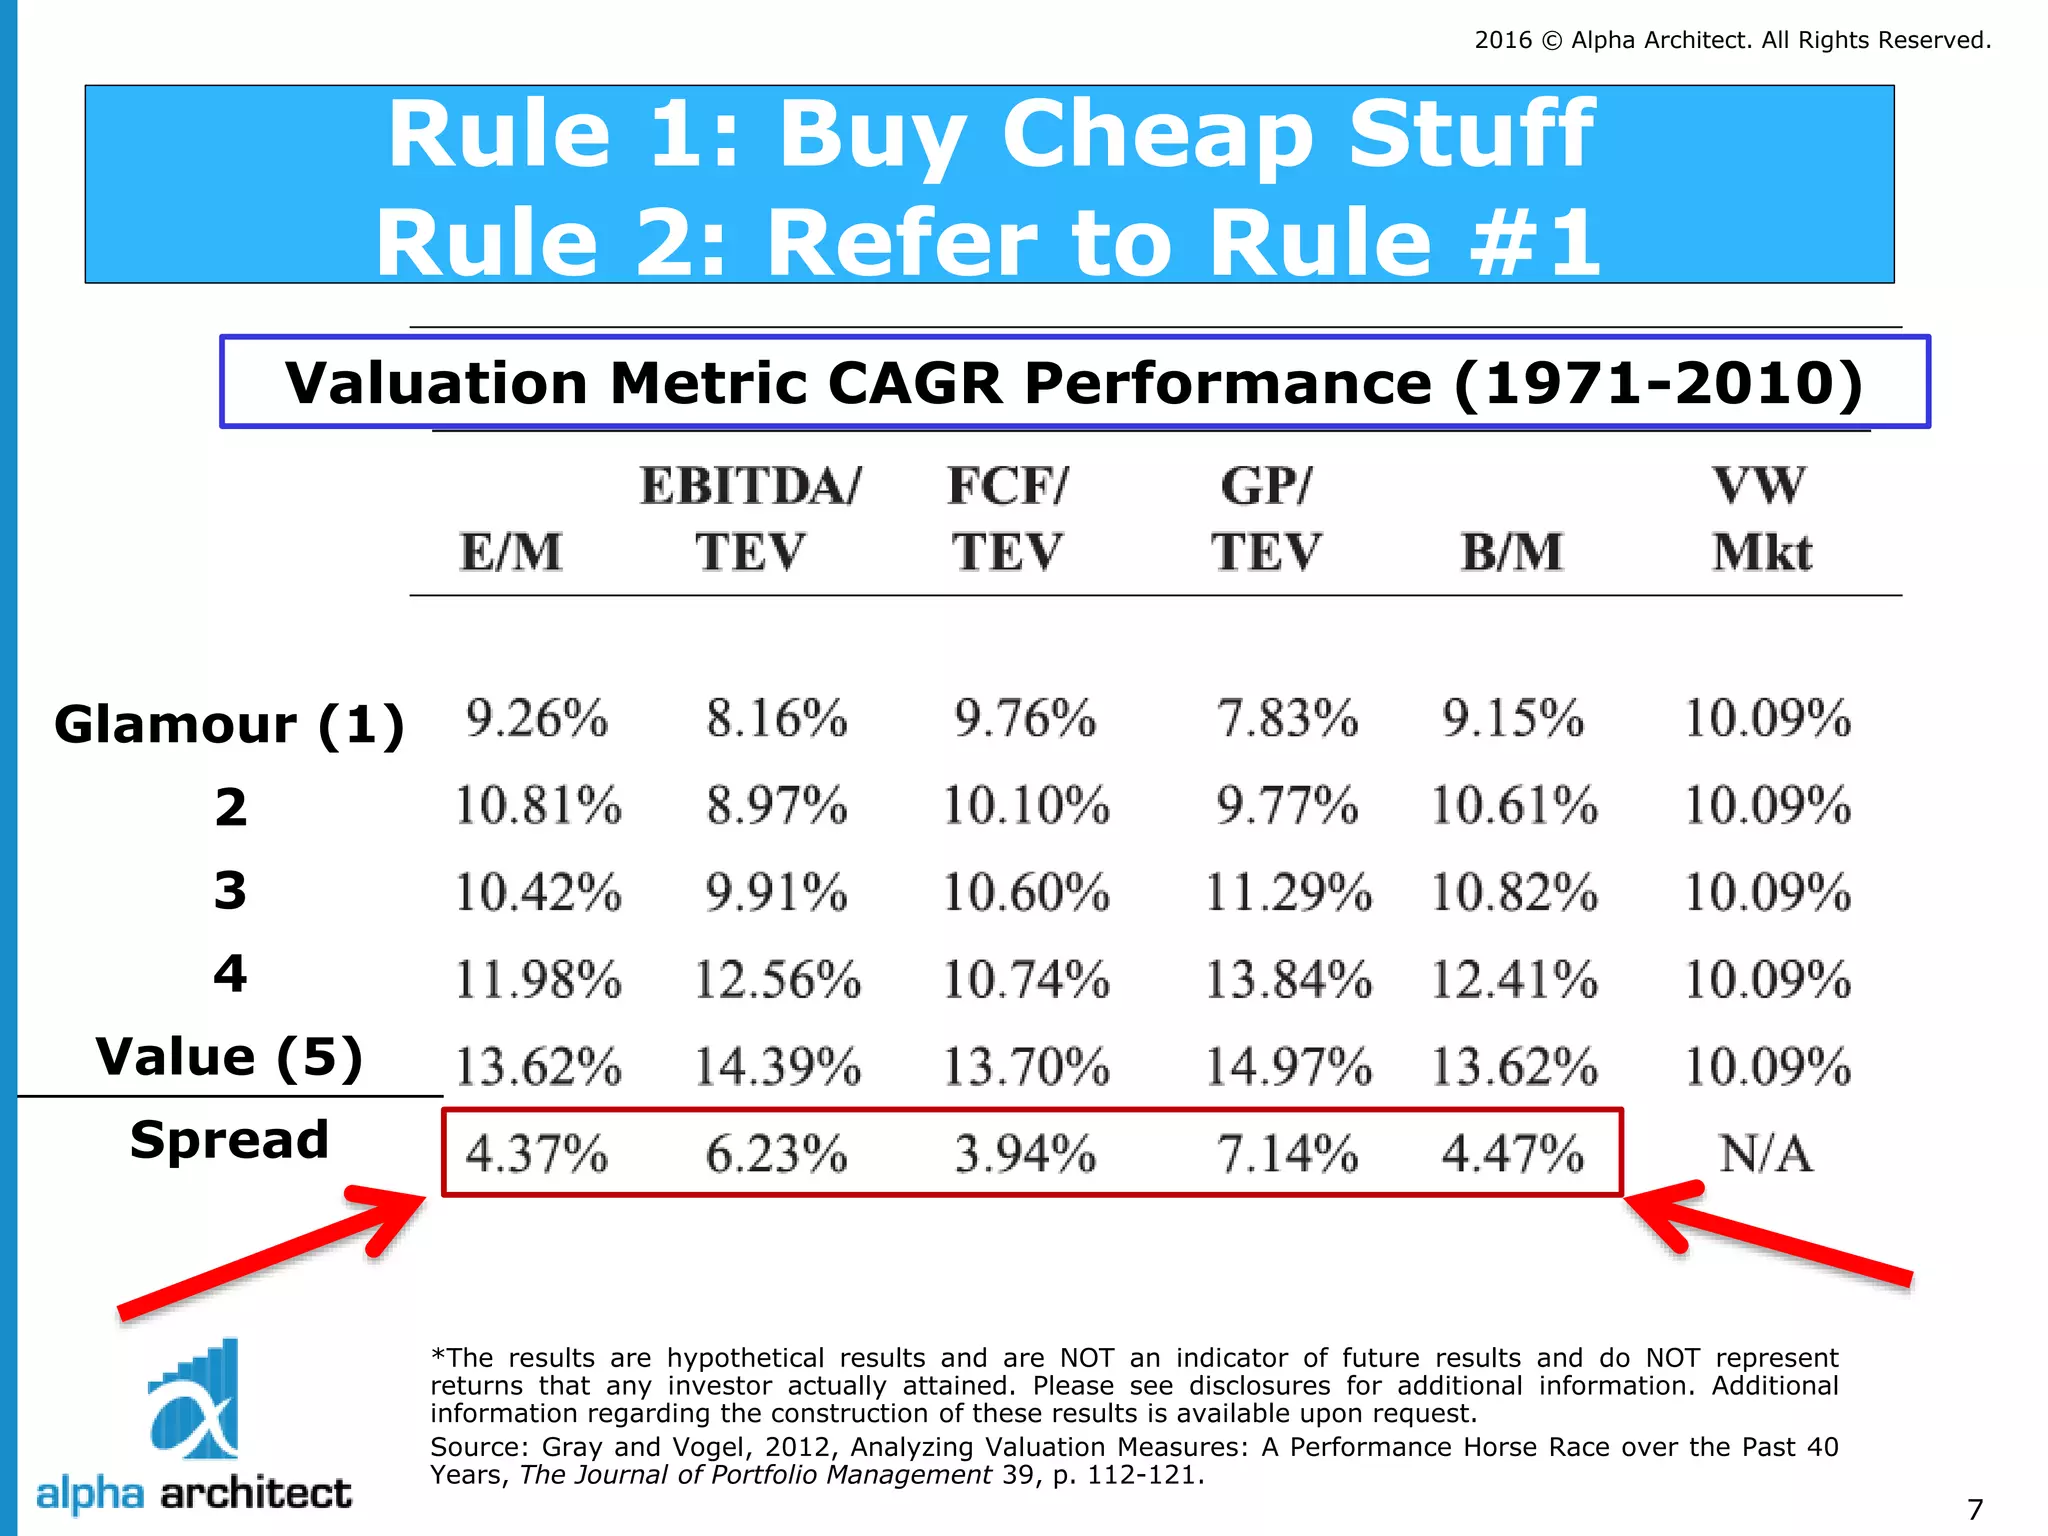
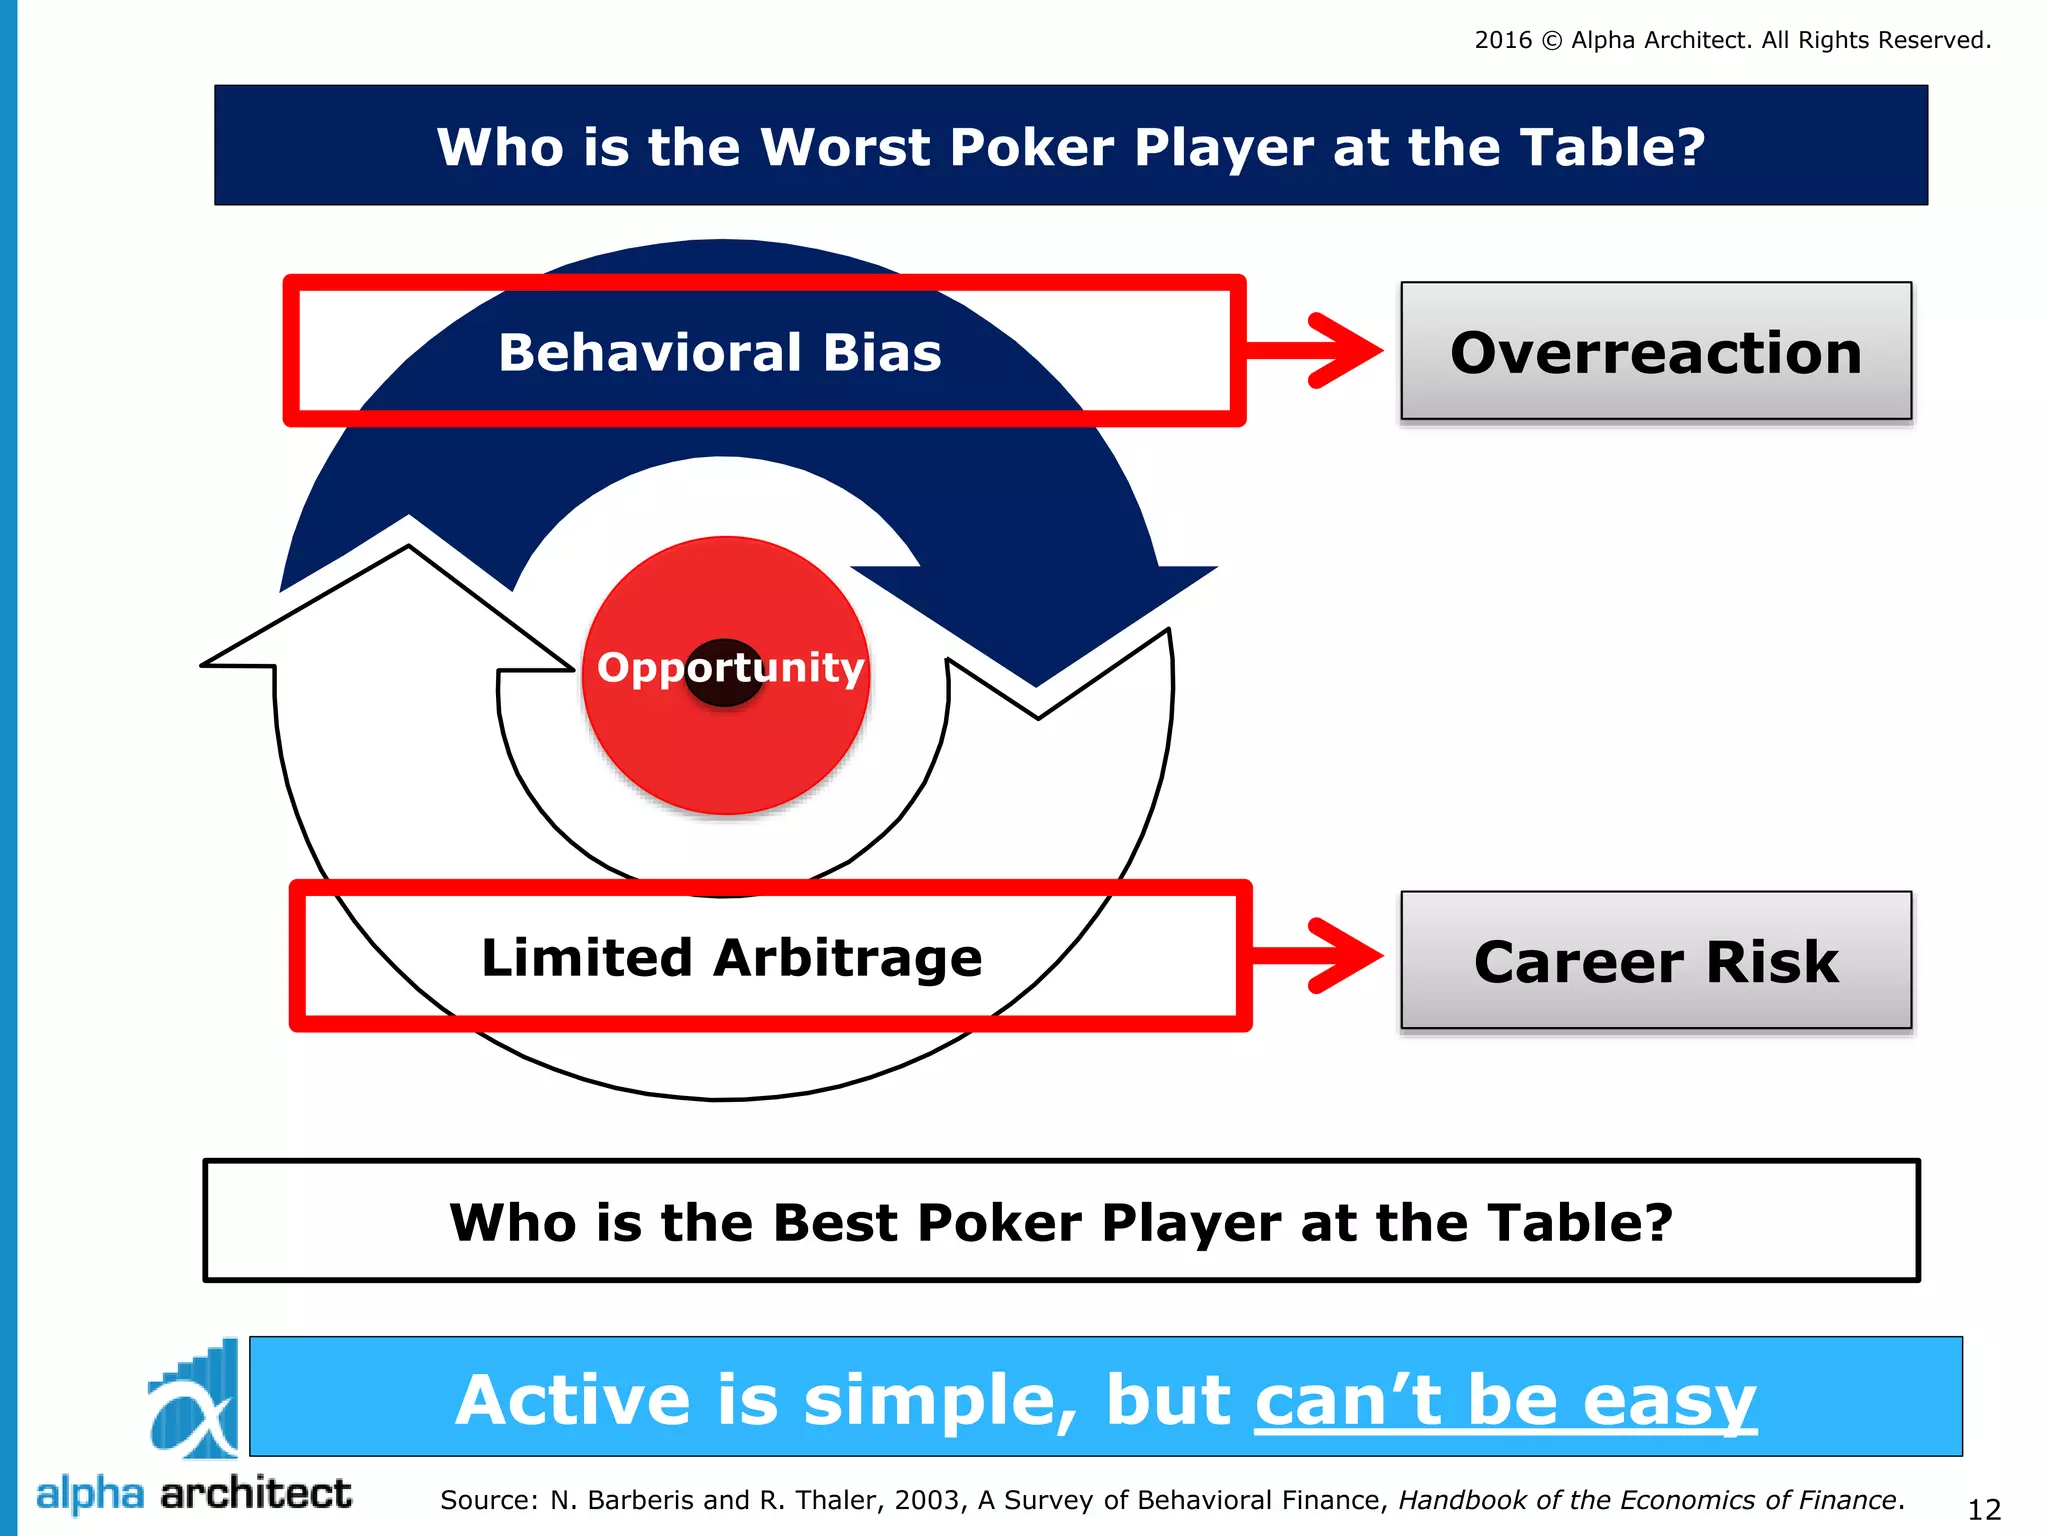
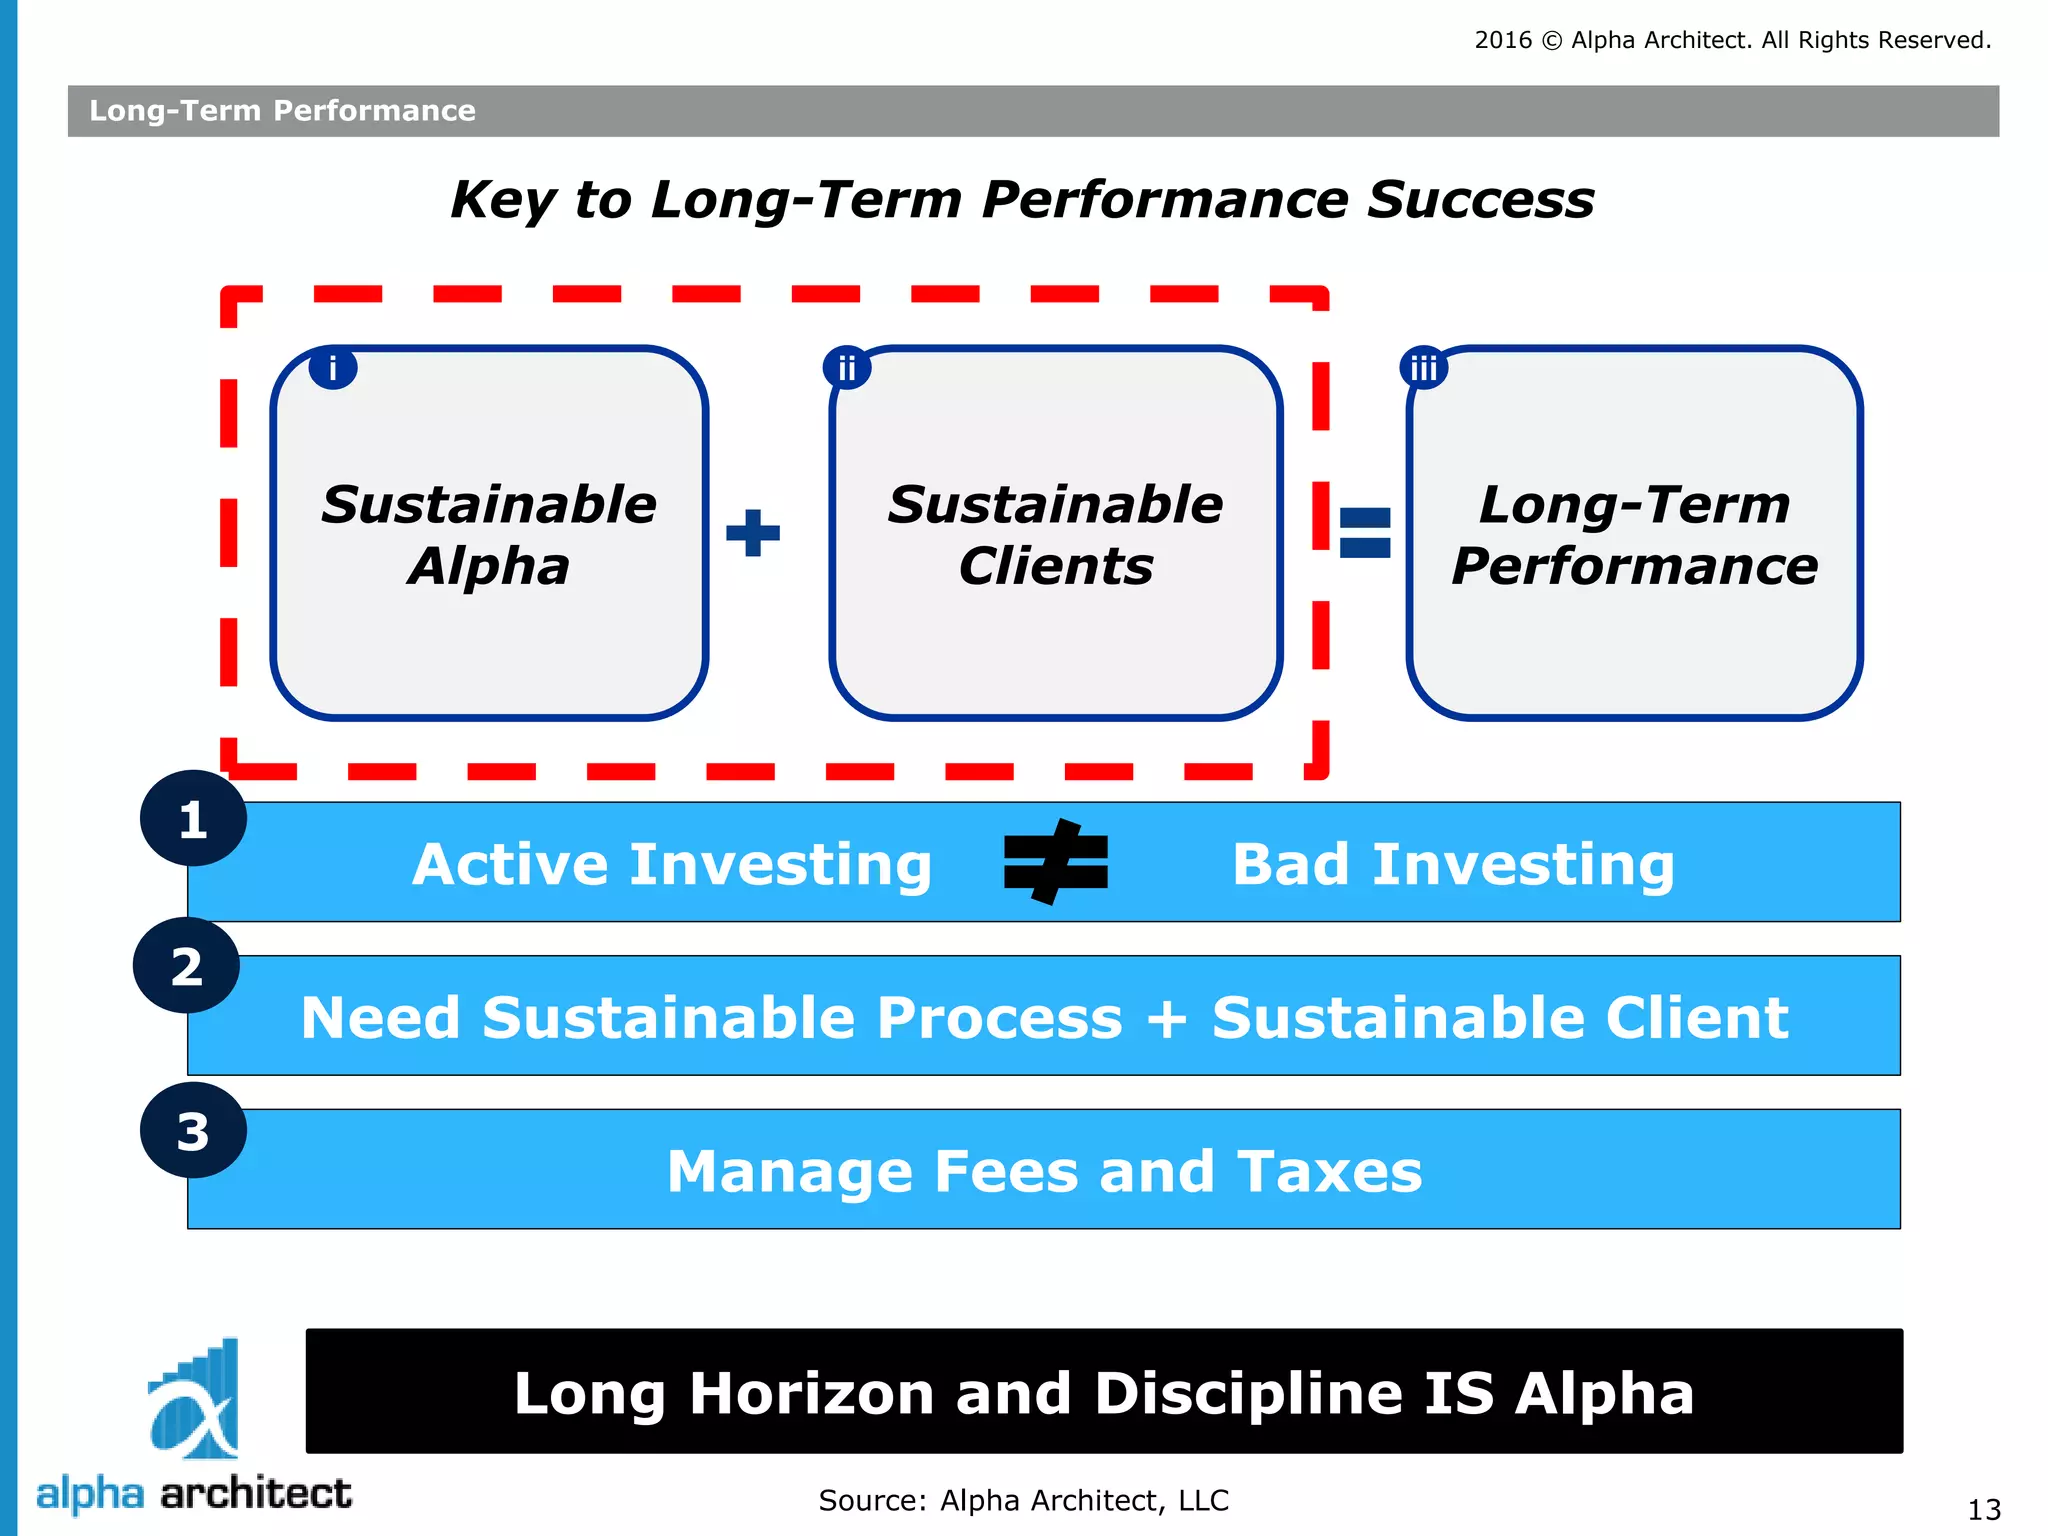
Wesley R. Gray, PhD
T: +1.215.882.9983
F: +1.216.245.3686
ir@AlphaArchitect.com
213 Foxcroft Road
Broomall, PA 19008
Affordable Active Management | Built to Beat Behavioral Bias | We Empower Investors Through Education
Prepared: 4/14/2016
ACTIVE INVESTING IS SIMPLE; BUT NOT EASY
2016 © Alpha Architect. All Rights Reserved.
2
Markets are not perfectly efficient
“Your conclusion has to be false.”
–Eugene Fama’s comment on dissertation
“…value investors have stock picking skills.”
--Wes’ Dissertation
Active stock selection can beat passive benchmarks…
2016 © Alpha Architect. All Rights Reserved.
3
No ammo?
No Kevlar?
No water?
Combat Ready?
Rational People Irrational People
Newsflash: Humans aren’t robots
Source: Author Photograph
Humans are influenced by bias  stress increases bias
2016 © Alpha Architect. All Rights Reserved.
4
Markets are not Perfectly Efficient
Human Beings Can Be Irrational!
We are All Going to Be Rich!
???
2016 © Alpha Architect. All Rights Reserved.
5
Behavioral Bias
Limited Arbitrage
Who is the Worst Poker Player at the Table?
Who is the Best Poker Player at the Table?
Opportunity
So why are finance professors not billionaires?
Active is simple, but can’t be easy
2016 © Alpha Architect. All Rights Reserved.
6
Behavioral Bias
Limited Arbitrage
Who is the Worst Poker Player at the Table?
Who is the Best Poker Player at the Table?
Opportunity
2016 © Alpha Architect. All Rights Reserved.
7
*The results are hypothetical results and are NOT an indicator of future results and do NOT represent
returns that any investor actually attained. Please see disclosures for additional information. Additional
information regarding the construction of these results is available upon request.
Source: Gray and Vogel, 2012, Analyzing Valuation Measures: A Performance Horse Race over the Past 40
Years, The Journal of Portfolio Management 39, p. 112-121.
Rule 1: Buy Cheap Stuff
Rule 2: Refer to Rule #1
Glamour (1)
2
3
4
Value (5)
Spread
Valuation Metric CAGR Performance (1971-2010)
2016 © Alpha Architect. All Rights Reserved.
8
Systematic Overreaction?
*The results are hypothetical results and are NOT an indicator of future results and do NOT represent
returns that any investor actually attained. Please see disclosures for additional information. Additional
information regarding the construction of these results is available upon request.
Source: Alpha Architect, LLC (top), Data are from Dechow and Sloan, 1997, Returns to Contrarian
Investment Strategies: Tests of the Naïve Expectations Hypothesis, Journal of Financial Economics 43.
Expensive <----- Valuation -----> Cheap
Past5Year
EarningsGrowth
Future5Year
EarningsGrowth
2016 © Alpha Architect. All Rights Reserved.
9
Behavioral Bias
Limited Arbitrage
Who is the Worst Poker Player at the Table?
Who is the Best Poker Player at the Table?
Opportunity
2016 © Alpha Architect. All Rights Reserved.
10Source: Shleifer A., R. Vishny, 1997, The Limits of Arbitrage, Journal of Finance 52, pg. 35-55.
Stock Price
“Rational” Value
Current Value
“Irrational” Value
T=0 T=1 T=2
Delegated Managers Face Career Risk Concerns
T=0 T=1 T=2
#1 $100 $150 $200
#2 $100 $50 $200
Career
Risk
2016 © Alpha Architect. All Rights Reserved.
11Source: http://online.barrons.com/news/articles/SB945992010127068546; Calculation details available upon request
Warren Buffett has “Lost his Magic Touch”
Sustainable active investing has to be painful!
Value Index vs. S&P 500 Index from 1994 to 1999
2016 © Alpha Architect. All Rights Reserved.
12
Behavioral Bias
Limited Arbitrage
Source: N. Barberis and R. Thaler, 2003, A Survey of Behavioral Finance, Handbook of the Economics of Finance.
Overreaction
Career Risk
Active is simple, but can’t be easy
Who is the Worst Poker Player at the Table?
Who is the Best Poker Player at the Table?
Opportunity
2016 © Alpha Architect. All Rights Reserved.
13
Long-Term Performance
Source: Alpha Architect, LLC
Key to Long-Term Performance Success
Sustainable
Alpha
Sustainable
Clients
Long-Term
Performance
i ii iii
Active Investing Bad Investing
Need Sustainable Process + Sustainable Client
Manage Fees and Taxes
1
2
3
Long Horizon and Discipline IS Alpha
2016 © Alpha Architect. All Rights Reserved.
14
For those who believe they are the best poker players
APPENDIX
2016 © Alpha Architect. All Rights Reserved.
16
Disclosures
Performance figures contained herein are hypothetical, unaudited and prepared by Alpha Architect, LLC; hypothetical results
are intended for illustrative purposes only.
Past performance is not indicative of future results, which may vary.
There is a risk of substantial loss associated with trading commodities, futures, options and other financial instruments.
Before trading, investors should carefully consider their financial position and risk tolerance to determine if the proposed
trading style is appropriate. Investors should realize that when trading futures, commodities and/or granting/writing options
one could lose the full balance of their account. It is also possible to lose more than the initial deposit when trading futures
and/or granting/writing options. All funds committed to such a trading strategy should be purely risk capital.
Hypothetical performance results (e.g., quantitative backtests) have many inherent limitations, some of which, but not all,
are described herein. No representation is being made that any fund or account will or is likely to achieve profits or losses
similar to those shown herein. In fact, there are frequently sharp differences between hypothetical performance results and
the actual results subsequently realized by any particular trading program. One of the limitations of hypothetical
performance results is that they are generally prepared with the benefit of hindsight. In addition, hypothetical trading does
not involve financial risk, and no hypothetical trading record can completely account for the impact of financial risk in actual
trading. For example, the ability to withstand losses or adhere to a particular trading program in spite of trading losses are
material points which can adversely affect actual trading results. The hypothetical performance results contained herein
represent the application of the quantitative models as currently in effect on the date first written above and there can be no
assurance that the models will remain the same in the future or that an application of the current models in the future will
produce similar results because the relevant market and economic conditions that prevailed during the hypothetical
performance period will not necessarily recur. There are numerous other factors related to the markets in general or to the
implementation of any specific trading program which cannot be fully accounted for in the preparation of hypothetical
performance results, all of which can adversely affect actual trading results. Hypothetical performance results are presented
for illustrative purposes only.
Indexes are unmanaged, do not reflect management or trading fees, and one cannot invest directly in an index.
There is no guarantee, express or implied, that long-term return and/or volatility targets will be achieved. Realized returns
and/or volatility may come in higher or lower than expected.
2016 © Alpha Architect. All Rights Reserved.
17
Statistics Descriptions
 CAGR: Compound annual growth rate
 Standard Deviation: Sample standard deviation
 Downside Deviation: Sample standard deviation, but only monthly observations below 41.67bps (5%/12) are
included in the calculation
 Sharpe Ratio (annualized): Average monthly return minus treasury bills divided by standard deviation
 Sortino Ratio (annualized): Average monthly return minus treasury bills divided by downside deviation
 Worst Drawdown: Worst peak to trough performance (measured based on monthly returns)
 Rolling X-Year Win %: Percentage of rolling X periods that a strategy outperforms
 Sum (5-Year Rolling MaxDD): Sum of all 5-Year rolling drawdowns
 Down %: The Down Number Ratio is a measure of the number of periods that the investment was down when the
benchmark was down, divided by the number of periods that the benchmark was down. The smaller the ratio, the
better
 Up %: The Up Number Ratio is a measure of the number of periods that the investment was up when the
benchmark was up, divided by the number of periods that the benchmark was up. The larger the ratio, the better
 Tracking Error: Tracking Error is measured by taking the square root of the average of the squared deviations
between the investment’s returns and the benchmark’s returns
 Negative Correlation: Correlation of returns relative to benchmark returns when the benchmark is negative
 Positive Correlation: Correlation of returns relative to benchmark returns when the benchmark is positive
2016 © Alpha Architect. All Rights Reserved.
18
Strategy Background for Value vs. Market Slide
 Simulated Historical Performance: 1/1/1994 to 12/31/1999
 All returns are total returns and include the reinvestment of distributions (e.g., dividends)
 Gross of all fees and transaction costs
 From Ken French Website: http://mba.tuck.dartmouth.edu/pages/faculty/ken.french/data_library.html
 Legend
Value Stocks = Top Quintile B/M
SP500 = S&P 500 Total Return Index
RF = Treasury Bill Total Return Index
 Hypothetical performance results have many inherent limitations, some of which, but not all, are
described in the disclosures at the end of this document. No representation is being made that any fund
or account will or is likely to achieve profits or losses similar to those shown herein. In fact, there are
frequently sharp differences between hypothetical performance results and the actual results
subsequently realized by any particular trading program.
 Indexes are unmanaged, do not reflect management or trading fees, and one cannot invest directly in an index.
 Please see the disclosures at the end of this document for additional information.
Source: Alpha Architect, LLC
Wesley R. Gray, PhD
T: +1.215.882.9983
F: +1.216.245.3686
ir@AlphaArchitect.com
213 Foxcroft Road
Broomall, PA 19008
Affordable Active Management | Built to Beat Behavioral Bias | We Empower Investors Through Education
Prepared: 4/14/2016
QUESTIONS?

The Sustainable Active Investing Framework: Simple, but Not Easy by Wesley Gray at QuantCon 2016

  • 1.
    Wesley R. Gray,PhD T: +1.215.882.9983 F: +1.216.245.3686 ir@AlphaArchitect.com 213 Foxcroft Road Broomall, PA 19008 Affordable Active Management | Built to Beat Behavioral Bias | We Empower Investors Through Education Prepared: 4/14/2016 ACTIVE INVESTING IS SIMPLE; BUT NOT EASY
  • 2.
    2016 © AlphaArchitect. All Rights Reserved. 2 Markets are not perfectly efficient “Your conclusion has to be false.” –Eugene Fama’s comment on dissertation “…value investors have stock picking skills.” --Wes’ Dissertation Active stock selection can beat passive benchmarks…
  • 3.
    2016 © AlphaArchitect. All Rights Reserved. 3 No ammo? No Kevlar? No water? Combat Ready? Rational People Irrational People Newsflash: Humans aren’t robots Source: Author Photograph Humans are influenced by bias  stress increases bias
  • 4.
    2016 © AlphaArchitect. All Rights Reserved. 4 Markets are not Perfectly Efficient Human Beings Can Be Irrational! We are All Going to Be Rich! ???
  • 5.
    2016 © AlphaArchitect. All Rights Reserved. 5 Behavioral Bias Limited Arbitrage Who is the Worst Poker Player at the Table? Who is the Best Poker Player at the Table? Opportunity So why are finance professors not billionaires? Active is simple, but can’t be easy
  • 6.
    2016 © AlphaArchitect. All Rights Reserved. 6 Behavioral Bias Limited Arbitrage Who is the Worst Poker Player at the Table? Who is the Best Poker Player at the Table? Opportunity
  • 7.
    2016 © AlphaArchitect. All Rights Reserved. 7 *The results are hypothetical results and are NOT an indicator of future results and do NOT represent returns that any investor actually attained. Please see disclosures for additional information. Additional information regarding the construction of these results is available upon request. Source: Gray and Vogel, 2012, Analyzing Valuation Measures: A Performance Horse Race over the Past 40 Years, The Journal of Portfolio Management 39, p. 112-121. Rule 1: Buy Cheap Stuff Rule 2: Refer to Rule #1 Glamour (1) 2 3 4 Value (5) Spread Valuation Metric CAGR Performance (1971-2010)
  • 8.
    2016 © AlphaArchitect. All Rights Reserved. 8 Systematic Overreaction? *The results are hypothetical results and are NOT an indicator of future results and do NOT represent returns that any investor actually attained. Please see disclosures for additional information. Additional information regarding the construction of these results is available upon request. Source: Alpha Architect, LLC (top), Data are from Dechow and Sloan, 1997, Returns to Contrarian Investment Strategies: Tests of the Naïve Expectations Hypothesis, Journal of Financial Economics 43. Expensive <----- Valuation -----> Cheap Past5Year EarningsGrowth Future5Year EarningsGrowth
  • 9.
    2016 © AlphaArchitect. All Rights Reserved. 9 Behavioral Bias Limited Arbitrage Who is the Worst Poker Player at the Table? Who is the Best Poker Player at the Table? Opportunity
  • 10.
    2016 © AlphaArchitect. All Rights Reserved. 10Source: Shleifer A., R. Vishny, 1997, The Limits of Arbitrage, Journal of Finance 52, pg. 35-55. Stock Price “Rational” Value Current Value “Irrational” Value T=0 T=1 T=2 Delegated Managers Face Career Risk Concerns T=0 T=1 T=2 #1 $100 $150 $200 #2 $100 $50 $200 Career Risk
  • 11.
    2016 © AlphaArchitect. All Rights Reserved. 11Source: http://online.barrons.com/news/articles/SB945992010127068546; Calculation details available upon request Warren Buffett has “Lost his Magic Touch” Sustainable active investing has to be painful! Value Index vs. S&P 500 Index from 1994 to 1999
  • 12.
    2016 © AlphaArchitect. All Rights Reserved. 12 Behavioral Bias Limited Arbitrage Source: N. Barberis and R. Thaler, 2003, A Survey of Behavioral Finance, Handbook of the Economics of Finance. Overreaction Career Risk Active is simple, but can’t be easy Who is the Worst Poker Player at the Table? Who is the Best Poker Player at the Table? Opportunity
  • 13.
    2016 © AlphaArchitect. All Rights Reserved. 13 Long-Term Performance Source: Alpha Architect, LLC Key to Long-Term Performance Success Sustainable Alpha Sustainable Clients Long-Term Performance i ii iii Active Investing Bad Investing Need Sustainable Process + Sustainable Client Manage Fees and Taxes 1 2 3 Long Horizon and Discipline IS Alpha
  • 14.
    2016 © AlphaArchitect. All Rights Reserved. 14 For those who believe they are the best poker players
  • 15.
  • 16.
    2016 © AlphaArchitect. All Rights Reserved. 16 Disclosures Performance figures contained herein are hypothetical, unaudited and prepared by Alpha Architect, LLC; hypothetical results are intended for illustrative purposes only. Past performance is not indicative of future results, which may vary. There is a risk of substantial loss associated with trading commodities, futures, options and other financial instruments. Before trading, investors should carefully consider their financial position and risk tolerance to determine if the proposed trading style is appropriate. Investors should realize that when trading futures, commodities and/or granting/writing options one could lose the full balance of their account. It is also possible to lose more than the initial deposit when trading futures and/or granting/writing options. All funds committed to such a trading strategy should be purely risk capital. Hypothetical performance results (e.g., quantitative backtests) have many inherent limitations, some of which, but not all, are described herein. No representation is being made that any fund or account will or is likely to achieve profits or losses similar to those shown herein. In fact, there are frequently sharp differences between hypothetical performance results and the actual results subsequently realized by any particular trading program. One of the limitations of hypothetical performance results is that they are generally prepared with the benefit of hindsight. In addition, hypothetical trading does not involve financial risk, and no hypothetical trading record can completely account for the impact of financial risk in actual trading. For example, the ability to withstand losses or adhere to a particular trading program in spite of trading losses are material points which can adversely affect actual trading results. The hypothetical performance results contained herein represent the application of the quantitative models as currently in effect on the date first written above and there can be no assurance that the models will remain the same in the future or that an application of the current models in the future will produce similar results because the relevant market and economic conditions that prevailed during the hypothetical performance period will not necessarily recur. There are numerous other factors related to the markets in general or to the implementation of any specific trading program which cannot be fully accounted for in the preparation of hypothetical performance results, all of which can adversely affect actual trading results. Hypothetical performance results are presented for illustrative purposes only. Indexes are unmanaged, do not reflect management or trading fees, and one cannot invest directly in an index. There is no guarantee, express or implied, that long-term return and/or volatility targets will be achieved. Realized returns and/or volatility may come in higher or lower than expected.
  • 17.
    2016 © AlphaArchitect. All Rights Reserved. 17 Statistics Descriptions  CAGR: Compound annual growth rate  Standard Deviation: Sample standard deviation  Downside Deviation: Sample standard deviation, but only monthly observations below 41.67bps (5%/12) are included in the calculation  Sharpe Ratio (annualized): Average monthly return minus treasury bills divided by standard deviation  Sortino Ratio (annualized): Average monthly return minus treasury bills divided by downside deviation  Worst Drawdown: Worst peak to trough performance (measured based on monthly returns)  Rolling X-Year Win %: Percentage of rolling X periods that a strategy outperforms  Sum (5-Year Rolling MaxDD): Sum of all 5-Year rolling drawdowns  Down %: The Down Number Ratio is a measure of the number of periods that the investment was down when the benchmark was down, divided by the number of periods that the benchmark was down. The smaller the ratio, the better  Up %: The Up Number Ratio is a measure of the number of periods that the investment was up when the benchmark was up, divided by the number of periods that the benchmark was up. The larger the ratio, the better  Tracking Error: Tracking Error is measured by taking the square root of the average of the squared deviations between the investment’s returns and the benchmark’s returns  Negative Correlation: Correlation of returns relative to benchmark returns when the benchmark is negative  Positive Correlation: Correlation of returns relative to benchmark returns when the benchmark is positive
  • 18.
    2016 © AlphaArchitect. All Rights Reserved. 18 Strategy Background for Value vs. Market Slide  Simulated Historical Performance: 1/1/1994 to 12/31/1999  All returns are total returns and include the reinvestment of distributions (e.g., dividends)  Gross of all fees and transaction costs  From Ken French Website: http://mba.tuck.dartmouth.edu/pages/faculty/ken.french/data_library.html  Legend Value Stocks = Top Quintile B/M SP500 = S&P 500 Total Return Index RF = Treasury Bill Total Return Index  Hypothetical performance results have many inherent limitations, some of which, but not all, are described in the disclosures at the end of this document. No representation is being made that any fund or account will or is likely to achieve profits or losses similar to those shown herein. In fact, there are frequently sharp differences between hypothetical performance results and the actual results subsequently realized by any particular trading program.  Indexes are unmanaged, do not reflect management or trading fees, and one cannot invest directly in an index.  Please see the disclosures at the end of this document for additional information. Source: Alpha Architect, LLC
  • 19.
    Wesley R. Gray,PhD T: +1.215.882.9983 F: +1.216.245.3686 ir@AlphaArchitect.com 213 Foxcroft Road Broomall, PA 19008 Affordable Active Management | Built to Beat Behavioral Bias | We Empower Investors Through Education Prepared: 4/14/2016 QUESTIONS?