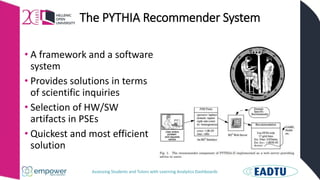
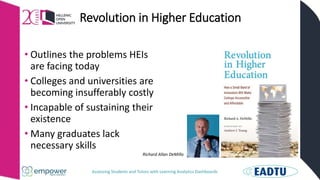
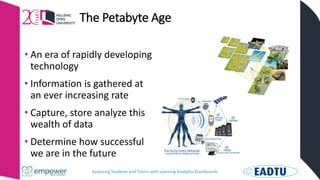
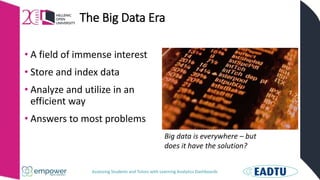
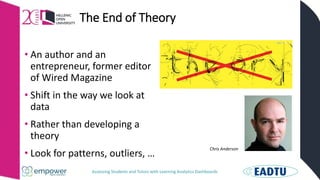
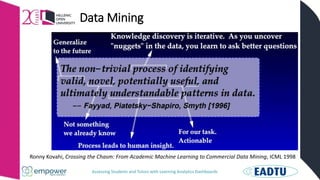
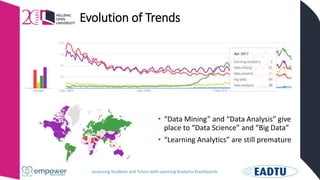
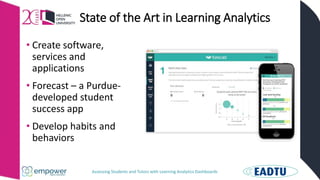
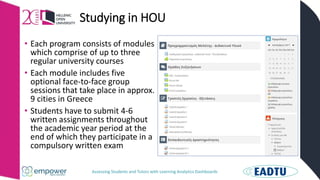
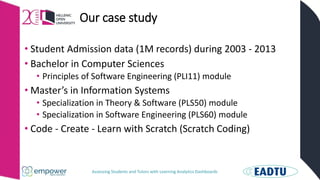
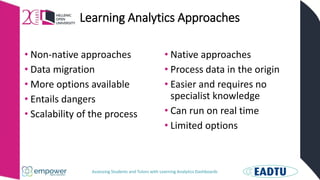
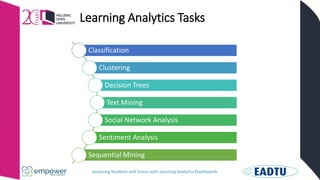
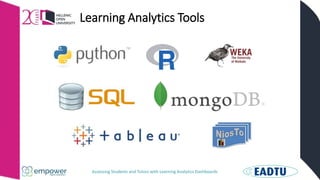
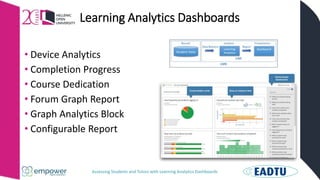
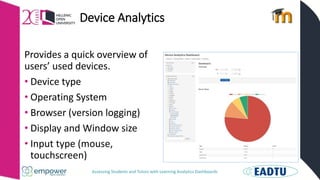
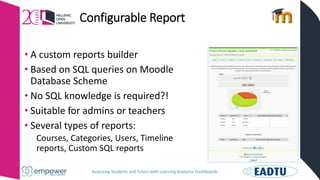
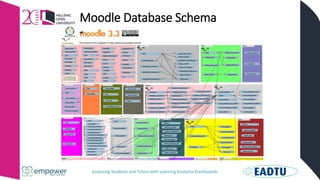
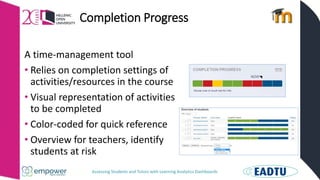
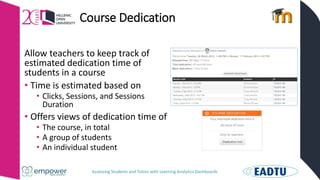
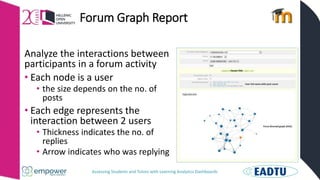
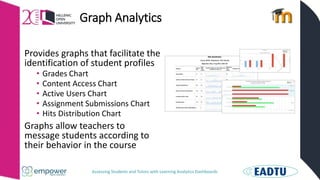
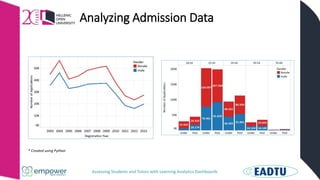
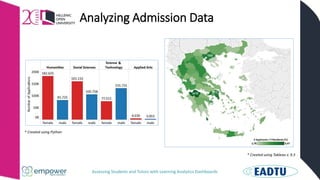
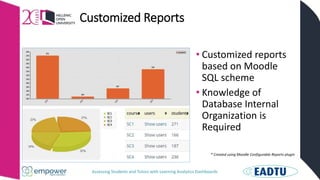
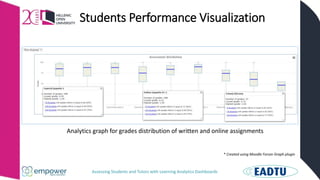
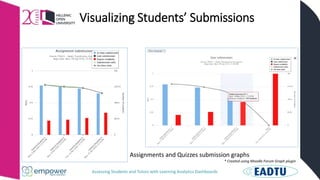
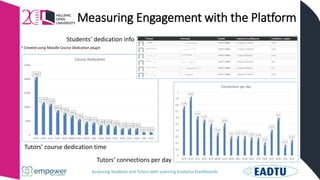
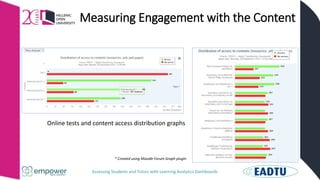
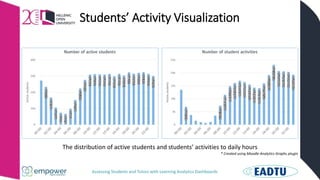
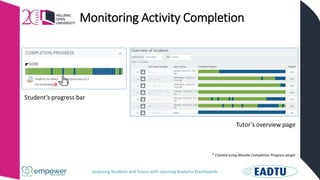
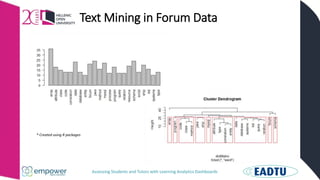
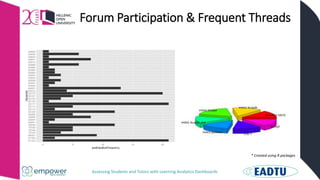
Vassilios Verykios from Hellenic Open University gave a presentation about Assessing Students and Tutors with Learning Analytics Dashboards as part of the online events by expert pool Assessment within EMPOWER.
This tutorial is designed for everyone with an interest in increasing the impact of their learning analytics research. It was given by Rebecca Ferguson on 22 June 2021 at the Learning Analytics Summer Institute 2021, hosted by the University of British Columbia and held virtually.
The Learning Tracker - A Learner Dashboard that Encourages Self-regulation in...Ioana Jivet
Although Massive Open Online Courses (MOOCs) have the potential to make quality education affordable and available to the masses, completion rates are extremely low due to the to the high level of autonomy and self-regulated skills that MOOCs require.
The aim of the present work is to investigate how self-regulated learning skills can be enhanced by encouraging metacognition and reflection in MOOC learners by means of social comparison. To this end, following an iterative process, we have developed the Learning Tracker, an interactive widget which allows learners to visualise their learning behaviour and com-
pare it to that of previous graduates of the same MOOC. Each iteration was extensively evaluated in live TU Delft MOOCs running on the edX platform while engaging over 20.000 MOOC learners.
Our results show that learners that have access to the Learning Tracker are more likely to graduate the MOOC. Moreover, we have observed that the widget has a positive impact on learners’ engagement and reduces procrastination. Based on our results, we argue that the mere fact of receiving feedback on a limited number of learning habits could trigger self-
reflection in learners and lead to improved learner performance.
Awareness is not enough. Pitfalls of learning analytics dashboards in the edu...Ioana Jivet
It has been long argued that learning analytics has the potential to act as a "middle space" between the learning sciences and data analytics, creating technical possibilities for exploring the vast amount of data generated in online learning environments. One common learning analytics intervention is the learning dashboard, a support tool for teachers and learners alike that allows them to gain insight into the learning process. Although several related works have scrutinised the state-of-the-art in the field of learning dashboards, none have addressed the theoretical foundation that should inform the design of such interventions. In this systematic literature review, we analyse the extent to which theories and models from learning sciences have been integrated into the development of learning dashboards aimed at learners. Our critical examination reveals the most common educational concepts and the context in which they have been applied. We find evidence that current designs foster competition between learners rather than knowledge mastery, offering misguided frames of reference for comparison.
Learning dashboards for actionable feedback: the (non)sense of chances of suc...Tinne De Laet
Presentation at humane event on digital transformation in higher education (http://www.humane.eu/events/seminars-and-conferences/2018/aveiro-042018/).
Learning analytics is hot. But are learning dashboards scalable and sustainable solutions for providing actionable feedback to students? Is learning analytics applicable in more traditional higher education settings? This talk will share experiences and lessons learned from two European projects (ABLE and STELA) that aimed at developing learning dashboards for more traditional higher education institutions and integrating it within actual educational practices. The talk will challenge your beliefs regarding “chances of success” and predictive models in higher education.
Supporting Higher Education to Integrate Learning Analytics_EUNIS20171107Yi-Shan Tsai
This talk summarised the SHEILA project and its preliminary findings. It was presented at the EUNIS (European University Information Systems) workshop on 7 November 2017.
Short panel presentation given by Rebecca Ferguson at the Community of Practice on Trinity Micro-credentials First Annual Event (Continuing Education with Micro-credentials), 24 November 2021, organised online by Trinity College Dublin.
Presentation of Inge de Waard for EDEN's NAP webinar on 'Student Evaluation during & after COVID19' - 22 April 2020, 15:30 CEST
More info:
https://www.eden-online.org/student-evaluation-during-and-after-covid-19/
Presentation by Rebecca Ferguson (IET, The Open University, UK) at the Learning Analytics Summer Institute event (LASI Asia) run in Seoul, South Korea, in September 2016. This presentation, on Visions of the Future of learning analytics, is based on work carried out by the European consortium working on the Learning Analytics Community Exchange (LACE) project.
Beyond the blend: practical approaches to designing fully online learningJisc
A presentation from Connect More 2020 by Kate Lindsay, head of digital education, University College of Estate Management.
The University College of Estate Management has been delivering remote teaching and learning for over a century. Their current programme of digital transformation puts their students learning experience at it heart with a focus on flexibility and embedding active online pedagogies. Based on experience and evidence from practice, this presentation will outline the changes and methods we have put in place to design online education, along with a set of resources to share with the sector.
Presentation given by Rebecca Ferguson at the ORT University Institute of Education, Montevideo, Uruguay on 12 April 2016. It deals with the Innovating Pedagogy reports produced annually since 2012 by the Institute of Educational Technology (IET) at The Open University (OU).
Student digital capabilities: institutional strategy before, during and after...Jisc
A presentation from Connect More 2020 by Elizabeth Newall, senior librarian, University of Nottingham and Richard Windle, faculty of medicine digital learning director, University of Nottingham.
At the start of the current academic year, the University of Nottingham endorsed a set of recommendations to address the gaps in the provision of support for students in developing their digital capabilities.
In January, a sub-committee had been established to support the transition of these recommendations into new provision. In February, a robust scoring matrix had been designed to reach agreement on a set of priorities. In March, the pandemic hit.
In this session, hear how the institutional strategy on student digital capabilities has been affected by the current crisis, what measures have been taken to support this year’s students, and what plans are underway to support the student experience for new and returning students at the start of the next academic year.
Pathways to Learning: Open Collaboration to Support the Online Pivot Robert Farrow
This presentation reports results of a recent open education research collaboration between The African Council for Distance Education and The Open University (UK). Pathways to Learning: new approaches in higher education (OpenLearn, 2020a) hosted two free professional development programmes for university lecturers, instructional designers, professional staff, and managers who share responsibility for providing quality distance and online learning.
• A Teacher Educator programme, Skills for 21st Century Learning and Teaching (OpenLearn, 2020b)
• A Tertiary Educator programme, Take Your Teaching Online (OpenLearn, 2020c)
The courses ran over six weeks between 13th July and 20th August, 2020, and was contextualized by a rapid rollout of online learning during the Coronavirus pandemic. The programmes combined a course of study using OER materials with supplementary activities including a total of 12 webinars and interactive events alongside use of new platforms created by The Open University’s Institute of Educational Technology: nQuire (Herodotou et al., 2018) and Our Journey (Coughlan et al., 2019).
Key findings:
• The pandemic led to a substantial shift in teaching across Africa and a requirement to better understand and gain experience of online learning. Change is likely to persist post-pandemic, although infrastructure and cultural barriers are reported.
• The project surveys, interviews and the data generated through interactions that occurred in the programmes explores challenges and opportunities for online and blended learning across the African continent and globally.
• The evaluation data provides evidence that the programmes led to important understanding of course design and confidence in online facilitation for a large majority of those who took part in them.
• There is evidence that the programmes built confidence, particularly through the experiences of these educators themselves learning online with well-designed materials, and engaging with platforms and experts.
• There is evidence that each of the elements and activities were appreciated by some learners. The open courses were seen as most useful alongside some webinars. Community events and forums added substantial value to these.
• The flexibility offered in the programmes led to different behaviours. Many aimed to complete all the available activities despite time pressures and other barriers. Some were unable to attend live events so recordings were appreciated.
• Given the courses were free to join and many educators faced barriers and pressures, retention figures were very positive with around 66% of those who took part in the first week completing the rest of these programmes.
• Assessment, Open Educational Resources (OER), and understanding of technologies that can be used for online learning and learning design were areas that learners reported as being particularly valuable.
How are students actually using technology? EMEA Online Symposium 2020Studiosity.com
At the EMEA Symposium 2020, Sarah Knight, Head of data and digital capability at Jisc, delivered a data-focused insight into how students are actually using technology in further and higher education. Here are some key findings:
- Office for Students predicts that over a million digitally skilled people will be needed by 2022 whilst 24% of HE students said they never worked online with others
- 70% of HE students agreed that digital skills were important for their chosen career but only 42% agreed that their course prepared them for the digital workplace
Here are the key recommendations that, now more than ever, can practically help your students:
- Raise awareness of the importance of digital skills
- Ensure they know what digital skills they need to have before they start and provide opportunities to develop these only online
- Encourage collaboration to emulate business practices
- Embed digital skills through curriculum design
This year's EMEA Studiosity Symposium was hosted online on 1st and 2nd April 2020.
LRT Talks 201611209 GCU Learning and Teaching CelebrationMark Stubbs
Summary of work undertaken across Manchester Metropolitan University to enhance the student experience by refreshing the undergraduate curriculum and using digital technology to 'wrap the university around the learner'
Rafael Hidalgo from The Open University, UK gave a presentation about Learning Analytics for Student Support as part of the online events by expert pool Student Support within EMPOWER.
ABLE - the NTU Student Dashboard - University of DerbyEd Foster
implementing a university wide learning analytics system.
Presentation Overview:
- Introduction
- Developing the NTU Student Dashboard
- Transitioning from pilot phase to whole institution roll-out
- Embedding the resource into working practices
- Future development
Speakers:
David Lewis, senior analytics consultant, Jisc
Martin Lynch, learning systems manager, University of South Wales
An opportunity to find out about how an institution has been implementing learning analytics to support the student journey with and opportunity to discuss issues and possibilities that the use of learning analytics may create.
eTechSchool provides a suite of applications in a fully integrated manner, to cater to the needs of large educational organizations having several institutes and multiple disciplines under each Institute, either various colleges(Arts, Science etc.) or Departments (Electrical, Mechanical etc.). It is also suitable for a single entity like Institute.
The ability to collect, manipulate, analyze, and act on vast amounts of data presents a potentially powerful opportunity for educational researchers. The explosive growth of interest in data analysis in turn has been driven by research into online education, by scholars with access to data at an unprecedented scale, and by government, social services and non-profits leveraging data for social good. This emerging discipline of data science relies on a novel mix of mathematical and statistical modeling, computational thinking and methods, data representation and management, and domain expertise.
This talk is about a National Science Foundation awarded research project and was presented at the Big Data National PI conference in Washington, DC March15-17. 2017.
The CIT-eA presentation at the SQA event 'Assessment Tomorrow' Edinburgh 2015 - 9th e-Assessment Conference, 29th January. The presentation describes the approach the project is taking and presents an outline of the toolkit that is in preparation.
Open Learning Analytics Strategy for Student Success: The North Carolina Stat...Joshua
The open learning analytics process is gaining traction in higher education as institutions consider how to leverage the power of predictive learning analytics to impact student success. Institutions embrace open source options as viable alternatives to the cost of proprietary solutions. This presentation was from a September 2015 webiner in which participants learned from North Carolina State University on how NC State is pioneering the implementation of an open strategy for student success. This webinar will also feature Marist College, and will be hosted by Unicon, Inc. The webinar was recorded and is available at: https://youtu.be/ODPTjNcqNuo
Edunext Technologies Pvt. Ltd. is a technology company catering to educational institutions with school management software and website designing & promotion. The company is founded by the people with proven experience and in-depth understanding of education enterprise with expertise in technology. Our mission is to help educational institutions in exploiting technology for efficient education delivery and make the journey of studying and teaching a pleasant experience."
Edunext Technologies Pvt. Ltd. is a technology company catering to educational institutions with school management software and website designing & promotion. The company is founded by the people with proven experience and in-depth understanding of education enterprise with expertise in technology. Our mission is to help educational institutions in exploiting technology for efficient education delivery and make the journey of studying and teaching a pleasant experience.
Overcoming Barriers to Online Engagement through carefull design and delivery...EADTU
Empower Webinar Week. Disclaimer: Funded by the European Union. Views and opinions expressed are however those of the author(s) only and do not necessarily reflect those of the European Union or the European Education and Culture Executive Agency (EACEA). Neither the European Union nor EACEA can be held responsible for them.
Unit 8 - Information and Communication Technology (Paper I).pdfThiyagu K
This slides describes the basic concepts of ICT, basics of Email, Emerging Technology and Digital Initiatives in Education. This presentations aligns with the UGC Paper I syllabus.
Executive Directors Chat Leveraging AI for Diversity, Equity, and InclusionTechSoup
Let’s explore the intersection of technology and equity in the final session of our DEI series. Discover how AI tools, like ChatGPT, can be used to support and enhance your nonprofit's DEI initiatives. Participants will gain insights into practical AI applications and get tips for leveraging technology to advance their DEI goals.
Safalta Digital marketing institute in Noida, provide complete applications that encompass a huge range of virtual advertising and marketing additives, which includes search engine optimization, virtual communication advertising, pay-per-click on marketing, content material advertising, internet analytics, and greater. These university courses are designed for students who possess a comprehensive understanding of virtual marketing strategies and attributes.Safalta Digital Marketing Institute in Noida is a first choice for young individuals or students who are looking to start their careers in the field of digital advertising. The institute gives specialized courses designed and certification.
for beginners, providing thorough training in areas such as SEO, digital communication marketing, and PPC training in Noida. After finishing the program, students receive the certifications recognised by top different universitie, setting a strong foundation for a successful career in digital marketing.
Macroeconomics- Movie Location
This will be used as part of your Personal Professional Portfolio once graded.
Objective:
Prepare a presentation or a paper using research, basic comparative analysis, data organization and application of economic information. You will make an informed assessment of an economic climate outside of the United States to accomplish an entertainment industry objective.
How to Add Chatter in the odoo 17 ERP ModuleCeline George
In Odoo, the chatter is like a chat tool that helps you work together on records. You can leave notes and track things, making it easier to talk with your team and partners. Inside chatter, all communication history, activity, and changes will be displayed.
Thinking of getting a dog? Be aware that breeds like Pit Bulls, Rottweilers, and German Shepherds can be loyal and dangerous. Proper training and socialization are crucial to preventing aggressive behaviors. Ensure safety by understanding their needs and always supervising interactions. Stay safe, and enjoy your furry friends!
Biological screening of herbal drugs: Introduction and Need for
Phyto-Pharmacological Screening, New Strategies for evaluating
Natural Products, In vitro evaluation techniques for Antioxidants, Antimicrobial and Anticancer drugs. In vivo evaluation techniques
for Anti-inflammatory, Antiulcer, Anticancer, Wound healing, Antidiabetic, Hepatoprotective, Cardio protective, Diuretics and
Antifertility, Toxicity studies as per OECD guidelines
Normal Labour/ Stages of Labour/ Mechanism of LabourWasim Ak
Normal labor is also termed spontaneous labor, defined as the natural physiological process through which the fetus, placenta, and membranes are expelled from the uterus through the birth canal at term (37 to 42 weeks
Delivering Micro-Credentials in Technical and Vocational Education and TrainingAG2 Design
Explore how micro-credentials are transforming Technical and Vocational Education and Training (TVET) with this comprehensive slide deck. Discover what micro-credentials are, their importance in TVET, the advantages they offer, and the insights from industry experts. Additionally, learn about the top software applications available for creating and managing micro-credentials. This presentation also includes valuable resources and a discussion on the future of these specialised certifications.
For more detailed information on delivering micro-credentials in TVET, visit this https://tvettrainer.com/delivering-micro-credentials-in-tvet/
This slide is special for master students (MIBS & MIFB) in UUM. Also useful for readers who are interested in the topic of contemporary Islamic banking.
How to Build a Module in Odoo 17 Using the Scaffold MethodCeline George
Odoo provides an option for creating a module by using a single line command. By using this command the user can make a whole structure of a module. It is very easy for a beginner to make a module. There is no need to make each file manually. This slide will show how to create a module using the scaffold method.
This presentation includes basic of PCOS their pathology and treatment and also Ayurveda correlation of PCOS and Ayurvedic line of treatment mentioned in classics.
Pride Month Slides 2024 David Douglas School District
Assessing Students and Tutors with Learning Analytics Dashboards
1. Assessing Students and Tutors with
Learning Analytics Dashboards
Vassilios S. Verykios, Professor
Hellenic Open University, Greece
verykios@eap.gr
FREE webinar, 26 September 2017 11.00 – 12.00 (CEST)
2. Assessing Students and Tutors with Learning Analytics Dashboards
Outline
• Big Data, Data Mining & Learning
Analytics
• The HOU Data Ecosystem
• Learning Analytics Approaches
and Tasks
• Experiments and Results
• Conclusions
3. Assessing Students and Tutors with Learning Analytics Dashboards
The PYTHIA Recommender System
• A framework and a software
system
• Provides solutions in terms
of scientific inquiries
• Selection of HW/SW
artifacts in PSEs
• Quickest and most efficient
solution
4. Assessing Students and Tutors with Learning Analytics Dashboards
Revolution in Higher Education
• Outlines the problems HEIs
are facing today
• Colleges and universities are
becoming insufferably costly
• Incapable of sustaining their
existence
• Many graduates lack
necessary skills
Richard Allan DeMillo
5. Assessing Students and Tutors with Learning Analytics Dashboards
The Petabyte Age
• An era of rapidly developing
technology
• Information is gathered at
an ever increasing rate
• Capture, store analyze this
wealth of data
• Determine how successful
we are in the future
6. Assessing Students and Tutors with Learning Analytics Dashboards
The Big Data Era
• A field of immense interest
• Store and index data
• Analyze and utilize in an
efficient way
• Answers to most problems
Big data is everywhere – but
does it have the solution?
7. Assessing Students and Tutors with Learning Analytics Dashboards
The End of Theory
Chris Anderson
• An author and an
entrepreneur, former editor
of Wired Magazine
• Shift in the way we look at
data
• Rather than developing a
theory
• Look for patterns, outliers, …
8. Assessing Students and Tutors with Learning Analytics Dashboards
Data Mining
Ronny Kovahi, Crossing the Chasm: From Academic Machine Learning to Commercial Data Mining, ICML 1998
9. Assessing Students and Tutors with Learning Analytics Dashboards
CRoss Industry Standard Process
• Describes the commonly
used approaches by data
mining experts
• Breaks the process of data
mining onto six major
phases
• Determining the problem,
preparing the data, etc.
10. Assessing Students and Tutors with Learning Analytics Dashboards
Truth and Lies about how Students Study
• Simple statistics, questionnaires and
surveys
• People’s answers are not always
consistent with the reality
• People lying/cheating, being
embarrassed
• Brain scanning test
11. Assessing Students and Tutors with Learning Analytics Dashboards
Data Storytelling
• The Essential Data Science Skill
Everyone Needs
• Not simply data visualization or
analytics reporting
• A blending of “hard data” and
“human communication”
• Help marketers achieve their goals
12. Assessing Students and Tutors with Learning Analytics Dashboards
Definition(s) of Learning Analytics
• “the measurement, collection, analysis
and reporting of data about learners and
their contexts, for purposes of
understanding and optimizing learning
and the environment (s) in which it
occurs” - Siemens, G., 2011
• “is about collecting traces that learners
leave behind and using those traces to
improve learning” - Erik Duval E., 2012
• “the use of data, which may include ‘big
data’, to provide actionable intelligence
for learners and teachers” – Ferguson R.,
2014
13. Assessing Students and Tutors with Learning Analytics Dashboards
Evolution of Trends
• “Data Mining” and “Data Analysis” give
place to “Data Science” and “Big Data”
• “Learning Analytics” are still premature
14. Assessing Students and Tutors with Learning Analytics Dashboards
State of the Art in Learning Analytics
• Create software,
services and
applications
• Forecast – a Purdue-
developed student
success app
• Develop habits and
behaviors
15. Assessing Students and Tutors with Learning Analytics Dashboards
The Hellenic Open University (HOU) story
• Officially established in 1997
• The only University in Greece that
exclusively offers “distance”
education programs
• Four Schools (Humanities, Social
Sciences, Science and Technology,
and Applied Arts)
• > 40 programs
• ≈ 50 faculty members, 2000 Adjunct
lecturers/instructors, 40K students,
220 employees, 12 km2 building
facilities
16. Assessing Students and Tutors with Learning Analytics Dashboards
The HOU Core System Infrastructure
Students
Information
System
(open.eap.gr)
The Learning
Management
System
(study.eap.gr)
The
Educational
Material
Repository
(apothesis.
eap.gr)
The web
teleconference
system
(centra.eap.gr)
17. Assessing Students and Tutors with Learning Analytics Dashboards
Studying in HOU
• Each program consists of modules
which comprise of up to three
regular university courses
• Each module includes five
optional face-to-face group
sessions that take place in approx.
9 cities in Greece
• Students have to submit 4-6
written assignments throughout
the academic year period at the
end of which they participate in a
compulsory written exam
18. Assessing Students and Tutors with Learning Analytics Dashboards
Our case study
• Student Admission data (1M records) during 2003 - 2013
• Bachelor in Computer Sciences
• Principles of Software Engineering (PLI11) module
• Master’s in Information Systems
• Specialization in Theory & Software (PLS50) module
• Specialization in Software Engineering (PLS60) module
• Code - Create - Learn with Scratch (Scratch Coding)
19. Assessing Students and Tutors with Learning Analytics Dashboards
Learning Analytics Approaches
• Non-native approaches
• Data migration
• More options available
• Entails dangers
• Scalability of the process
• Native approaches
• Process data in the origin
• Easier and requires no
specialist knowledge
• Can run on real time
• Limited options
20. Assessing Students and Tutors with Learning Analytics Dashboards
Learning Analytics Tasks
Classification
Clustering
Decision Trees
Text Mining
Social Network Analysis
Sentiment Analysis
Sequential Mining
21. Assessing Students and Tutors with Learning Analytics Dashboards
Learning Analytics Tools
22. Assessing Students and Tutors with Learning Analytics Dashboards
Learning Analytics Dashboards
• Device Analytics
• Completion Progress
• Course Dedication
• Forum Graph Report
• Graph Analytics Block
• Configurable Report
23. Assessing Students and Tutors with Learning Analytics Dashboards
Device Analytics
Provides a quick overview of
users’ used devices.
• Device type
• Operating System
• Browser (version logging)
• Display and Window size
• Input type (mouse,
touchscreen)
24. Assessing Students and Tutors with Learning Analytics Dashboards
Configurable Report
• A custom reports builder
• Based on SQL queries on Moodle
Database Scheme
• No SQL knowledge is required?!
• Suitable for admins or teachers
• Several types of reports:
Courses, Categories, Users, Timeline
reports, Custom SQL reports
26. Assessing Students and Tutors with Learning Analytics Dashboards
Completion Progress
A time-management tool
• Relies on completion settings of
activities/resources in the course
• Visual representation of activities
to be completed
• Color-coded for quick reference
• Overview for teachers, identify
students at risk
27. Assessing Students and Tutors with Learning Analytics Dashboards
Course Dedication
Allow teachers to keep track of
estimated dedication time of
students in a course
• Time is estimated based on
• Clicks, Sessions, and Sessions
Duration
• Offers views of dedication time of
• The course, in total
• A group of students
• An individual student
28. Assessing Students and Tutors with Learning Analytics Dashboards
Forum Graph Report
Analyze the interactions between
participants in a forum activity
• Each node is a user
• the size depends on the no. of
posts
• Each edge represents the
interaction between 2 users
• Thickness indicates the no. of
replies
• Arrow indicates who was replying
29. Assessing Students and Tutors with Learning Analytics Dashboards
Graph Analytics
Provides graphs that facilitate the
identification of student profiles
• Grades Chart
• Content Access Chart
• Active Users Chart
• Assignment Submissions Chart
• Hits Distribution Chart
Graphs allow teachers to
message students according to
their behavior in the course
30. Assessing Students and Tutors with Learning Analytics Dashboards
Analyzing Admission Data
* Created using Python
31. Assessing Students and Tutors with Learning Analytics Dashboards
Analyzing Admission Data
* Created using Tableau v. 9.3
* Created using Python
32. Assessing Students and Tutors with Learning Analytics Dashboards
Customized Reports
• Customized reports
based on Moodle
SQL scheme
• Knowledge of
Database Internal
Organization is
Required
* Created using Moodle Configurable Reports plugin
33. Assessing Students and Tutors with Learning Analytics Dashboards
Students Performance Visualization
Analytics graph for grades distribution of written and online assignments
* Created using Moodle Forum Graph plugin
34. Assessing Students and Tutors with Learning Analytics Dashboards
Visualizing Students’ Submissions
Assignments and Quizzes submission graphs
* Created using Moodle Forum Graph plugin
35. Assessing Students and Tutors with Learning Analytics Dashboards
Measuring Engagement with the Platform
Tutors’ course dedication time
Tutors’ connections per day
Students’ dedication info
* Created using Moodle Course Dedication plugin
36. Assessing Students and Tutors with Learning Analytics Dashboards
Measuring Engagement with the Content
Online tests and content access distribution graphs
* Created using Moodle Forum Graph plugin
37. Assessing Students and Tutors with Learning Analytics Dashboards
Students’ Activity Visualization
The distribution of active students and students’ activities to daily hours
* Created using Moodle Analytics Graphs plugin
38. Assessing Students and Tutors with Learning Analytics Dashboards
Monitoring Activity Completion
Student’s progress bar
Tutor’s overview page
* Created using Moodle Completion Progress plugin
39. Assessing Students and Tutors with Learning Analytics Dashboards
Text Mining in Forum Data
* Created using R packages
40. Assessing Students and Tutors with Learning Analytics Dashboards
Forum Participation & Frequent Threads
* Created using R packages
41. Assessing Students and Tutors with Learning Analytics Dashboards
Monitoring Participation in Forums
The PLI11 Module forum graph An integrated view of the groups forum graph
* Created using Moodle Forum Graph plugin
42. Assessing Students and Tutors with Learning Analytics Dashboards
Monitoring Participation in Forums
Tutors’ activity in Tutors’ forum of PLI11
* Created using Moodle Forum Graph plugin
43. Assessing Students and Tutors with Learning Analytics Dashboards
Identifying Polarity in Discussion Fora
* Created using R packages
44. Assessing Students and Tutors with Learning Analytics Dashboards
Identifying Emotion in Discussion Fora
* Created using R packages
45. Assessing Students and Tutors with Learning Analytics Dashboards
References
• Richard A. DeMillo, Revolution in Higher Education: How a Small Band of
Innovators Will Make College Accessible and Affordable, MIT Press, 2015
• Martin Lindstrom, Buyology: Truth and Lies About Why We Buy, 2010
• Chris Anderson, The end of theory: the data deluge makes the scientific method
obsolete, WIRED Science, 06.23.08
• The Petabyte Age: Because more isn’t just more – more is different, WIRED
Science, 06.23.08
• Stephen Baker, The Numerati, Houghton Mifflin Company, 2009
• Brent Dykes, Data Storytelling: The Essential Data Science Skill Everyone Needs,
Forbes, 03.31.16
• Ronny Kovahi, Crossing the Chasm: From Academic Machine Learning to
Commercial Data Mining, ICML 1998
46. Assessing Students and Tutors with Learning Analytics Dashboards
References
• E. Lotsari, V.S. Verykios, C.T. Panagiotakopoulos, and D. Kalles. A Learning Analytics Methodology
for Student Profiling, Proc. of the 8th Hellenic Conference on Artificial Intelligence, 2014.
• V. Kagklis, A. Karatrantou, M. Tantoula, C.T. Panagiotakopoulos, and V.S. Verykios. A learning
analytics methodology for detecting sentiment in student fora: A Case Study in Distance
Education. European Journal of Open, Distance and E-learning, 2014.
• V. Kagklis, A. Lionarakis, E.C. Stavropoulos, and V.S. Verykios. A Learning Analytics Methodology
for Student Performance Assessment in a Distance and Open Education Environment, Proc. of
EADTU annual conference, 2016.
• A.F. Gontzis, C.V. Karachristos, C.T. Panagiotakopoulos, E.C. Stavropoulos, and V.S. Verykios,
Sentiment Analysis to track Emotion and Polarity in Student Fora, Proc. of PCI 2017.
• A.F. Gontzis, C.T. Panagiotakopoulos, E.C. Stavropoulos, and V.S. Verykios, A Holistic View on
Academic Wide Data through Learning Analytics Dashboards, Proc. of EADTU annual conference
2017.
• V. Kagklis, A. Lionarakis, G. Marketos, C.T. Panagiotakopoulos, E.C. Stavropoulos, and V.S. Verykios.
Student Admission Data Analytics for Open and Distance Education in Greece. Open Education -
The Journal for Open and Distance Education and Educational Technology, 2017.
47. Assessing Students and Tutors with Learning Analytics Dashboards
Monitoring Students’ Engagement
Hits Distribution Charts
* Created using Moodle Forum Graph plugin
48. Assessing Students and Tutors with Learning Analytics Dashboards
Social Network Analysis of Students Fora
Students and Tutors’ interaction in online forum.
The size of nodes indicates the degree of
participation.
The threads each student (turquoise) participates
in, along with the number of different students
involved in each thread (purple).* Created using R packages
49. Assessing Students and Tutors with Learning Analytics Dashboards
Sentiment Classification
Sentiment classification of students messages Sentiment classification of Tutors’ messages
* Created using Niosto
Editor's Notes
Sensors everywhere. Infinite storage. Clouds of processors.
Our ability to capture, warehouse, and understand massive amounts of data is changing science, medicine, business and technology.
As our collection of facts and figures grows, so will the opportunity to find answers to fundamental questions.
Because in the era of big data, more isn’t just more. More is different.
Big Data: data sets which are so large or complex making traditional data processing applications inadequate to deal with them
Computers, algorithms, and big data can potentially generate more insightful, useful, accurate, or true results than specialists or domain experts who traditionally craft carefully targeted hypotheses and research strategies.
A best seller book, by Martin Lindstrom
Analyses what makes people buy in a world which is cluttered with messages (advs, slogans, jingles, celebrities, shows, etc.)
A three year and $7M research on 2000 consumers’ brains
…Everything we believe about why we buy is wrong…
A best Seller book, by Cole Nussbaumer Knaflic
Demonstrates how to use your data to create an engaging, informative, compelling story
Click: every time that a user access to a page in Moodle a log entry is stored.
Session: set of two or more consecutive clicks in which the elapsed time between every pair of consecutive clicks does not overcome an established maximum time.
Session duration: elapsed time between the first and the last click of the session.