Download to read offline
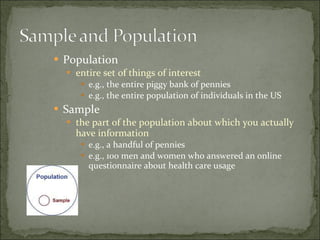
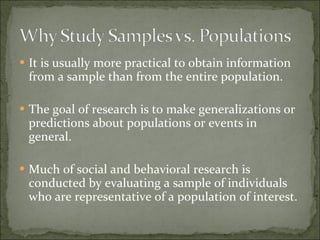
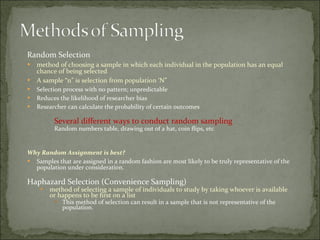

The document discusses key concepts in sampling and summarizing data from populations. It defines population as the entire set of things of interest, while a sample is a subset that is studied. Random sampling is presented as the best method, as it reduces researcher bias and allows results to be generalized to the population. Probability is discussed as the likelihood of outcomes based on the number of possible results.