
Recommended
Recommended
More Related Content
What's hot
What's hot (17)
Similar to Market watch jul 2019 frank yu oakville
Similar to Market watch jul 2019 frank yu oakville (12)
Recently uploaded
Recently uploaded (20)
Market watch jul 2019 frank yu oakville
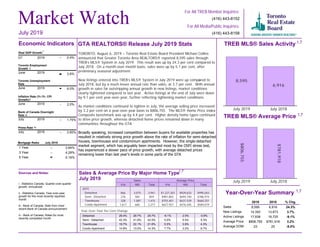
- 1. Toronto Employment Growth June 2019 3.8% Month July 2019 1 Year 3 Year 5 Year 3.64% 4.29% 5.19% July 2019 1 Year 3 Year 5 Year -- -- Market Watch For All TREB Member Inquiries: (416) 443-8158 For All Media/Public Inquiries: (416) 443-8152 GTA REALTORS® Release July 2019 Stats TORONTO, August 6, 2019 – Toronto Real Estate Board President Michael Collins announced that Greater Toronto Area REALTORS® reported 8,595 sales through TREB’s MLS® System in July 2019. This result was up by 24.3 per cent compared to July 2018. On a month-over-month basis, sales were up by 5.1 per cent, after preliminary seasonal adjustment. New listings entered into TREB’s MLS® System in July 2019 were up compared to July 2018, but by a much lesser annual rate than sales, at 3.7 per cent. With annual growth in sales far outstripping annual growth in new listings, market conditions clearly tightened compared to last year. Active listings at the end of July were down by 9.1 per cent year-over-year, further reflecting tightening market conditions. As market conditions continued to tighten in July, the average selling price increased by 3.2 per cent on a year-over-year basis to $806,755. The MLS® Home Price Index Composite benchmark was up by 4.4 per cent. Higher density home types continued to drive price growth, whereas detached home prices remained down in many communities throughout the GTA. Broadly speaking, increased competition between buyers for available properties has resulted in relatively strong price growth above the rate of inflation for semi-detached houses, townhouses and condominium apartments. However, the single-detached market segment, which has arguably been impacted most by the OSFI stress test, has experienced a slower pace of price growth, with average detached prices remaining lower than last year’s levels in some parts of the GTA TREB MLS® Sales Activity 8,595 6,916 July 2019 July 2018 TREB MLS® Average Price $806,755 $781,918 July 2019 July 2018 Year-Over-Year Summary 2019 2018 % Chg. Sales New Listings Active Listings Average Price Average DOM 8,595 6,916 24.3% 14,393 13,873 3.7% 17,938 19,725 -9.1% $806,755 $781,918 3.2% 23 25 -8.0% Sources and Notes: i - Statistics Canada, Quarter-over-quarter growth, annualized ii - Statistics Canada, Year-over-year growth for the most recently reported month iii - Bank of Canada, Rate from most recent Bank of Canada announcement iv - Bank of Canada, Rates for most recently completed month Real GDP Growth Q1 2019 -- 0.4% Toronto Unemployment Rate June 2019 6.0% Inflation Rate (Yr./Yr. CPI Growth) June 2019 - 2.0% Bank of Canada Overnight Rate July 2019 -- 1.75% Prime Rate July 2019 -- 3.95% Economic Indicators Metrics Sales Average Price 416 905 Total 416 905 Total 2019 Detached Semi - Detached Townhouse Condo Apartment 866 3,075 3,941 $1,227,301 $929,633 $995,043 276 583 859 $981,802 $694,740 $786,974 328 1,087 1,415 $755,401 $631,539 $660,251 1,617 660 2,277 $627,927 $476,445 $584,019 Sales & Average Price By Major Home Type July 2019 July 2019 i ii ii iii iv Detached Semi - Detached Townhouse Condo Apartment -9.1% 2.5% -0.9% 5.0% 5.5% 5.3% 5.5% 3.9% 4.3% 7.7% 3.2% 6.7% Detached Semi - Detached Townhouse Condo Apartment 29.4% 29.7% 29.7% 42.3% 41.8% 42.0% 19.7% 22.1% 21.6% 14.8% 13.0% 14.3% 1,7 1,7 1,7 1,7 Year-Over-Year Per Cent Change Mortgage Rates
- 2. Toronto Real Estate Board Market Watch, July 2019 SALES BY PRICE RANGE AND HOUSE TYPE JULY 2019 2 Price Range Detached Semi-Detached Att/Row/Twnhouse Condo Townhouse Condo Apt Link Co-op Apt Det Condo Co-ownership Apt Total $0 to $99,999 $100,000 to $199,999 $200,000 to $299,999 $300,000 to $399,999 $400,000 to $499,999 $500,000 to $599,999 $600,000 to $699,999 $700,000 to $799,999 $800,000 to $899,999 $900,000 to $999,999 $1,000,000 to $1,249,999 $1,250,000 to $1,499,999 $1,500,000 to $1,749,999 $1,750,000 to $1,999,999 $2,000,000+ 0 0 0 0 0 0 0 0 0 0 5 0 0 1 3 0 0 0 0 9 10 2 0 6 26 0 2 0 1 47 49 16 1 51 284 0 0 0 1 402 167 36 56 134 697 6 1 2 2 1,101 302 73 147 206 495 14 0 5 1 1,243 451 204 242 158 329 12 1 0 0 1,397 569 238 133 52 184 16 2 0 0 1,194 577 126 86 19 94 18 0 2 0 922 455 51 48 6 60 11 1 0 0 632 595 56 26 12 59 4 0 0 0 752 357 33 3 9 19 0 1 0 0 422 163 14 8 4 8 0 0 0 0 197 75 6 2 1 8 0 0 0 0 92 166 4 2 2 11 0 0 0 0 185 Price Range Detached Semi-Detached Att/Row/Twnhouse Condo Townhouse Condo Apt Link Co-op Apt Det Condo Co-ownership Apt Total $0 to $99,999 $100,000 to $199,999 $200,000 to $299,999 $300,000 to $399,999 $400,000 to $499,999 $500,000 to $599,999 $600,000 to $699,999 $700,000 to $799,999 $800,000 to $899,999 $900,000 to $999,999 $1,000,000 to $1,249,999 $1,250,000 to $1,499,999 $1,500,000 to $1,749,999 $1,750,000 to $1,999,999 $2,000,000+ 2 0 1 0 2 0 0 0 0 5 31 0 0 5 36 0 3 0 0 75 70 3 1 46 232 0 11 1 8 372 315 79 44 325 2,060 5 6 3 12 2,849 915 226 409 968 4,143 66 3 13 13 6,756 1,819 467 955 1,118 3,108 90 3 13 2 7,575 2,791 1,176 1,496 808 1,938 77 2 8 2 8,298 3,650 1,396 852 296 950 99 2 8 1 7,254 3,522 627 529 130 563 99 2 8 0 5,480 2,656 316 237 87 328 43 4 6 0 3,677 3,542 341 180 83 321 21 2 3 0 4,493 1,984 236 83 35 133 0 3 1 0 2,475 1,014 98 35 21 76 1 0 1 0 1,246 511 47 10 7 54 0 0 0 0 629 1,163 46 17 8 85 0 0 0 0 1,319 SALES BY PRICE RANGE AND HOUSE TYPE YEAR-TO-DATE, 2019 Total Sales Share of Total Sales Average Price 3,941 859 754 661 2,277 81 8 9 5 8,595 45.9% 10.0% 8.8% 7.7% 26.5% 0.9% 0.1% 0.1% 0.1% 100.0% $995,043 $786,974 $711,718 $601,541 $584,019 $738,929 $685,196 $581,333 $389,400 $806,755 Total Sales Share of Total Sales Average Price 23,985 5,058 4,849 3,937 14,029 501 41 65 38 52,503 45.7% 9.6% 9.2% 7.5% 26.7% 1.0% 0.1% 0.1% 0.1% 100.0% $1,005,581 $808,515 $709,029 $590,630 $577,785 $704,792 $561,776 $686,868 $393,918 $809,729 1,7 1,7
- 3. Toronto Real Estate Board Market Watch, July 2019 Number of Sales Dollar Volume Average Price Median Price New Listings SNLR (Trend) Active Listings Mos. Inv. (Trend) Avg. SP / LP Avg. DOM TREB Total Halton Region Burlington Halton Hills Milton Oakville Peel Region Brampton Caledon Mississauga City of Toronto Toronto West Toronto Central Toronto East York Region Aurora E. Gwillimbury Georgina King Markham Newmarket Richmond Hill Vaughan Whitchurch-Stouffville Durham Region Ajax Brock Clarington Oshawa Pickering Scugog Uxbridge Whitby Dufferin County Orangeville Simcoe County Adjala-Tosorontio Bradford West GwillimburyEssa Innisfil New Tecumseth 8,595 $6,934,056,644 806,755 $705,000 14,393 52.8% 17,938 2.4 99% 23 866 $765,948,161 884,467 $780,000 1,265 55.4% 1,731 2.4 98% 27 228 $184,693,323 810,058 $739,950 313 62.1% 435 2.2 98% 29 108 $82,187,935 760,999 $703,750 145 57.1% 174 2.1 98% 21 212 $157,108,230 741,077 $714,500 304 59.9% 296 1.7 99% 18 318 $341,958,673 1,075,342 $956,231 503 48.2% 826 3.2 97% 33 1,809 $1,377,529,422 761,487 $702,000 2,897 57.0% 3,006 1.9 98% 19 858 $631,832,107 736,401 $699,950 1,433 56.3% 1,313 1.8 99% 18 108 $101,255,300 937,549 $842,500 180 47.2% 287 3.6 97% 27 843 $644,442,015 764,463 $684,500 1,284 59.1% 1,406 1.9 98% 20 3,110 $2,612,223,392 839,943 $705,000 4,762 58.0% 5,265 1.9 100% 20 829 $646,577,033 779,948 $710,000 1,180 61.4% 1,265 1.8 100% 21 1,442 $1,338,488,614 928,217 $692,000 2,332 55.0% 2,849 2.1 99% 22 839 $627,157,745 747,506 $715,000 1,250 60.4% 1,151 1.6 101% 18 1,444 $1,343,752,579 930,577 $858,950 2,897 40.7% 4,565 4.0 98% 28 97 $82,713,208 852,713 $815,000 146 40.8% 277 3.9 98% 29 58 $45,620,826 786,566 $782,500 117 36.7% 208 5.2 97% 31 78 $43,457,800 557,151 $557,500 163 39.7% 310 4.3 97% 32 30 $44,591,700 1,486,390 $1,347,500 111 25.2% 291 9.6 95% 43 398 $378,043,898 949,859 $884,000 759 45.4% 959 3.3 99% 26 134 $105,380,305 786,420 $759,500 230 44.0% 345 3.5 98% 29 262 $264,107,867 1,008,045 $945,000 610 36.9% 996 4.6 97% 27 323 $322,949,475 999,844 $939,000 638 41.5% 917 3.6 98% 25 64 $56,887,500 888,867 $826,500 123 40.8% 262 4.8 97% 32 1,041 $629,740,888 604,938 $575,000 1,892 52.4% 2,176 2.3 98% 23 171 $109,910,174 642,750 $620,000 287 57.8% 275 1.7 99% 20 17 $9,456,000 556,235 $505,000 40 44.4% 98 4.7 96% 37 171 $94,853,415 554,698 $530,000 334 51.4% 388 2.3 99% 24 300 $150,356,035 501,187 $485,000 527 51.9% 532 2.2 99% 22 127 $96,014,275 756,018 $660,000 240 51.8% 287 2.4 98% 24 31 $22,455,700 724,377 $632,000 71 47.7% 135 4.1 97% 36 25 $17,940,500 717,620 $658,000 66 47.0% 125 4.4 97% 34 199 $128,754,789 647,009 $610,000 327 53.0% 336 2.0 99% 21 47 $27,118,800 576,996 $580,000 80 66.7% 101 1.7 99% 28 47 $27,118,800 576,996 $580,000 80 66.7% 101 1.7 99% 28 278 $177,743,402 639,365 $605,200 600 43.3% 1,094 4.2 97% 35 18 $12,824,764 712,487 $661,250 31 56.7% 53 3.6 97% 54 70 $49,848,500 712,121 $682,500 130 46.4% 190 3.4 98% 27 22 $11,991,400 545,064 $507,250 73 48.1% 142 3.8 97% 34 84 $46,639,938 555,237 $527,000 237 31.9% 473 6.4 97% 34 84 $56,438,800 671,890 $595,000 129 53.2% 236 3.3 97% 41 SUMMARY OF EXISTING HOME TRANSACTIONS ALL HOME TYPES, JULY 2019 ALL TREB AREAS 3 1 1 1 2 5498 3
- 4. Toronto Real Estate Board Market Watch, July 2019 SUMMARY OF EXISTING HOME TRANSACTIONS ALL HOME TYPES, JULY 2019 CITY OF TORONTO MUNICIPAL BREAKDOWN 4 Number of Sales Dollar Volume Average Price Median Price New Listings SNLR (Trend) Active Listings Mos. Inv. (Trend) Avg. SP / LP Avg. DOM TREB Total City of Toronto Total Toronto West Toronto W01 Toronto W02 Toronto W03 Toronto W04 Toronto W05 Toronto W06 Toronto W07 Toronto W08 Toronto W09 Toronto W10 Toronto Central Toronto C01 Toronto C02 Toronto C03 Toronto C04 Toronto C06 Toronto C07 Toronto C08 Toronto C09 Toronto C10 Toronto C11 Toronto C12 Toronto C13 Toronto C14 Toronto C15 Toronto East Toronto E01 Toronto E02 Toronto E03 Toronto E04 Toronto E05 Toronto E06 Toronto E07 Toronto E08 Toronto E09 Toronto E10 Toronto E11 8,595 $6,934,056,644 $806,755 $705,000 14,393 52.8% 17,938 2.4 99% 23 3,110 $2,612,223,392 $839,943 $705,000 4,762 58.0% 5,265 1.9 100% 20 829 $646,577,033 $779,948 $710,000 1,180 61.4% 1,265 1.8 100% 21 52 $45,064,103 $866,617 $692,000 71 72.0% 56 1.0 102% 15 77 $78,761,778 $1,022,880 $960,000 101 66.6% 71 1.0 104% 14 66 $50,969,537 $772,266 $757,500 98 62.8% 79 1.6 102% 22 75 $55,370,150 $738,269 $721,000 120 58.7% 141 2.2 99% 22 111 $72,222,899 $650,657 $690,500 161 61.6% 197 2.2 99% 22 141 $103,485,380 $733,939 $646,000 201 57.9% 259 2.2 99% 26 16 $17,029,500 $1,064,344 $1,006,000 30 57.2% 41 1.7 99% 18 156 $128,796,735 $825,620 $572,750 204 60.3% 239 1.8 98% 21 49 $41,752,450 $852,091 $900,000 63 61.7% 53 1.8 98% 19 86 $53,124,501 $617,727 $670,750 131 62.2% 129 1.8 100% 22 1,442 $1,338,488,614 $928,217 $692,000 2,332 55.0% 2,849 2.1 99% 22 460 $346,703,888 $753,704 $665,000 727 62.0% 689 1.5 101% 18 78 $111,394,834 $1,428,139 $1,050,000 114 56.0% 150 2.0 97% 23 39 $67,679,132 $1,735,362 $1,160,000 65 56.3% 83 1.9 100% 17 75 $128,592,099 $1,714,561 $1,627,500 113 47.9% 158 2.5 97% 19 37 $31,676,572 $856,124 $818,888 56 51.7% 64 2.6 99% 24 113 $101,215,980 $895,717 $647,000 193 45.6% 287 3.3 99% 25 179 $131,556,300 $734,951 $675,000 268 59.7% 255 1.6 101% 21 16 $34,862,064 $2,178,879 $1,274,532 22 58.5% 42 2.1 98% 22 69 $60,217,329 $872,715 $780,000 92 60.2% 77 1.4 100% 17 28 $19,557,998 $698,500 $472,000 44 65.4% 42 1.6 100% 16 27 $54,331,900 $2,012,293 $1,695,000 63 27.3% 209 7.6 95% 40 66 $54,608,425 $827,400 $660,000 93 52.8% 133 2.5 96% 29 120 $98,826,706 $823,556 $629,400 236 48.8% 348 2.9 97% 27 135 $97,265,387 $720,484 $591,000 246 53.3% 312 2.6 99% 26 839 $627,157,745 $747,506 $715,000 1,250 60.4% 1,151 1.6 101% 18 68 $69,160,386 $1,017,065 $957,500 83 65.7% 47 0.9 105% 15 61 $67,434,638 $1,105,486 $980,000 79 63.4% 53 1.1 104% 13 77 $69,022,867 $896,401 $880,000 119 58.8% 99 1.4 104% 12 97 $64,609,988 $666,082 $705,000 146 62.2% 138 1.6 102% 19 103 $72,272,743 $701,677 $644,000 130 60.5% 125 1.9 99% 21 32 $28,465,000 $889,531 $830,000 75 50.1% 69 2.1 100% 18 95 $60,803,176 $640,033 $601,000 135 60.8% 138 2.0 100% 21 58 $41,823,613 $721,097 $675,000 107 54.2% 132 2.1 98% 17 119 $71,725,648 $602,737 $562,000 147 67.0% 120 1.4 100% 21 55 $38,339,000 $697,073 $685,000 104 54.1% 124 2.3 101% 22 74 $43,500,686 $587,847 $601,750 125 61.5% 106 1.6 101% 15 1 1 1 2 8 3 9 4 5
- 5. Toronto Real Estate Board Market Watch, July 2019 SUMMARY OF EXISTING HOME TRANSACTIONS ALL HOME TYPES, YEAR-TO-DATE 2019 ALL TREB AREAS 5 Number of Sales Dollar Volume Average Price Median Price New Listings Avg. SP / LP Avg. DOM TREB Total Halton Region Burlington Halton Hills Milton Oakville Peel Region Brampton Caledon Mississauga City of Toronto Toronto West Toronto Central Toronto East York Region Aurora E. Gwillimbury Georgina King Markham Newmarket Richmond Hill Vaughan Whitchurch-Stouffville Durham Region Ajax Brock Clarington Oshawa Pickering Scugog Uxbridge Whitby Dufferin County Orangeville Simcoe County Adjala-Tosorontio Bradford West GwillimburyEssa Innisfil New Tecumseth 52,503 $42,513,208,643 $809,729 $700,000 100,095 99% 22 5,448 $4,656,582,687 $854,733 $760,050 9,930 98% 25 1,519 $1,174,602,219 $773,273 $712,000 2,510 98% 27 580 $442,885,686 $763,596 $706,250 1,045 98% 22 1,419 $1,052,749,492 $741,895 $709,900 2,324 99% 19 1,930 $1,986,345,290 $1,029,194 $900,000 4,051 97% 29 11,212 $8,347,942,142 $744,554 $693,000 19,444 98% 19 5,347 $3,850,322,721 $720,090 $692,750 9,198 99% 18 597 $557,917,452 $934,535 $841,000 1,274 97% 30 5,268 $3,939,701,969 $747,855 $675,000 8,972 98% 19 19,044 $16,689,947,545 $876,389 $713,694 33,526 101% 19 5,312 $4,218,938,758 $794,228 $705,000 8,824 101% 19 8,794 $8,647,325,617 $983,321 $699,440 16,537 99% 20 4,938 $3,823,683,170 $774,338 $735,050 8,165 103% 18 8,392 $7,713,304,169 $919,126 $845,000 20,367 98% 27 604 $531,785,496 $880,440 $807,500 1,430 98% 26 347 $275,223,963 $793,153 $765,000 934 98% 32 469 $265,700,382 $566,525 $540,000 1,223 97% 30 176 $229,998,710 $1,306,811 $1,175,000 720 95% 40 2,146 $1,982,670,066 $923,891 $870,000 4,677 99% 25 787 $600,115,200 $762,535 $738,000 1,765 98% 26 1,475 $1,508,827,142 $1,022,934 $920,000 3,987 97% 28 2,001 $1,973,546,865 $986,280 $910,000 4,638 98% 24 387 $345,436,345 $892,600 $807,000 993 97% 29 6,291 $3,824,336,025 $607,906 $577,000 12,174 99% 22 1,048 $692,247,157 $660,541 $635,000 1,849 99% 18 123 $59,829,775 $486,421 $455,000 292 95% 36 1,100 $615,368,743 $559,426 $526,000 2,188 99% 22 1,688 $854,417,715 $506,172 $487,500 3,233 99% 21 766 $539,126,698 $703,821 $651,250 1,501 99% 20 164 $110,327,800 $672,730 $622,350 376 96% 41 209 $168,818,847 $807,746 $712,000 432 97% 38 1,193 $784,199,290 $657,334 $627,000 2,303 99% 20 360 $201,492,780 $559,702 $543,950 566 99% 23 360 $201,492,780 $559,702 $543,950 566 99% 23 1,756 $1,079,603,295 $614,808 $580,000 4,088 97% 36 97 $67,183,014 $692,608 $639,900 178 97% 40 419 $294,269,248 $702,313 $672,500 925 98% 28 270 $139,290,694 $515,891 $480,000 559 98% 39 488 $280,378,576 $574,546 $531,000 1,511 96% 38 482 $298,481,763 $619,257 $580,500 915 98% 37 1 1 1 2 4 5
- 6. Toronto Real Estate Board Market Watch, July 2019 SUMMARY OF EXISTING HOME TRANSACTIONS ALL HOME TYPES, YEAR-TO-DATE 2019 CITY OF TORONTO MUNICIPAL BREAKDOWN 6 Number of Sales Dollar Volume Average Price Median Price New Listings Avg. SP / LP Avg. DOM TREB Total City of Toronto Total Toronto West Toronto W01 Toronto W02 Toronto W03 Toronto W04 Toronto W05 Toronto W06 Toronto W07 Toronto W08 Toronto W09 Toronto W10 Toronto Central Toronto C01 Toronto C02 Toronto C03 Toronto C04 Toronto C06 Toronto C07 Toronto C08 Toronto C09 Toronto C10 Toronto C11 Toronto C12 Toronto C13 Toronto C14 Toronto C15 Toronto East Toronto E01 Toronto E02 Toronto E03 Toronto E04 Toronto E05 Toronto E06 Toronto E07 Toronto E08 Toronto E09 Toronto E10 Toronto E11 52,503 $42,513,208,643 $809,729 $700,000 100,095 99% 22 19,044 $16,689,947,545 $876,389 $713,694 33,526 101% 19 5,312 $4,218,938,758 $794,228 $705,000 8,824 101% 19 355 $358,556,289 $1,010,018 $825,000 492 106% 12 509 $514,274,447 $1,010,362 $930,000 785 106% 11 369 $287,075,975 $777,984 $750,000 625 103% 17 526 $365,130,324 $694,164 $668,750 906 99% 24 721 $449,997,552 $624,130 $659,000 1,170 98% 25 906 $670,876,337 $740,482 $656,500 1,628 100% 22 130 $160,463,554 $1,234,335 $1,125,400 252 103% 15 1,025 $922,793,009 $900,286 $655,000 1,729 99% 17 291 $214,694,883 $737,783 $740,000 480 99% 20 480 $275,076,388 $573,076 $562,500 757 99% 23 8,794 $8,647,325,617 $983,321 $699,440 16,537 99% 20 2,699 $2,098,379,183 $777,465 $662,000 4,618 102% 17 487 $720,372,662 $1,479,205 $1,200,000 921 100% 20 309 $482,133,524 $1,560,303 $1,130,000 575 101% 17 478 $831,361,254 $1,739,249 $1,650,000 998 98% 19 177 $149,487,410 $844,562 $698,000 349 97% 19 587 $531,480,869 $905,419 $650,000 1,308 98% 25 1,144 $850,720,354 $743,637 $650,000 1,934 101% 17 162 $377,517,076 $2,330,352 $1,825,000 297 99% 18 385 $366,061,520 $950,809 $745,000 652 101% 15 257 $273,279,628 $1,063,345 $635,000 378 100% 18 159 $361,065,321 $2,270,851 $1,650,000 613 94% 32 403 $373,294,117 $926,288 $720,000 749 98% 22 716 $599,006,322 $836,601 $607,750 1,574 97% 23 831 $633,166,377 $761,933 $600,000 1,571 98% 24 4,938 $3,823,683,170 $774,338 $735,050 8,165 103% 18 440 $469,517,852 $1,067,086 $999,000 673 110% 11 418 $482,061,007 $1,153,256 $1,030,000 659 106% 12 511 $495,177,056 $969,035 $940,000 900 106% 13 581 $391,017,885 $673,008 $700,000 942 101% 18 512 $352,717,412 $688,901 $612,750 794 99% 22 240 $208,567,266 $869,030 $760,000 486 100% 16 494 $309,580,388 $626,681 $586,000 782 100% 23 346 $249,293,978 $720,503 $691,500 657 99% 20 601 $354,024,434 $589,059 $542,000 911 101% 19 339 $246,776,802 $727,955 $730,000 638 99% 22 456 $264,949,090 $581,029 $582,500 723 100% 19 1 1 1 2 4 5
- 7. Toronto Real Estate Board Market Watch, July 2019 SUMMARY OF EXISTING HOME TRANSACTIONS DETACHED HOUSES, JULY 2019 ALL TREB AREAS 7 Sales Dollar Volume Average Price Median Price New Listings Active Listings Avg. SP / LP Avg. DOM TREB Total Halton Region Burlington Halton Hills Milton Oakville Peel Region Brampton Caledon Mississauga City of Toronto Toronto West Toronto Central Toronto East York Region Aurora E. Gwillimbury Georgina King Markham Newmarket Richmond Hill Vaughan Whitchurch-Stouffville Durham Region Ajax Brock Clarington Oshawa Pickering Scugog Uxbridge Whitby Dufferin County Orangeville Simcoe County Adjala-Tosorontio Bradford West GwillimburyEssa Innisfil New Tecumseth 3,941 $3,921,465,511 $995,043 $870,000 7,558 11,221 98% 26 469 $516,319,580 $1,100,895 $950,000 762 1,256 97% 30 123 $126,818,725 $1,031,047 $881,000 181 310 97% 34 80 $66,494,180 $831,177 $817,500 118 160 98% 22 89 $80,561,030 $905,180 $847,000 164 192 99% 20 177 $242,445,645 $1,369,749 $1,250,000 299 594 96% 37 805 $775,572,004 $963,443 $890,000 1,455 1,789 98% 22 449 $385,628,786 $858,861 $808,000 810 803 99% 19 80 $82,563,800 $1,032,048 $930,000 147 255 96% 31 276 $307,379,418 $1,113,694 $980,000 498 731 97% 24 866 $1,062,842,927 $1,227,301 $960,500 1,456 2,074 98% 22 302 $321,452,066 $1,064,411 $920,500 432 534 99% 21 214 $416,213,357 $1,944,922 $1,574,000 450 943 97% 26 350 $325,177,504 $929,079 $835,000 574 597 101% 19 829 $923,878,570 $1,114,449 $1,047,000 1,915 3,369 98% 30 50 $51,450,888 $1,029,018 $980,000 107 217 99% 27 49 $40,353,726 $823,545 $830,000 98 189 97% 34 70 $39,884,300 $569,776 $582,500 154 293 97% 32 24 $41,019,200 $1,709,133 $1,712,500 103 276 94% 44 186 $229,409,136 $1,233,382 $1,173,250 410 588 99% 29 92 $80,547,680 $875,518 $821,250 171 268 98% 30 140 $183,689,353 $1,312,067 $1,250,000 383 702 97% 31 170 $211,140,787 $1,242,005 $1,156,000 390 607 97% 26 48 $46,383,500 $966,323 $895,000 99 229 97% 37 717 $473,488,616 $660,375 $625,000 1,427 1,745 98% 24 105 $74,672,924 $711,171 $700,000 192 199 99% 21 16 $8,936,000 $558,500 $497,500 40 95 96% 38 128 $75,934,889 $593,241 $559,500 270 324 99% 24 211 $115,660,954 $548,156 $524,900 403 420 99% 22 70 $64,867,475 $926,678 $787,500 147 198 97% 26 31 $22,455,700 $724,377 $632,000 71 134 97% 36 20 $14,970,700 $748,535 $696,000 58 113 97% 36 136 $95,989,974 $705,809 $655,000 246 262 98% 21 32 $19,994,800 $624,838 $620,500 59 81 99% 29 32 $19,994,800 $624,838 $620,500 59 81 99% 29 223 $149,369,014 $669,816 $645,000 484 907 97% 37 18 $12,824,764 $712,487 $661,250 31 53 97% 54 53 $40,016,300 $755,025 $700,000 99 159 97% 29 18 $10,236,400 $568,689 $552,450 58 122 97% 36 75 $42,377,650 $565,035 $530,000 198 388 97% 35 59 $43,913,900 $744,303 $640,000 98 185 97% 42 1 2 3 4 51 1 1
- 8. Toronto Real Estate Board Market Watch, July 2019 SUMMARY OF EXISTING HOME TRANSACTIONS DETACHED HOUSES, JULY 2019 CITY OF TORONTO MUNICIPAL BREAKDOWN 8 Sales Dollar Volume Average Price Median Price New Listings Active Listings Avg. SP / LP Avg. DOM TREB Total City of Toronto Total Toronto West Toronto W01 Toronto W02 Toronto W03 Toronto W04 Toronto W05 Toronto W06 Toronto W07 Toronto W08 Toronto W09 Toronto W10 Toronto Central Toronto C01 Toronto C02 Toronto C03 Toronto C04 Toronto C06 Toronto C07 Toronto C08 Toronto C09 Toronto C10 Toronto C11 Toronto C12 Toronto C13 Toronto C14 Toronto C15 Toronto East Toronto E01 Toronto E02 Toronto E03 Toronto E04 Toronto E05 Toronto E06 Toronto E07 Toronto E08 Toronto E09 Toronto E10 Toronto E11 3,941 $3,921,465,511 $995,043 $870,000 7,558 11,221 98% 26 866 $1,062,842,927 $1,227,301 $960,500 1,456 2,074 98% 22 302 $321,452,066 $1,064,411 $920,500 432 534 99% 21 8 $13,201,450 $1,650,181 $1,505,850 14 15 102% 19 21 $29,767,578 $1,417,504 $1,280,000 32 24 104% 12 37 $30,219,037 $816,731 $775,000 53 42 101% 20 39 $36,971,000 $947,974 $880,000 67 91 99% 21 25 $23,668,200 $946,728 $900,000 38 72 97% 25 31 $34,417,401 $1,110,239 $950,000 50 60 99% 21 13 $14,859,500 $1,143,038 $1,032,000 24 35 99% 19 52 $71,302,800 $1,371,208 $1,167,500 72 116 97% 26 28 $30,503,100 $1,089,396 $1,030,000 31 29 98% 23 48 $36,542,000 $761,292 $760,000 51 50 100% 19 214 $416,213,357 $1,944,922 $1,574,000 450 943 97% 26 5 $7,327,500 $1,465,500 $1,490,000 12 14 100% 21 8 $16,326,127 $2,040,766 $1,505,000 13 29 94% 22 23 $52,929,344 $2,301,276 $1,367,800 35 54 100% 18 53 $112,956,799 $2,131,260 $1,820,000 77 121 97% 20 16 $19,329,900 $1,208,119 $1,122,500 24 42 97% 26 31 $49,364,000 $1,592,387 $1,360,000 82 158 99% 22 0 $0 - $0 1 2 - - 5 $21,077,000 $4,215,400 $3,527,000 6 11 96% 30 4 $8,230,000 $2,057,500 $1,962,500 9 12 94% 15 4 $5,764,998 $1,441,250 $1,432,500 8 12 98% 14 13 $39,495,000 $3,038,077 $2,350,000 40 169 95% 48 18 $25,714,625 $1,428,590 $1,274,000 36 75 93% 35 16 $30,520,500 $1,907,531 $1,961,250 57 143 93% 41 18 $27,177,564 $1,509,865 $1,394,444 50 101 96% 29 350 $325,177,504 $929,079 $835,000 574 597 101% 19 12 $17,014,500 $1,417,875 $1,311,250 23 16 107% 8 18 $26,263,000 $1,459,056 $1,461,000 26 25 101% 11 36 $36,678,400 $1,018,844 $947,500 65 67 102% 17 48 $40,074,288 $834,881 $795,000 83 69 102% 15 43 $41,258,555 $959,501 $958,000 46 38 99% 25 25 $23,776,500 $951,060 $850,000 52 51 99% 20 33 $29,839,576 $904,230 $870,000 56 60 99% 23 29 $26,947,113 $929,211 $820,000 67 91 97% 17 53 $40,592,472 $765,896 $762,000 49 47 100% 26 31 $25,809,100 $832,552 $809,800 57 82 101% 18 22 $16,924,000 $769,273 $741,500 50 51 101% 17 1 1 1 1 2 3 4 5
- 9. Toronto Real Estate Board Market Watch, July 2019 SUMMARY OF EXISTING HOME TRANSACTIONS SEMI-DETACHED HOUSES, JULY 2019 ALL TREB AREAS 9 Sales Dollar Volume Average Price Median Price New Listings Active Listings Avg. SP / LP Avg. DOM TREB Total Halton Region Burlington Halton Hills Milton Oakville Peel Region Brampton Caledon Mississauga City of Toronto Toronto West Toronto Central Toronto East York Region Aurora E. Gwillimbury Georgina King Markham Newmarket Richmond Hill Vaughan Whitchurch-Stouffville Durham Region Ajax Brock Clarington Oshawa Pickering Scugog Uxbridge Whitby Dufferin County Orangeville Simcoe County Adjala-Tosorontio Bradford West GwillimburyEssa Innisfil New Tecumseth 859 $676,010,981 $786,974 $730,000 1,099 845 102% 17 62 $44,002,300 $709,715 $696,250 68 44 100% 16 15 $10,098,100 $673,207 $685,000 14 10 100% 14 2 $1,315,000 $657,500 $657,500 5 3 100% 14 33 $22,958,300 $695,706 $695,000 34 20 100% 15 12 $9,630,900 $802,575 $790,950 15 11 99% 22 316 $226,333,363 $716,245 $706,000 415 318 99% 15 186 $125,302,650 $673,670 $675,000 241 177 99% 15 9 $6,346,000 $705,111 $730,000 9 8 99% 21 121 $94,684,713 $782,518 $750,000 165 133 100% 15 276 $270,977,293 $981,802 $900,944 352 257 105% 16 89 $77,553,412 $871,387 $820,000 115 106 103% 21 73 $88,607,641 $1,213,803 $1,190,000 96 87 106% 13 114 $104,816,240 $919,441 $885,000 141 64 106% 13 116 $90,718,725 $782,058 $789,500 148 139 99% 22 8 $5,969,500 $746,188 $720,000 9 8 97% 18 3 $2,076,000 $692,000 $715,000 3 5 98% 16 3 $1,411,000 $470,333 $507,500 4 5 97% 37 0 - - - 0 0 - - 31 $25,364,800 $818,219 $795,000 39 27 101% 22 18 $11,517,425 $639,857 $672,563 18 17 98% 28 15 $12,615,000 $841,000 $850,000 32 41 97% 24 35 $29,597,000 $845,629 $839,000 42 34 100% 19 3 $2,168,000 $722,667 $720,000 1 2 99% 19 68 $32,381,600 $476,200 $440,500 89 62 99% 18 9 $5,449,000 $605,444 $605,000 16 15 99% 20 0 - - - 0 0 - - 7 $3,253,800 $464,829 $474,900 6 6 97% 18 39 $15,832,300 $405,956 $415,000 46 25 99% 15 9 $5,805,000 $645,000 $625,000 13 9 99% 32 0 - - - 0 1 - - 0 - - - 0 0 - - 4 $2,041,500 $510,375 $517,500 8 6 99% 13 5 $2,294,500 $458,900 $465,000 7 7 98% 39 5 $2,294,500 $458,900 $465,000 7 7 98% 39 16 $9,303,200 $581,450 $592,900 20 18 99% 27 0 - - - 0 0 - - 12 $6,932,400 $577,700 $595,000 15 10 99% 20 0 - - - 0 1 - - 1 $575,000 $575,000 $575,000 1 1 100% 36 3 $1,795,800 $598,600 $595,800 4 6 98% 52 1 1 1 1 2 3 4 5
- 10. Toronto Real Estate Board Market Watch, July 2019 SUMMARY OF EXISTING HOME TRANSACTIONS SEMI-DETACHED HOUSES, JULY 2019 CITY OF TORONTO MUNICIPAL BREAKDOWN 10 Sales Dollar Volume Average Price Median Price New Listings Active Listings Avg. SP / LP Avg. DOM TREB Total City of Toronto Total Toronto West Toronto W01 Toronto W02 Toronto W03 Toronto W04 Toronto W05 Toronto W06 Toronto W07 Toronto W08 Toronto W09 Toronto W10 Toronto Central Toronto C01 Toronto C02 Toronto C03 Toronto C04 Toronto C06 Toronto C07 Toronto C08 Toronto C09 Toronto C10 Toronto C11 Toronto C12 Toronto C13 Toronto C14 Toronto C15 Toronto East Toronto E01 Toronto E02 Toronto E03 Toronto E04 Toronto E05 Toronto E06 Toronto E07 Toronto E08 Toronto E09 Toronto E10 Toronto E11 859 $676,010,981 $786,974 $730,000 1,099 845 102% 17 276 $270,977,293 $981,802 $900,944 352 257 105% 16 89 $77,553,412 $871,387 $820,000 115 106 103% 21 5 $5,607,913 $1,121,583 $1,200,000 7 8 106% 11 21 $23,381,500 $1,113,405 $1,090,000 26 13 108% 13 19 $15,447,000 $813,000 $835,000 24 25 104% 25 5 $3,500,000 $700,000 $700,000 5 3 97% 24 30 $22,273,999 $742,467 $728,000 41 46 100% 24 2 $1,875,000 $937,500 $937,500 5 7 99% 6 0 - - - 1 1 - - 2 $1,670,000 $835,000 $835,000 1 0 100% 14 3 $2,422,000 $807,333 $789,000 2 0 99% 15 2 $1,376,000 $688,000 $688,000 3 3 97% 63 73 $88,607,641 $1,213,803 $1,190,000 96 87 106% 13 16 $21,537,788 $1,346,112 $1,250,000 22 22 105% 11 12 $17,083,500 $1,423,625 $1,351,250 14 10 109% 10 7 $8,017,000 $1,145,286 $1,260,000 9 5 107% 14 2 $2,840,000 $1,420,000 $1,420,000 2 7 97% 27 2 $1,718,888 $859,444 $859,444 3 2 105% 22 1 $801,500 $801,500 $801,500 1 3 97% 27 4 $7,140,127 $1,785,032 $1,920,000 4 4 106% 6 0 - - - 0 1 - - 10 $12,016,000 $1,201,600 $1,194,500 8 1 109% 13 4 $4,680,000 $1,170,000 $1,187,500 4 0 102% 6 1 $910,000 $910,000 $910,000 2 6 96% 6 6 $4,742,300 $790,383 $790,250 9 9 101% 19 1 $1,095,000 $1,095,000 $1,095,000 0 0 96% 38 7 $6,025,538 $860,791 $916,000 18 17 105% 17 114 $104,816,240 $919,441 $885,000 141 64 106% 13 25 $25,929,386 $1,037,175 $1,011,000 34 11 108% 13 29 $30,262,388 $1,043,531 $980,000 30 11 107% 13 25 $24,102,166 $964,087 $990,017 33 8 107% 7 6 $4,178,000 $696,333 $656,500 10 8 102% 15 3 $2,320,000 $773,333 $750,000 5 5 106% 9 2 $1,380,000 $690,000 $690,000 2 2 110% 14 5 $3,658,300 $731,660 $739,800 7 5 102% 21 2 $1,340,000 $670,000 $670,000 1 0 98% 24 3 $2,077,500 $692,500 $692,500 2 0 106% 8 3 $2,270,000 $756,667 $645,000 4 5 101% 42 11 $7,298,500 $663,500 $637,000 13 9 102% 14 1 1 1 1 2 3 4 5
- 11. Toronto Real Estate Board Market Watch, July 2019 SUMMARY OF EXISTING HOME TRANSACTIONS CONDOMINIUM TOWNHOUSES, JULY 2019 ALL TREB AREAS 11 Sales Dollar Volume Average Price Median Price New Listings Active Listings Avg. SP / LP Avg. DOM TREB Total Halton Region Burlington Halton Hills Milton Oakville Peel Region Brampton Caledon Mississauga City of Toronto Toronto West Toronto Central Toronto East York Region Aurora E. Gwillimbury Georgina King Markham Newmarket Richmond Hill Vaughan Whitchurch-Stouffville Durham Region Ajax Brock Clarington Oshawa Pickering Scugog Uxbridge Whitby Dufferin County Orangeville Simcoe County Adjala-Tosorontio Bradford West GwillimburyEssa Innisfil New Tecumseth 661 $397,618,919 $601,541 $570,000 995 943 100% 21 78 $44,462,288 $570,029 $515,000 108 98 99% 23 32 $17,865,200 $558,288 $513,950 37 33 99% 27 8 $3,836,000 $479,500 $482,500 7 2 101% 11 5 $2,530,500 $506,100 $515,000 10 9 101% 15 33 $20,230,588 $613,048 $565,000 54 54 99% 24 208 $119,309,686 $573,604 $571,000 311 269 100% 18 52 $25,504,100 $490,463 $477,500 93 84 100% 20 2 $1,200,000 $600,000 $600,000 2 1 99% 18 154 $92,605,586 $601,335 $589,000 216 184 100% 18 240 $163,193,306 $679,972 $606,500 376 372 99% 20 69 $39,850,201 $577,539 $555,000 116 113 99% 19 90 $76,223,719 $846,930 $690,250 138 140 99% 24 81 $47,119,386 $581,721 $569,000 122 119 100% 16 64 $40,667,608 $635,431 $613,750 97 117 100% 27 11 $6,190,720 $562,793 $520,000 10 18 98% 49 0 - - - 0 0 - - 0 - - - 0 1 - - 0 - - - 0 0 - - 28 $19,745,800 $705,207 $669,000 47 50 101% 25 5 $2,416,700 $483,340 $513,700 8 6 101% 24 9 $5,684,888 $631,654 $600,000 11 15 101% 25 10 $6,217,000 $621,700 $629,500 20 24 102% 13 1 $412,500 $412,500 $412,500 1 3 97% 20 66 $28,080,031 $425,455 $418,750 100 83 99% 21 18 $8,708,650 $483,814 $458,500 19 14 99% 19 0 - - - 0 1 - - 3 $1,003,000 $334,333 $339,000 10 8 103% 16 24 $8,392,881 $349,703 $343,350 34 25 99% 19 8 $4,003,000 $500,375 $476,000 27 25 100% 18 0 - - - 0 0 - - 2 $1,070,000 $535,000 $535,000 4 4 98% 15 11 $4,902,500 $445,682 $455,000 6 6 99% 31 4 $1,571,000 $392,750 $387,500 1 1 103% 22 4 $1,571,000 $392,750 $387,500 1 1 103% 22 1 $335,000 $335,000 $335,000 2 3 99% 50 0 - - - 0 0 - - 0 - - - 1 1 - - 0 - - - 0 0 - - 0 - - - 1 1 - - 1 $335,000 $335,000 $335,000 0 1 99% 50 1 1 1 1 2 3 4 5
- 12. Toronto Real Estate Board Market Watch, July 2019 SUMMARY OF EXISTING HOME TRANSACTIONS CONDOMINIUM TOWNHOUSES, JULY 2019 CITY OF TORONTO MUNICIPAL BREAKDOWN 12 Sales Dollar Volume Average Price Median Price New Listings Active Listings Avg. SP / LP Avg. DOM TREB Total City of Toronto Total Toronto West Toronto W01 Toronto W02 Toronto W03 Toronto W04 Toronto W05 Toronto W06 Toronto W07 Toronto W08 Toronto W09 Toronto W10 Toronto Central Toronto C01 Toronto C02 Toronto C03 Toronto C04 Toronto C06 Toronto C07 Toronto C08 Toronto C09 Toronto C10 Toronto C11 Toronto C12 Toronto C13 Toronto C14 Toronto C15 Toronto East Toronto E01 Toronto E02 Toronto E03 Toronto E04 Toronto E05 Toronto E06 Toronto E07 Toronto E08 Toronto E09 Toronto E10 Toronto E11 661 $397,618,919 $601,541 $570,000 995 943 100% 21 240 $163,193,306 $679,972 $606,500 376 372 99% 20 69 $39,850,201 $577,539 $555,000 116 113 99% 19 3 $1,854,900 $618,300 $685,000 6 4 100% 22 8 $6,035,500 $754,438 $743,750 15 10 101% 12 2 $1,262,000 $631,000 $631,000 3 1 106% 6 4 $2,123,000 $530,750 $549,000 7 4 100% 42 19 $8,771,300 $461,647 $487,500 28 27 99% 16 9 $5,821,800 $646,867 $636,000 19 26 99% 20 0 - - - 0 0 - - 9 $5,445,200 $605,022 $569,500 17 20 99% 26 7 $4,227,500 $603,929 $587,500 7 6 99% 16 8 $4,309,001 $538,625 $530,501 14 15 99% 19 90 $76,223,719 $846,930 $690,250 138 140 99% 24 19 $19,739,679 $1,038,930 $792,000 28 20 100% 16 4 $8,270,000 $2,067,500 $1,525,000 11 6 98% 16 0 - - - 1 3 - - 0 - - - 3 3 - - 1 $822,584 $822,584 $822,584 2 1 97% 18 8 $4,564,000 $570,500 $594,500 17 21 100% 19 6 $4,216,800 $702,800 $609,950 4 6 104% 16 0 - - - 0 2 - - 5 $4,236,000 $847,200 $800,000 5 3 97% 20 1 $480,000 $480,000 $480,000 6 6 96% 19 4 $3,943,500 $985,875 $979,500 11 15 93% 26 8 $5,362,000 $670,250 $660,000 4 3 98% 34 16 $12,792,788 $799,549 $664,000 21 20 98% 31 18 $11,796,368 $655,354 $645,000 25 31 98% 28 81 $47,119,386 $581,721 $569,000 122 119 100% 16 9 $7,501,400 $833,489 $699,000 7 8 101% 21 2 $1,485,000 $742,500 $742,500 5 4 106% 4 4 $2,388,900 $597,225 $632,500 3 3 100% 10 9 $5,312,700 $590,300 $599,900 12 11 99% 12 14 $7,983,200 $570,229 $570,000 21 17 100% 14 0 - - - 3 3 - - 7 $4,221,500 $603,071 $610,000 6 7 99% 20 7 $3,904,000 $557,714 $579,000 8 13 101% 20 4 $2,108,000 $527,000 $531,500 13 17 98% 23 11 $4,970,400 $451,855 $469,000 24 19 99% 17 14 $7,244,286 $517,449 $519,000 20 17 102% 15 1 1 1 1 2 3 4 5
- 13. Toronto Real Estate Board Market Watch, July 2019 SUMMARY OF EXISTING HOME TRANSACTIONS CONDOMINIUM APARTMENT, JULY 2019 ALL TREB AREAS 13 Sales Dollar Volume Average Price Median Price New Listings Active Listings Avg. SP / LP Avg. DOM TREB Total Halton Region Burlington Halton Hills Milton Oakville Peel Region Brampton Caledon Mississauga City of Toronto Toronto West Toronto Central Toronto East York Region Aurora E. Gwillimbury Georgina King Markham Newmarket Richmond Hill Vaughan Whitchurch-Stouffville Durham Region Ajax Brock Clarington Oshawa Pickering Scugog Uxbridge Whitby Dufferin County Orangeville Simcoe County Adjala-Tosorontio Bradford West GwillimburyEssa Innisfil New Tecumseth 2,277 $1,329,811,780 $584,019 $520,000 3,391 3,504 99% 21 97 $47,211,200 $486,713 $437,000 135 152 99% 29 34 $14,089,500 $414,397 $391,000 53 53 99% 26 3 $1,567,000 $522,333 $470,000 3 3 97% 14 19 $8,640,300 $454,753 $444,000 18 16 99% 22 41 $22,914,400 $558,888 $460,000 61 80 99% 35 308 $142,378,188 $462,267 $450,000 436 383 99% 19 57 $23,004,690 $403,591 $397,000 72 68 99% 20 1 $670,000 $670,000 $670,000 0 0 99% 21 250 $118,703,498 $474,814 $457,750 364 315 99% 19 1,617 $1,015,358,003 $627,927 $565,000 2,401 2,397 100% 21 340 $184,589,855 $542,911 $510,000 472 474 100% 21 1,025 $711,641,533 $694,284 $625,000 1,585 1,618 100% 21 252 $119,126,615 $472,725 $430,000 344 305 100% 19 206 $106,718,489 $518,051 $482,500 324 427 98% 26 6 $2,905,000 $484,167 $450,000 5 17 98% 19 0 - - - 0 0 - - 1 $252,500 $252,500 $252,500 0 2 97% 21 4 $1,694,500 $423,625 $424,750 4 7 98% 58 77 $40,383,151 $524,457 $487,000 126 146 99% 24 7 $3,068,500 $438,357 $398,000 6 7 96% 35 56 $26,975,238 $481,701 $461,100 83 101 98% 25 53 $30,380,100 $573,209 $525,000 95 132 98% 29 2 $1,059,500 $529,750 $529,750 5 15 97% 23 43 $15,817,500 $367,849 $378,000 63 84 99% 21 5 $1,991,000 $398,200 $378,000 7 6 97% 29 0 - - - 0 0 - - 9 $3,278,900 $364,322 $359,900 12 13 99% 29 8 $1,905,000 $238,125 $242,500 11 27 100% 22 13 $5,166,000 $397,385 $390,000 17 23 98% 17 0 - - - 0 0 - - 0 - - - 2 3 - - 8 $3,476,600 $434,575 $434,750 14 12 99% 13 1 $664,500 $664,500 $664,500 5 6 98% 18 1 $664,500 $664,500 $664,500 5 6 98% 18 5 $1,663,900 $332,780 $339,900 27 55 97% 51 0 - - - 0 0 - - 0 - - - 1 4 - - 0 - - - 0 0 - - 1 $389,000 $389,000 $389,000 18 43 97% 38 4 $1,274,900 $318,725 $324,950 8 8 96% 54 1 1 1 1 2 3 4 5
- 14. Toronto Real Estate Board Market Watch, July 2019 SUMMARY OF EXISTING HOME TRANSACTIONS CONDOMINIUM APARTMENT, JULY 2019 CITY OF TORONTO MUNICIPAL BREAKDOWN 14 Sales Dollar Volume Average Price Median Price New Listings Active Listings Avg. SP / LP Avg. DOM TREB Total City of Toronto Total Toronto West Toronto W01 Toronto W02 Toronto W03 Toronto W04 Toronto W05 Toronto W06 Toronto W07 Toronto W08 Toronto W09 Toronto W10 Toronto Central Toronto C01 Toronto C02 Toronto C03 Toronto C04 Toronto C06 Toronto C07 Toronto C08 Toronto C09 Toronto C10 Toronto C11 Toronto C12 Toronto C13 Toronto C14 Toronto C15 Toronto East Toronto E01 Toronto E02 Toronto E03 Toronto E04 Toronto E05 Toronto E06 Toronto E07 Toronto E08 Toronto E09 Toronto E10 Toronto E11 2,277 $1,329,811,780 $584,019 $520,000 3,391 3,504 99% 21 1,617 $1,015,358,003 $627,927 $565,000 2,401 2,397 100% 21 340 $184,589,855 $542,911 $510,000 472 474 100% 21 34 $22,312,840 $656,260 $641,750 43 28 101% 14 24 $16,242,200 $676,758 $612,000 24 22 99% 18 6 $2,845,500 $474,250 $438,750 14 10 100% 21 26 $12,126,150 $466,390 $425,000 37 39 100% 22 25 $9,737,900 $389,516 $375,000 40 40 99% 13 94 $57,348,179 $610,087 $556,000 118 154 99% 29 2 $1,070,000 $535,000 $535,000 3 3 98% 16 90 $47,409,736 $526,775 $488,000 111 102 100% 18 11 $4,599,850 $418,168 $335,000 20 16 97% 13 28 $10,897,500 $389,196 $387,500 62 60 99% 25 1,025 $711,641,533 $694,284 $625,000 1,585 1,618 100% 21 407 $281,884,921 $692,592 $641,000 644 617 101% 18 50 $65,664,207 $1,313,284 $947,509 70 99 95% 28 8 $6,297,788 $787,224 $760,450 19 20 98% 18 18 $9,862,800 $547,933 $542,500 28 25 100% 14 18 $9,805,200 $544,733 $540,000 27 19 100% 24 69 $42,972,680 $622,792 $575,000 87 98 100% 27 167 $118,804,373 $711,403 $675,000 249 238 100% 21 7 $7,227,000 $1,032,429 $890,000 13 25 102% 10 50 $35,735,329 $714,707 $646,500 69 58 100% 17 19 $8,633,000 $454,368 $440,000 26 23 101% 18 8 $7,335,900 $916,988 $884,950 9 17 97% 32 29 $14,855,000 $512,241 $462,500 43 44 99% 23 86 $52,918,418 $615,330 $580,500 150 173 99% 24 89 $49,644,917 $557,808 $510,000 151 162 100% 26 252 $119,126,615 $472,725 $430,000 344 305 100% 19 18 $14,403,100 $800,172 $752,500 15 9 99% 20 8 $6,129,750 $766,219 $660,125 12 10 100% 18 11 $5,193,401 $472,127 $385,000 14 18 104% 11 29 $11,669,000 $402,379 $405,000 32 34 101% 27 39 $17,616,988 $451,718 $420,000 48 53 98% 22 5 $3,308,500 $661,700 $585,000 16 11 99% 14 45 $19,329,800 $429,551 $428,000 60 59 99% 19 16 $6,789,500 $424,344 $398,500 27 22 100% 18 57 $25,777,676 $452,240 $443,000 82 56 100% 17 4 $1,363,000 $340,750 $367,500 9 11 98% 43 20 $7,545,900 $377,295 $392,500 29 22 100% 15 1 1 1 1 2 3 4 5
- 15. Toronto Real Estate Board Market Watch, July 2019 SUMMARY OF EXISTING HOME TRANSACTIONS LINK, JULY 2019 ALL TREB AREAS 15 Sales Dollar Volume Average Price Median Price New Listings Active Listings Avg. SP / LP Avg. DOM TREB Total Halton Region Burlington Halton Hills Milton Oakville Peel Region Brampton Caledon Mississauga City of Toronto Toronto West Toronto Central Toronto East York Region Aurora E. Gwillimbury Georgina King Markham Newmarket Richmond Hill Vaughan Whitchurch-Stouffville Durham Region Ajax Brock Clarington Oshawa Pickering Scugog Uxbridge Whitby Dufferin County Orangeville Simcoe County Adjala-Tosorontio Bradford West GwillimburyEssa Innisfil New Tecumseth 81 $59,853,271 $738,929 $767,000 138 133 100% 18 6 $4,015,000 $669,167 $672,500 6 7 102% 12 4 $2,666,000 $666,500 $672,500 3 3 103% 13 1 $558,000 $558,000 $558,000 2 1 101% 10 0 - - - 0 0 - - 1 $791,000 $791,000 $791,000 1 3 99% 10 11 $7,824,100 $711,282 $702,000 12 8 101% 14 6 $3,883,100 $647,183 $629,550 4 2 100% 17 0 - - - 0 0 - - 5 $3,941,000 $788,200 $771,000 8 6 102% 10 9 $7,300,000 $811,111 $796,000 17 20 101% 27 0 - - - 2 2 - - 3 $2,621,000 $873,667 $875,000 3 3 95% 40 6 $4,679,000 $779,833 $771,000 12 15 104% 20 31 $27,626,756 $891,186 $880,000 60 60 100% 17 1 $835,000 $835,000 $835,000 3 2 98% 24 0 - - - 0 0 - - 0 - - - 0 1 - - 2 $1,878,000 $939,000 $939,000 1 2 104% 12 19 $17,315,756 $911,356 $930,000 39 39 101% 16 0 - - - 0 0 - - 5 $4,109,000 $821,800 $830,000 12 12 96% 14 3 $2,661,000 $887,000 $840,000 5 4 98% 28 1 $828,000 $828,000 $828,000 0 0 99% 5 18 $9,849,415 $547,190 $535,500 29 22 100% 17 2 $1,180,500 $590,250 $590,250 1 1 104% 27 0 - - - 0 0 - - 8 $4,031,400 $503,925 $506,250 20 14 100% 12 1 $515,000 $515,000 $515,000 3 1 98% 7 0 - - - 1 2 - - 0 - - - 0 0 - - 0 - - - 0 1 - - 7 $4,122,515 $588,931 $585,000 4 3 100% 21 1 $550,000 $550,000 $550,000 1 1 100% 7 1 $550,000 $550,000 $550,000 1 1 100% 7 5 $2,688,000 $537,600 $570,000 13 15 99% 38 0 - - - 0 0 - - 1 $605,000 $605,000 $605,000 5 5 100% 5 2 $866,000 $433,000 $433,000 5 6 98% 31 0 - - - 0 0 - - 2 $1,217,000 $608,500 $608,500 3 4 98% 61 1 1 1 1 2 3 4 5
- 16. Toronto Real Estate Board Market Watch, July 2019 SUMMARY OF EXISTING HOME TRANSACTIONS LINK, JULY 2019 CITY OF TORONTO MUNICIPAL BREAKDOWN 16 Sales Dollar Volume Average Price Median Price New Listings Active Listings Avg. SP / LP Avg. DOM TREB Total City of Toronto Total Toronto West Toronto W01 Toronto W02 Toronto W03 Toronto W04 Toronto W05 Toronto W06 Toronto W07 Toronto W08 Toronto W09 Toronto W10 Toronto Central Toronto C01 Toronto C02 Toronto C03 Toronto C04 Toronto C06 Toronto C07 Toronto C08 Toronto C09 Toronto C10 Toronto C11 Toronto C12 Toronto C13 Toronto C14 Toronto C15 Toronto East Toronto E01 Toronto E02 Toronto E03 Toronto E04 Toronto E05 Toronto E06 Toronto E07 Toronto E08 Toronto E09 Toronto E10 Toronto E11 81 $59,853,271 $738,929 $767,000 138 133 100% 18 9 $7,300,000 $811,111 $796,000 17 20 101% 27 0 - - - 2 2 - - 0 - - - 0 0 - - 0 - - - 0 0 - - 0 - - - 0 0 - - 0 - - - 0 0 - - 0 - - - 0 1 - - 0 - - - 0 0 - - 0 - - - 0 0 - - 0 - - - 0 0 - - 0 - - - 2 1 - - 0 - - - 0 0 - - 3 $2,621,000 $873,667 $875,000 3 3 95% 40 0 - - - 0 0 - - 0 - - - 0 0 - - 0 - - - 0 0 - - 0 - - - 0 0 - - 0 - - - 0 0 - - 0 - - - 1 2 - - 0 - - - 0 0 - - 0 - - - 0 0 - - 0 - - - 0 0 - - 0 - - - 0 0 - - 0 - - - 0 0 - - 0 - - - 0 0 - - 0 - - - 0 0 - - 3 $2,621,000 $873,667 $875,000 2 1 95% 40 6 $4,679,000 $779,833 $771,000 12 15 104% 20 0 - - - 0 0 - - 0 - - - 0 0 - - 0 - - - 0 0 - - 0 - - - 0 0 - - 2 $1,662,000 $831,000 $831,000 6 7 99% 7 0 - - - 0 0 - - 4 $3,017,000 $754,250 $747,000 4 5 108% 27 0 - - - 0 0 - - 0 - - - 0 0 - - 0 - - - 0 0 - - 0 - - - 2 3 - - 1 1 1 1 2 3 4 5
- 17. Toronto Real Estate Board Market Watch, July 2019 SUMMARY OF EXISTING HOME TRANSACTIONS ATTACHED/ROW/TOWNHOUSE, JULY 2019 ALL TREB AREAS 17 Sales Dollar Volume Average Price Median Price New Listings Active Listings Avg. SP / LP Avg. DOM TREB Total Halton Region Burlington Halton Hills Milton Oakville Peel Region Brampton Caledon Mississauga City of Toronto Toronto West Toronto Central Toronto East York Region Aurora E. Gwillimbury Georgina King Markham Newmarket Richmond Hill Vaughan Whitchurch-Stouffville Durham Region Ajax Brock Clarington Oshawa Pickering Scugog Uxbridge Whitby Dufferin County Orangeville Simcoe County Adjala-Tosorontio Bradford West GwillimburyEssa Innisfil New Tecumseth 754 $536,635,618 $711,718 $667,750 1,183 1,244 100% 21 152 $108,621,293 $714,614 $670,000 184 173 99% 22 18 $11,839,298 $657,739 $653,638 24 25 99% 18 14 $8,417,755 $601,268 $613,750 10 5 100% 22 66 $42,418,100 $642,698 $646,250 78 59 99% 18 54 $45,946,140 $850,854 $780,000 72 84 99% 30 160 $105,532,081 $659,576 $650,000 259 229 99% 16 108 $68,508,781 $634,341 $638,150 206 172 99% 17 16 $10,475,500 $654,719 $656,750 22 22 100% 14 36 $26,547,800 $737,439 $717,000 31 35 100% 14 88 $84,578,299 $961,117 $842,000 149 132 101% 22 27 $22,653,499 $839,018 $725,000 39 32 103% 24 28 $36,970,300 $1,320,368 $1,133,750 55 50 99% 22 33 $24,954,500 $756,197 $700,000 55 50 103% 19 198 $154,142,431 $778,497 $772,500 352 453 99% 23 21 $15,362,100 $731,529 $706,000 12 15 99% 32 6 $3,191,100 $531,850 $540,000 16 14 100% 13 4 $1,910,000 $477,500 $478,500 5 8 99% 23 0 - - - 3 6 - - 57 $45,825,255 $803,952 $815,000 98 109 100% 22 12 $7,830,000 $652,500 $642,500 27 47 100% 23 37 $31,034,388 $838,767 $855,000 89 125 99% 21 52 $42,953,588 $826,031 $825,000 85 116 98% 23 9 $6,036,000 $670,667 $668,000 17 13 102% 19 128 $69,679,226 $544,369 $539,500 184 180 100% 21 31 $17,463,600 $563,342 $565,000 52 40 100% 15 1 $520,000 $520,000 $520,000 0 2 99% 21 16 $7,351,426 $459,464 $457,490 16 23 98% 28 17 $8,049,900 $473,524 $450,000 30 34 99% 29 27 $16,172,800 $598,993 $612,000 35 30 100% 19 0 - - - 0 0 - - 3 $1,899,800 $633,267 $634,900 2 4 100% 34 33 $18,221,700 $552,173 $540,000 49 47 100% 20 4 $2,044,000 $511,000 $504,500 7 5 99% 19 4 $2,044,000 $511,000 $504,500 7 5 99% 19 24 $12,038,288 $501,595 $480,000 48 72 98% 21 0 - - - 0 0 - - 4 $2,294,800 $573,700 $583,000 9 11 99% 26 2 $889,000 $444,500 $444,500 10 13 99% 15 7 $3,298,288 $471,184 $455,000 19 40 98% 18 11 $5,556,200 $505,109 $490,000 10 8 99% 23 1 1 1 1 2 3 4 5
- 18. Toronto Real Estate Board Market Watch, July 2019 SUMMARY OF EXISTING HOME TRANSACTIONS ATTACHED/ROW/TOWNHOUSE, JULY 2019 CITY OF TORONTO MUNICIPAL BREAKDOWN 18 Sales Dollar Volume Average Price Median Price New Listings Active Listings Avg. SP / LP Avg. DOM TREB Total City of Toronto Total Toronto West Toronto W01 Toronto W02 Toronto W03 Toronto W04 Toronto W05 Toronto W06 Toronto W07 Toronto W08 Toronto W09 Toronto W10 Toronto Central Toronto C01 Toronto C02 Toronto C03 Toronto C04 Toronto C06 Toronto C07 Toronto C08 Toronto C09 Toronto C10 Toronto C11 Toronto C12 Toronto C13 Toronto C14 Toronto C15 Toronto East Toronto E01 Toronto E02 Toronto E03 Toronto E04 Toronto E05 Toronto E06 Toronto E07 Toronto E08 Toronto E09 Toronto E10 Toronto E11 754 $536,635,618 $711,718 $667,750 1,183 1,244 100% 21 88 $84,578,299 $961,117 $842,000 149 132 101% 22 27 $22,653,499 $839,018 $725,000 39 32 103% 24 2 $2,087,000 $1,043,500 $1,043,500 1 1 113% 15 3 $3,335,000 $1,111,667 $1,208,000 4 2 110% 8 2 $1,196,000 $598,000 $598,000 4 1 98% 35 1 $650,000 $650,000 $650,000 4 4 109% 7 11 $7,552,500 $686,591 $670,000 13 11 99% 38 4 $3,764,000 $941,000 $967,500 6 8 103% 19 1 $1,100,000 $1,100,000 $1,100,000 2 2 104% 12 3 $2,968,999 $989,666 $985,000 3 1 101% 9 0 - - - 1 1 - - 0 - - - 1 1 - - 28 $36,970,300 $1,320,368 $1,133,750 55 50 99% 22 12 $15,444,000 $1,287,000 $1,240,500 20 16 101% 20 4 $4,051,000 $1,012,750 $868,000 6 4 101% 10 0 - - - 0 0 - - 2 $2,932,500 $1,466,250 $1,466,250 3 0 96% 7 0 - - - 0 0 - - 3 $2,858,800 $952,933 $945,000 5 5 99% 16 1 $875,000 $875,000 $875,000 8 4 110% 5 1 $3,500,000 $3,500,000 $3,500,000 2 2 95% 5 0 - - - 1 3 - - 0 - - - 0 1 - - 1 $2,647,500 $2,647,500 $2,647,500 1 2 92% 101 3 $3,161,500 $1,053,833 $1,020,000 1 1 97% 53 1 $1,500,000 $1,500,000 $1,500,000 8 12 94% 17 0 - - - 0 0 - - 33 $24,954,500 $756,197 $700,000 55 50 103% 19 4 $4,312,000 $1,078,000 $1,067,500 4 3 109% 22 3 $2,800,000 $933,333 $935,000 5 3 105% 12 1 $660,000 $660,000 $660,000 4 3 110% 7 4 $3,131,000 $782,750 $785,500 9 15 103% 25 2 $1,432,000 $716,000 $716,000 4 5 99% 12 0 - - - 2 2 - - 1 $737,000 $737,000 $737,000 2 2 105% 20 4 $2,843,000 $710,750 $712,500 4 6 101% 12 2 $1,170,000 $585,000 $585,000 1 0 98% 30 6 $3,926,500 $654,417 $679,250 10 7 101% 30 6 $3,943,000 $657,167 $652,500 10 4 101% 12 1 1 1 1 2 3 4 5
- 19. Toronto Real Estate Board Market Watch, July 2019 SUMMARY OF EXISTING HOME TRANSACTIONS CO-OP APARTMENT, JULY 2019 ALL TREB AREAS 19 Sales Dollar Volume Average Price Median Price New Listings Active Listings Avg. SP / LP Average DOM TREB Total Halton Region Burlington Halton Hills Milton Oakville Peel Region Brampton Caledon Mississauga City of Toronto Toronto West Toronto Central Toronto East York Region Aurora E. Gwillimbury Georgina King Markham Newmarket Richmond Hill Vaughan Whitchurch-Stouffville Durham Region Ajax Brock Clarington Oshawa Pickering Scugog Uxbridge Whitby Dufferin County Orangeville Simcoe County Adjala-Tosorontio Bradford West GwillimburyEssa Innisfil New Tecumseth 8 $5,481,564 $685,196 $712,500 10 10 107% 24 0 - - - 2 1 - - 0 - - - 1 1 - - 0 - - - 0 0 - - 0 - - - 0 0 - - 0 - - - 1 0 - - 0 - - - 1 1 - - 0 - - - 1 1 - - 0 - - - 0 0 - - 0 - - - 0 0 - - 8 $5,481,564 $685,196 $712,500 7 8 107% 24 1 $259,000 $259,000 $259,000 3 4 100% 4 5 $4,483,064 $896,613 $799,000 3 3 106% 31 2 $739,500 $369,750 $369,750 1 1 117% 17 0 - - - 0 0 - - 0 - - - 0 0 - - 0 - - - 0 0 - - 0 - - - 0 0 - - 0 - - - 0 0 - - 0 - - - 0 0 - - 0 - - - 0 0 - - 0 - - - 0 0 - - 0 - - - 0 0 - - 0 - - - 0 0 - - 0 - - - 0 0 - - 0 - - - 0 0 - - 0 - - - 0 0 - - 0 - - - 0 0 - - 0 - - - 0 0 - - 0 - - - 0 0 - - 0 - - - 0 0 - - 0 - - - 0 0 - - 0 - - - 0 0 - - 0 - - - 0 0 - - 0 - - - 0 0 - - 0 - - - 0 0 - - 0 - - - 0 0 - - 0 - - - 0 0 - - 0 - - - 0 0 - - 0 - - - 0 0 - - 0 - - - 0 0 - - 1 1 1 1 2 3 4 5
- 20. Toronto Real Estate Board Market Watch, July 2019 SUMMARY OF EXISTING HOME TRANSACTIONS CO-OP APARTMENT, JULY 2019 CITY OF TORONTO MUNICIPAL BREAKDOWN 20 Sales Dollar Volume Average Price Median Price New Listings Active Listings Avg. SP / LP Avg. DOM TREB Total City of Toronto Total Toronto West Toronto W01 Toronto W02 Toronto W03 Toronto W04 Toronto W05 Toronto W06 Toronto W07 Toronto W08 Toronto W09 Toronto W10 Toronto Central Toronto C01 Toronto C02 Toronto C03 Toronto C04 Toronto C06 Toronto C07 Toronto C08 Toronto C09 Toronto C10 Toronto C11 Toronto C12 Toronto C13 Toronto C14 Toronto C15 Toronto East Toronto E01 Toronto E02 Toronto E03 Toronto E04 Toronto E05 Toronto E06 Toronto E07 Toronto E08 Toronto E09 Toronto E10 Toronto E11 8 $5,481,564 $685,196 $712,500 10 10 107% 24 8 $5,481,564 $685,196 $712,500 7 8 107% 24 1 $259,000 $259,000 $259,000 3 4 100% 4 0 - - - 0 0 - - 0 - - - 0 0 - - 0 - - - 0 0 - - 0 - - - 0 0 - - 0 - - - 0 0 - - 1 $259,000 $259,000 $259,000 3 4 100% 4 0 - - - 0 0 - - 0 - - - 0 0 - - 0 - - - 0 0 - - 0 - - - 0 0 - - 5 $4,483,064 $896,613 $799,000 3 3 106% 31 1 $770,000 $770,000 $770,000 1 0 110% 15 0 - - - 0 1 - - 0 - - - 0 0 - - 0 - - - 0 0 - - 0 - - - 0 0 - - 1 $655,000 $655,000 $655,000 0 0 99% 12 0 - - - 1 1 - - 3 $3,058,064 $1,019,355 $910,000 1 1 107% 43 0 - - - 0 0 - - 0 - - - 0 0 - - 0 - - - 0 0 - - 0 - - - 0 0 - - 0 - - - 0 0 - - 0 - - - 0 0 - - 2 $739,500 $369,750 $369,750 1 1 117% 17 0 - - - 0 0 - - 1 $494,500 $494,500 $494,500 1 0 123% 7 0 - - - 0 0 - - 1 $245,000 $245,000 $245,000 0 1 107% 26 0 - - - 0 0 - - 0 - - - 0 0 - - 0 - - - 0 0 - - 0 - - - 0 0 - - 0 - - - 0 0 - - 0 - - - 0 0 - - 0 - - - 0 0 - - 1 1 1 1 2 3 4 5
- 21. Toronto Real Estate Board Market Watch, July 2019 SUMMARY OF EXISTING HOME TRANSACTIONS DETACHED CONDOMINIUM, JULY 2019 ALL TREB AREAS 21 Sales Dollar Volume Average Price Median Price New Listings Active Listings Avg. SP / LP Avg. DOM TREB Total Halton Region Burlington Halton Hills Milton Oakville Peel Region Brampton Caledon Mississauga City of Toronto Toronto West Toronto Central Toronto East York Region Aurora E. Gwillimbury Georgina King Markham Newmarket Richmond Hill Vaughan Whitchurch-Stouffville Durham Region Ajax Brock Clarington Oshawa Pickering Scugog Uxbridge Whitby Dufferin County Orangeville Simcoe County Adjala-Tosorontio Bradford West GwillimburyEssa Innisfil New Tecumseth 9 $5,232,000 $581,333 $545,000 16 33 98% 35 2 $1,316,500 $658,250 $658,250 0 0 99% 32 2 $1,316,500 $658,250 $658,250 0 0 99% 32 0 - - - 0 0 - - 0 - - - 0 0 - - 0 - - - 0 0 - - 1 $580,000 $580,000 $580,000 8 9 100% 44 0 - - - 6 6 - - 0 - - - 0 1 - - 1 $580,000 $580,000 $580,000 2 2 100% 44 1 $545,000 $545,000 $545,000 1 0 99% 0 0 - - - 0 0 - - 0 - - - 0 0 - - 1 $545,000 $545,000 $545,000 1 0 99% 0 0 - - - 1 0 - - 0 - - - 0 0 - - 0 - - - 0 0 - - 0 - - - 0 0 - - 0 - - - 0 0 - - 0 - - - 0 0 - - 0 - - - 0 0 - - 0 - - - 0 0 - - 0 - - - 1 0 - - 0 - - - 0 0 - - 1 $444,500 $444,500 $444,500 0 0 97% 51 1 $444,500 $444,500 $444,500 0 0 97% 51 0 - - - 0 0 - - 0 - - - 0 0 - - 0 - - - 0 0 - - 0 - - - 0 0 - - 0 - - - 0 0 - - 0 - - - 0 0 - - 0 - - - 0 0 - - 0 - - - 0 0 - - 0 - - - 0 0 - - 4 $2,346,000 $586,500 $529,000 6 24 97% 39 0 - - - 0 0 - - 0 - - - 0 0 - - 0 - - - 0 0 - - 0 - - - 0 0 - - 4 $2,346,000 $586,500 $529,000 6 24 97% 39 1 1 1 1 2 3 4 5
- 22. Toronto Real Estate Board Market Watch, July 2019 SUMMARY OF EXISTING HOME TRANSACTIONS DETACHED CONDOMINIUM, JULY 2019 CITY OF TORONTO MUNICIPAL BREAKDOWN 22 Sales Dollar Volume Average Price Median Price New Listings Active Listings Avg. SP / LP Avg. DOM TREB Total City of Toronto Total Toronto West Toronto W01 Toronto W02 Toronto W03 Toronto W04 Toronto W05 Toronto W06 Toronto W07 Toronto W08 Toronto W09 Toronto W10 Toronto Central Toronto C01 Toronto C02 Toronto C03 Toronto C04 Toronto C06 Toronto C07 Toronto C08 Toronto C09 Toronto C10 Toronto C11 Toronto C12 Toronto C13 Toronto C14 Toronto C15 Toronto East Toronto E01 Toronto E02 Toronto E03 Toronto E04 Toronto E05 Toronto E06 Toronto E07 Toronto E08 Toronto E09 Toronto E10 Toronto E11 9 $5,232,000 $581,333 $545,000 16 33 98% 35 1 $545,000 $545,000 $545,000 1 0 99% 0 0 - - - 0 0 - - 0 - - - 0 0 - - 0 - - - 0 0 - - 0 - - - 0 0 - - 0 - - - 0 0 - - 0 - - - 0 0 - - 0 - - - 0 0 - - 0 - - - 0 0 - - 0 - - - 0 0 - - 0 - - - 0 0 - - 0 - - - 0 0 - - 0 - - - 0 0 - - 0 - - - 0 0 - - 0 - - - 0 0 - - 0 - - - 0 0 - - 0 - - - 0 0 - - 0 - - - 0 0 - - 0 - - - 0 0 - - 0 - - - 0 0 - - 0 - - - 0 0 - - 0 - - - 0 0 - - 0 - - - 0 0 - - 0 - - - 0 0 - - 0 - - - 0 0 - - 0 - - - 0 0 - - 0 - - - 0 0 - - 1 $545,000 $545,000 $545,000 1 0 99% 0 0 - - - 0 0 - - 0 - - - 0 0 - - 0 - - - 0 0 - - 0 - - - 0 0 - - 0 - - - 0 0 - - 0 - - - 0 0 - - 0 - - - 0 0 - - 0 - - - 0 0 - - 0 - - - 0 0 - - 0 - - - 0 0 - - 1 $545,000 $545,000 $545,000 1 0 99% 0 1 1 1 1 2 3 4 5
- 23. Toronto Real Estate Board Market Watch, July 2019 SUMMARY OF EXISTING HOME TRANSACTIONS CO-OWNERSHIP APARTMENT, JULY 2019 ALL TREB AREAS 23 Sales Dollar Volume Average Price Median Price New Listings Active Listings Avg. SP / LP Avg. DOM TREB Total Halton Region Burlington Halton Hills Milton Oakville Peel Region Brampton Caledon Mississauga City of Toronto Toronto West Toronto Central Toronto East York Region Aurora E. Gwillimbury Georgina King Markham Newmarket Richmond Hill Vaughan Whitchurch-Stouffville Durham Region Ajax Brock Clarington Oshawa Pickering Scugog Uxbridge Whitby Dufferin County Orangeville Simcoe County Adjala-Tosorontio Bradford West GwillimburyEssa Innisfil New Tecumseth 5 $1,947,000 $389,400 $428,000 3 5 100% 22 0 - - - 0 0 - - 0 - - - 0 0 - - 0 - - - 0 0 - - 0 - - - 0 0 - - 0 - - - 0 0 - - 0 - - - 0 0 - - 0 - - - 0 0 - - 0 - - - 0 0 - - 0 - - - 0 0 - - 5 $1,947,000 $389,400 $428,000 3 5 100% 22 1 $219,000 $219,000 $219,000 1 0 100% 12 4 $1,728,000 $432,000 $431,500 2 5 101% 25 0 - - - 0 0 - - 0 - - - 0 0 - - 0 - - - 0 0 - - 0 - - - 0 0 - - 0 - - - 0 0 - - 0 - - - 0 0 - - 0 - - - 0 0 - - 0 - - - 0 0 - - 0 - - - 0 0 - - 0 - - - 0 0 - - 0 - - - 0 0 - - 0 - - - 0 0 - - 0 - - - 0 0 - - 0 - - - 0 0 - - 0 - - - 0 0 - - 0 - - - 0 0 - - 0 - - - 0 0 - - 0 - - - 0 0 - - 0 - - - 0 0 - - 0 - - - 0 0 - - 0 - - - 0 0 - - 0 - - - 0 0 - - 0 - - - 0 0 - - 0 - - - 0 0 - - 0 - - - 0 0 - - 0 - - - 0 0 - - 0 - - - 0 0 - - 0 - - - 0 0 - - 1 1 1 1 2 3 4 5
- 24. Toronto Real Estate Board Market Watch, July 2019 SUMMARY OF EXISTING HOME TRANSACTIONS CO-OWNERSHIP APARTMENT, JULY 2019 CITY OF TORONTO MUNICIPAL BREAKDOWN 24 Sales Dollar Volume Average Price Median Price New Listings Active Listings Avg. SP / LP Avg. DOM TREB Total City of Toronto Total Toronto West Toronto W01 Toronto W02 Toronto W03 Toronto W04 Toronto W05 Toronto W06 Toronto W07 Toronto W08 Toronto W09 Toronto W10 Toronto Central Toronto C01 Toronto C02 Toronto C03 Toronto C04 Toronto C06 Toronto C07 Toronto C08 Toronto C09 Toronto C10 Toronto C11 Toronto C12 Toronto C13 Toronto C14 Toronto C15 Toronto East Toronto E01 Toronto E02 Toronto E03 Toronto E04 Toronto E05 Toronto E06 Toronto E07 Toronto E08 Toronto E09 Toronto E10 Toronto E11 5 $1,947,000 $389,400 $428,000 3 5 100% 22 5 $1,947,000 $389,400 $428,000 3 5 100% 22 1 $219,000 $219,000 $219,000 1 0 100% 12 0 - - - 0 0 - - 0 - - - 0 0 - - 0 - - - 0 0 - - 0 - - - 0 0 - - 1 $219,000 $219,000 $219,000 1 0 100% 12 0 - - - 0 0 - - 0 - - - 0 0 - - 0 - - - 0 0 - - 0 - - - 0 0 - - 0 - - - 0 0 - - 4 $1,728,000 $432,000 $431,500 2 5 101% 25 0 - - - 0 0 - - 0 - - - 0 1 - - 1 $435,000 $435,000 $435,000 1 1 100% 3 0 - - - 0 2 - - 0 - - - 0 0 - - 0 - - - 0 0 - - 1 $520,000 $520,000 $520,000 1 0 104% 12 0 - - - 0 0 - - 0 - - - 0 0 - - 0 - - - 0 0 - - 0 - - - 0 0 - - 2 $773,000 $386,500 $386,500 0 1 98% 42 0 - - - 0 0 - - 0 - - - 0 0 - - 0 - - - 0 0 - - 0 - - - 0 0 - - 0 - - - 0 0 - - 0 - - - 0 0 - - 0 - - - 0 0 - - 0 - - - 0 0 - - 0 - - - 0 0 - - 0 - - - 0 0 - - 0 - - - 0 0 - - 0 - - - 0 0 - - 0 - - - 0 0 - - 0 - - - 0 0 - - 1 1 1 1 2 3 4 5
- 25. Toronto Real Estate Board Market Watch, July 2019 FOCUS ON THE MLS HOME PRICE INDEX INDEX AND BENCHMARK PRICE, JULY 2019 ALL TREB AREAS 25 Composite Single-Family Detached Single-Family Attached Townhouse Apartment Index Benchmark Yr./Yr. % Chg. Index Benchmark Yr./Yr. % Chg. Index Benchmark Yr./Yr. % Chg. Index Benchmark Yr./Yr. % Chg. Index Benchmark Yr./Yr. % Chg. TREB Total Halton Region Burlington Halton Hills Milton Oakville Peel Region Brampton Caledon Mississauga City of Toronto York Region Aurora East Gwillimbury Georgina King Markham Newmarket Richmond Hill Vaughan Whitchurch-Stouffville Durham Region Ajax Brock Clarington Oshawa Pickering Scugog Uxbridge Whitby Dufferin County Orangeville Simcoe County Adjala-Tosorontio Bradford West GwillimburyEssa Innisfil New Tecumseth 264.0 $800,900 4.43% 255.5 $943,300 2.45% 263.5 $740,800 2.97% 268.7 $593,200 4.67% 272.1 $543,100 8.41% 274.5 $885,100 5.05% 270.7 $998,500 4.84% 277.0 $708,700 1.95% 300.6 $554,500 4.70% 266.7 $493,200 8.02% 282.5 $767,400 8.61% 277.2 $938,400 9.52% 290.9 $697,900 2.07% 310.0 $569,700 4.73% 267.4 $440,200 8.66% 259.0 $766,500 5.80% 255.5 $831,300 4.84% 265.4 $601,400 5.19% 286.7 $460,800 10.78% 254.7 $515,000 9.22% 259.6 $769,500 4.38% 256.0 $916,100 4.70% 269.2 $650,600 4.26% 268.3 $444,300 2.64% 264.3 $538,300 8.10% 277.2 $1,014,000 2.25% 275.7 $1,165,400 2.07% 279.1 $779,300 -0.78% 291.9 $631,600 2.53% 267.3 $513,500 7.39% 258.9 $734,100 6.11% 251.8 $889,000 4.61% 257.9 $660,200 4.67% 257.9 $553,700 6.26% 270.2 $463,300 12.49% 258.6 $655,700 4.74% 252.3 $736,900 4.73% 260.0 $609,800 4.80% 257.2 $470,300 4.21% 254.5 $379,900 10.60% 219.9 $807,500 1.85% 219.4 $834,000 1.72% 253.8 $627,000 3.51% - - - 234.6 $570,300 -1.76% 262.5 $777,200 7.63% 257.4 $1,028,100 4.93% 255.0 $703,300 4.55% 258.1 $580,200 7.05% 272.9 $479,400 12.82% 273.4 $886,500 5.64% 258.5 $1,134,300 1.93% 274.4 $914,700 3.66% 270.5 $643,900 2.73% 279.8 $574,700 8.32% 253.6 $855,600 -0.43% 256.9 $977,600 -1.34% 255.7 $739,800 0.16% 237.1 $608,900 -0.04% 229.1 $502,500 4.66% 251.6 $832,600 -0.28% 250.5 $946,200 -0.75% 255.8 $659,700 2.57% 236.0 $645,900 -0.63% 245.4 $513,000 -2.04% 225.2 $769,500 -1.96% 229.8 $819,000 -1.71% 230.1 $481,300 -2.95% - - - - - - 239.7 $456,700 0.88% 245.9 $463,600 0.86% 241.4 $475,900 -0.41% - - - - - - 233.2 $975,600 1.26% 234.0 $973,400 0.99% 231.0 $541,000 2.26% - - - 235.6 $644,400 1.86% 260.1 $900,100 0.42% 278.9 $1,147,400 -0.85% 265.3 $793,400 1.11% 229.0 $608,700 -0.26% 221.8 $530,900 8.04% 230.0 $677,700 -1.12% 230.2 $775,900 -1.37% 228.8 $538,900 -1.12% 226.3 $469,900 -1.01% 261.9 $441,200 -2.68% 268.6 $964,200 -3.00% 284.0 $1,206,900 -4.25% 266.3 $809,300 -1.41% 236.6 $599,800 -0.55% 235.6 $479,500 3.51% 251.3 $908,700 0.32% 243.4 $1,011,800 -0.12% 255.7 $774,600 0.16% 269.1 $731,700 1.51% 228.7 $527,700 2.56% 261.3 $900,500 3.94% 259.4 $930,600 3.02% 232.0 $637,200 3.80% 216.5 $388,600 3.44% 251.1 $557,900 -1.84% 243.0 $567,500 2.57% 237.9 $618,200 2.28% 249.8 $498,900 2.80% 249.6 $395,900 4.70% 247.3 $419,700 2.61% 243.9 $600,100 2.05% 242.7 $651,100 1.89% 249.2 $537,700 2.64% 232.6 $425,200 4.07% 238.8 $387,100 4.01% 199.4 $362,700 2.20% 200.4 $365,700 2.09% - - - - - - - - - 242.8 $512,800 4.07% 235.7 $567,600 3.92% 237.7 $454,100 4.16% 274.0 $429,300 1.00% 227.1 $336,300 3.75% 249.1 $475,100 3.96% 239.9 $512,000 3.72% 267.0 $446,900 3.69% 270.8 $336,300 4.48% 239.2 $331,600 3.46% 249.5 $668,500 2.55% 243.0 $756,900 1.93% 256.1 $597,600 3.89% 243.2 $434,300 5.33% 279.5 $521,400 1.19% 224.8 $586,900 1.03% 232.5 $602,300 1.09% 217.8 $455,800 5.42% - - - - - - 226.3 $691,700 2.40% 225.0 $694,800 2.27% 227.1 $557,300 2.81% - - - - - - 237.5 $618,100 0.21% 237.2 $682,200 -0.55% 241.3 $531,600 0.17% 206.2 $375,400 5.69% 230.1 $417,000 1.72% 260.9 $598,000 1.28% 272.6 $621,200 1.53% 252.8 $473,700 1.16% - - - - - - 260.9 $598,000 1.28% 272.6 $621,200 1.53% 252.8 $473,700 1.16% - - - - - - 242.9 $532,100 1.34% 237.0 $534,200 0.85% 244.7 $453,500 -2.08% - - - - - - 224.4 $675,200 6.86% 224.5 $677,100 7.06% - - - - - - - - - 237.3 $578,300 -4.81% 259.0 $708,500 11.64% 263.3 $547,200 1.50% - - - - - - 263.5 $510,800 5.53% 256.1 $516,700 4.15% 261.6 $406,400 1.95% - - - - - - 262.3 $505,800 7.59% 242.1 $466,100 -1.18% 260.0 $397,500 5.86% - - - - - - 230.4 $547,500 6.18% 223.7 $567,400 5.67% 244.5 $443,300 6.72% - - - - - -
- 26. Toronto Real Estate Board Market Watch, July 2019 FOCUS ON THE MLS HOME PRICE INDEX INDEX AND BENCHMARK PRICE, JULY 2019 CITY OF TORONTO 26 Composite Single-Family Detached Single-Family Attached Townhouse Apartment Index Benchmark Yr./Yr. % Chg. Index Benchmark Yr./Yr. % Chg. Index Benchmark Yr./Yr. % Chg. Index Benchmark Yr./Yr. % Chg. Index Benchmark Yr./Yr. % Chg. TREB Total City of Toronto Toronto W01 Toronto W02 Toronto W03 Toronto W04 Toronto W05 Toronto W06 Toronto W07 Toronto W08 Toronto W09 Toronto W10 Toronto C01 Toronto C02 Toronto C03 Toronto C04 Toronto C06 Toronto C07 Toronto C08 Toronto C09 Toronto C10 Toronto C11 Toronto C12 Toronto C13 Toronto C14 Toronto C15 Toronto E01 Toronto E02 Toronto E03 Toronto E04 Toronto E05 Toronto E06 Toronto E07 Toronto E08 Toronto E09 Toronto E10 Toronto E11 264.0 $800,900 4.43% 255.5 $943,300 2.45% 263.5 $740,800 2.97% 268.7 $593,200 4.67% 272.1 $543,100 8.41% 273.4 $886,500 5.64% 258.5 $1,134,300 1.93% 274.4 $914,700 3.66% 270.5 $643,900 2.73% 279.8 $574,700 8.32% 267.0 $1,076,100 7.57% 250.2 $1,305,600 3.05% 267.5 $1,031,500 2.81% 264.6 $560,000 0.80% 273.8 $619,000 11.48% 291.3 $1,036,700 6.39% 275.0 $1,163,300 6.63% 312.6 $958,100 4.41% 276.3 $651,100 2.79% 302.7 $649,800 10.23% 293.5 $755,400 2.87% 293.6 $798,100 2.26% 285.8 $732,000 2.18% 276.6 $564,200 1.62% 302.8 $517,400 8.30% 264.6 $677,400 2.40% 257.2 $810,000 0.31% 244.7 $707,600 0.62% 238.5 $563,600 1.40% 279.8 $409,800 5.43% 257.2 $610,500 8.39% 253.6 $841,100 5.01% 234.2 $683,800 5.88% 253.0 $459,400 9.48% 284.7 $374,100 12.00% 222.1 $650,500 5.71% 282.3 $901,400 2.47% 226.8 $687,300 1.52% 292.2 $869,000 0.24% 191.9 $486,200 8.91% 243.7 $1,044,700 3.97% 257.4 $1,115,600 3.17% 222.5 $912,300 1.51% - - - 159.9 $648,400 3.43% 231.1 $921,400 3.96% 218.8 $1,143,700 1.91% 214.5 $794,600 1.56% 255.8 $615,200 2.65% 239.4 $498,500 5.51% 252.9 $636,600 5.59% 238.4 $889,000 3.92% 211.7 $608,700 3.12% 289.6 $753,500 3.69% 264.0 $338,500 7.76% 263.4 $606,700 8.98% 258.7 $776,100 5.08% 260.8 $667,400 4.91% 231.2 $492,400 5.47% 274.2 $380,900 13.21% 311.1 $768,700 9.47% 310.5 $1,175,900 11.37% 295.7 $1,035,100 9.72% 283.1 $807,600 3.93% 312.7 $651,000 9.76% 276.0 $1,322,700 6.32% 242.7 $1,939,100 4.70% 275.1 $1,442,800 2.27% 273.2 $1,220,000 1.98% 279.6 $796,600 8.54% 307.6 $1,606,600 5.56% 285.2 $1,752,700 6.46% 304.0 $1,127,300 6.52% - - - 343.5 $898,500 3.12% 245.8 $1,516,900 -0.45% 244.9 $1,725,400 -1.69% 251.1 $1,175,600 2.07% 0.0 $0 -100.00% 241.5 $558,600 3.29% 283.8 $1,105,200 3.24% 257.2 $1,098,600 -2.58% 215.5 $797,200 4.76% 249.6 $669,400 1.38% 310.1 $685,800 7.56% 263.2 $910,600 2.53% 285.8 $1,307,400 -3.45% 201.1 $719,600 -4.51% 250.2 $705,200 3.60% 254.8 $622,200 6.88% 289.2 $756,300 9.75% 283.5 $1,654,000 0.93% 279.1 $1,331,400 0.65% 285.0 $737,000 6.70% 289.8 $626,500 10.48% 193.8 $1,371,800 2.27% 142.5 $1,790,000 2.67% 156.7 $1,275,100 2.62% 295.8 $1,620,100 5.42% 221.5 $733,800 0.54% 287.9 $1,124,000 8.89% 258.2 $1,594,100 4.96% 240.3 $1,187,100 2.26% 277.6 $810,300 5.07% 303.3 $724,300 10.01% 272.7 $965,000 1.94% 211.3 $1,439,400 0.96% 246.4 $1,091,000 2.67% 221.0 $382,800 -4.78% 319.1 $463,300 2.28% 220.8 $1,883,800 1.24% 203.6 $2,182,100 1.85% 256.8 $1,074,900 -0.08% 199.3 $797,400 -5.23% 280.1 $878,200 3.63% 254.2 $920,400 4.39% 244.8 $1,305,500 0.37% 219.7 $701,000 -0.50% 235.8 $681,700 -1.91% 264.4 $532,400 8.85% 273.6 $894,600 4.47% 264.3 $1,429,800 -6.87% 213.4 $1,039,100 -8.65% 299.9 $807,600 -5.72% 273.2 $688,000 8.80% 248.1 $805,200 0.85% 277.8 $1,304,400 -3.68% 227.5 $739,600 -5.17% 271.6 $650,100 -3.45% 236.7 $550,400 5.95% 348.1 $1,087,100 5.10% 335.3 $1,183,100 3.74% 347.9 $1,097,400 3.42% 395.5 $723,400 6.86% 339.7 $805,800 9.26% 297.2 $1,112,900 3.99% 256.6 $1,169,100 3.26% 314.1 $1,051,800 4.70% 322.3 $928,300 4.98% 284.1 $776,700 4.53% 272.0 $836,800 2.80% 276.0 $930,500 2.18% 257.4 $842,900 1.54% - - - 274.2 $400,500 7.40% 272.9 $674,000 4.64% 254.1 $749,100 4.31% 266.1 $641,200 5.09% 260.6 $564,900 4.57% 312.1 $478,900 4.98% 251.2 $659,100 1.58% 257.1 $905,400 -0.12% 246.8 $680,100 -1.36% 254.9 $554,300 0.95% 244.4 $480,000 4.49% 274.3 $764,900 3.43% 271.1 $774,300 2.22% 271.7 $646,300 2.41% 0.0 $0 -100.00% 283.5 $599,500 8.66% 270.0 $661,800 3.81% 270.0 $885,000 1.69% 260.0 $679,900 1.44% 267.5 $579,500 -0.19% 272.7 $467,000 6.61% 275.1 $663,900 4.32% 257.8 $803,600 2.42% 229.4 $594,600 0.26% 275.2 $561,700 1.70% 307.6 $490,700 8.16% 263.9 $631,000 4.60% 254.8 $723,500 5.12% 244.2 $597,300 4.40% 295.5 $549,100 2.57% 268.9 $504,400 4.43% 266.4 $746,700 2.50% 252.5 $809,100 2.43% 248.1 $643,300 2.73% 318.0 $555,200 0.60% 267.8 $431,700 3.88% 277.1 $606,100 7.82% 276.6 $769,400 5.41% 275.7 $624,400 6.28% 220.9 $433,500 11.90% 320.3 $478,000 9.02%
- 27. Toronto Real Estate Board Market Watch, July 2019 HISTORIC ANNUAL STATISTICS 27 Year Sales Average Price 2007 2008 2009 2010 2011 2012 2013 2014 2015 2016 2017 93,193 $376,236 74,552 $379,347 87,308 $395,460 85,545 $431,276 89,096 $465,014 85,496 $497,130 87,049 $522,958 92,782 $566,624 101,213 $622,121 113,040 $729,837 92,263 $822,572 2018 MONTHLY STATISTICS NOTES 1 - Sales, dollar volume, average sale prices and median sale prices are based on firm transactions entered into the TREB MLS® system between the first and last day of the month/period being reported. 2 - New listings entered into the TREB MLS® system between the first and last day of the month/period being reported. 3 - Active listings at the end of the last day of the month/period being reported. 4 - Ratio of the average selling price to the average listing price for firm transactions entered into the TREB MLS® system between the first and last day of the month/period being reported. 5 - Average number of days on the market for firm transactions entered into the TREB MLS® system between the first and last day of the month/period being reported. 6 - Due to past changes to TREB's service area, caution should be exercised when making historical comparisons. 7 - Past monthly and year-to-date figures are revised on a monthly basis. 8 - SNLR = Sales-to-New Listings Ratio. Calculated using a 12-month moving average (sales/new listings). 9 - Mos. Inv. = Months of Inventory. Calculated using a 12-month moving average (active listings/sales). 2019 MONTHLY STATISTICS *For historic annual sales and average price data over a longer time frame go to: January February March April May June July August September October November December Year to Date 3,969 $747,515 4,983 $779,748 7,138 $788,153 9,008 $820,536 9,961 $838,220 8,849 $831,737 8,595 $806,755 - - - - - - - - - - 52,503 $801,809 January February March April May June July August September October November December Annual 3,987 $735,874 5,148 $767,801 7,188 $784,514 7,742 $804,894 8,402 $809,305 8,024 $808,066 6,916 $781,918 6,797 $765,252 6,414 $796,782 7,448 $807,538 6,207 $787,559 3,747 $749,019 78,020 $787,876 1,6,7 1,7 1,7 http://www.torontorealestateboard.com/market_news/market_watch/historic_stats/p df/TREB_historic_statistics.pdf Copyright® 2019 Toronto Real Estate Board $809,72952,503