Download to read offline
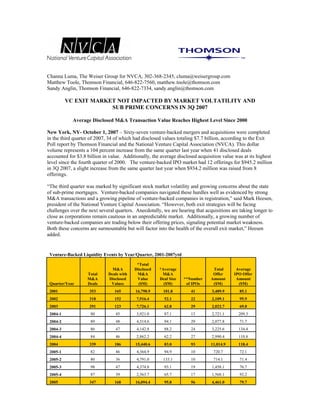
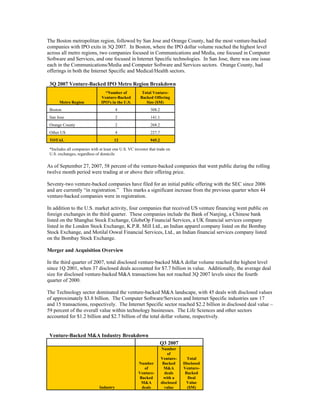
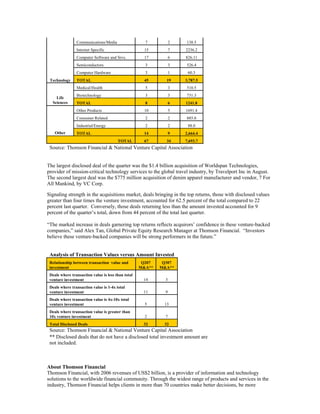
The venture capital exit market remained strong in the third quarter of 2007 despite stock market volatility and concerns about subprime mortgages. There were 67 M&A deals totaling $7.7 billion, with the average deal size the highest since 2000. Additionally, there were 12 IPOs that raised $945.2 million. While exits face challenges in the coming quarters as acquisitions take longer to close and some IPOs trade below offering prices, the third quarter exit market demonstrated resilience.