Download to read offline


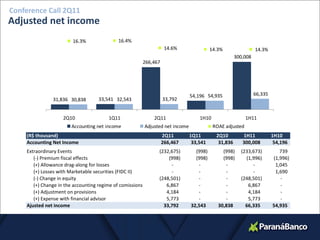


This document summarizes the key financial information from Paraná Banco's 2Q11 conference call. Some of the highlights include: - Adjusted net income for 1H11 was R$66.3 million, a 20.8% increase from 1H10. - Total assets reached R$3,258.6 million in 2Q11, a 10.3% increase from 2Q10. - Loan portfolio totaled R$1,753.1 million in 2Q11, a 22.5% increase from 2Q10. - Fitch upgraded Paraná Banco's rating from "A-(bra)" to "A(bra)".


