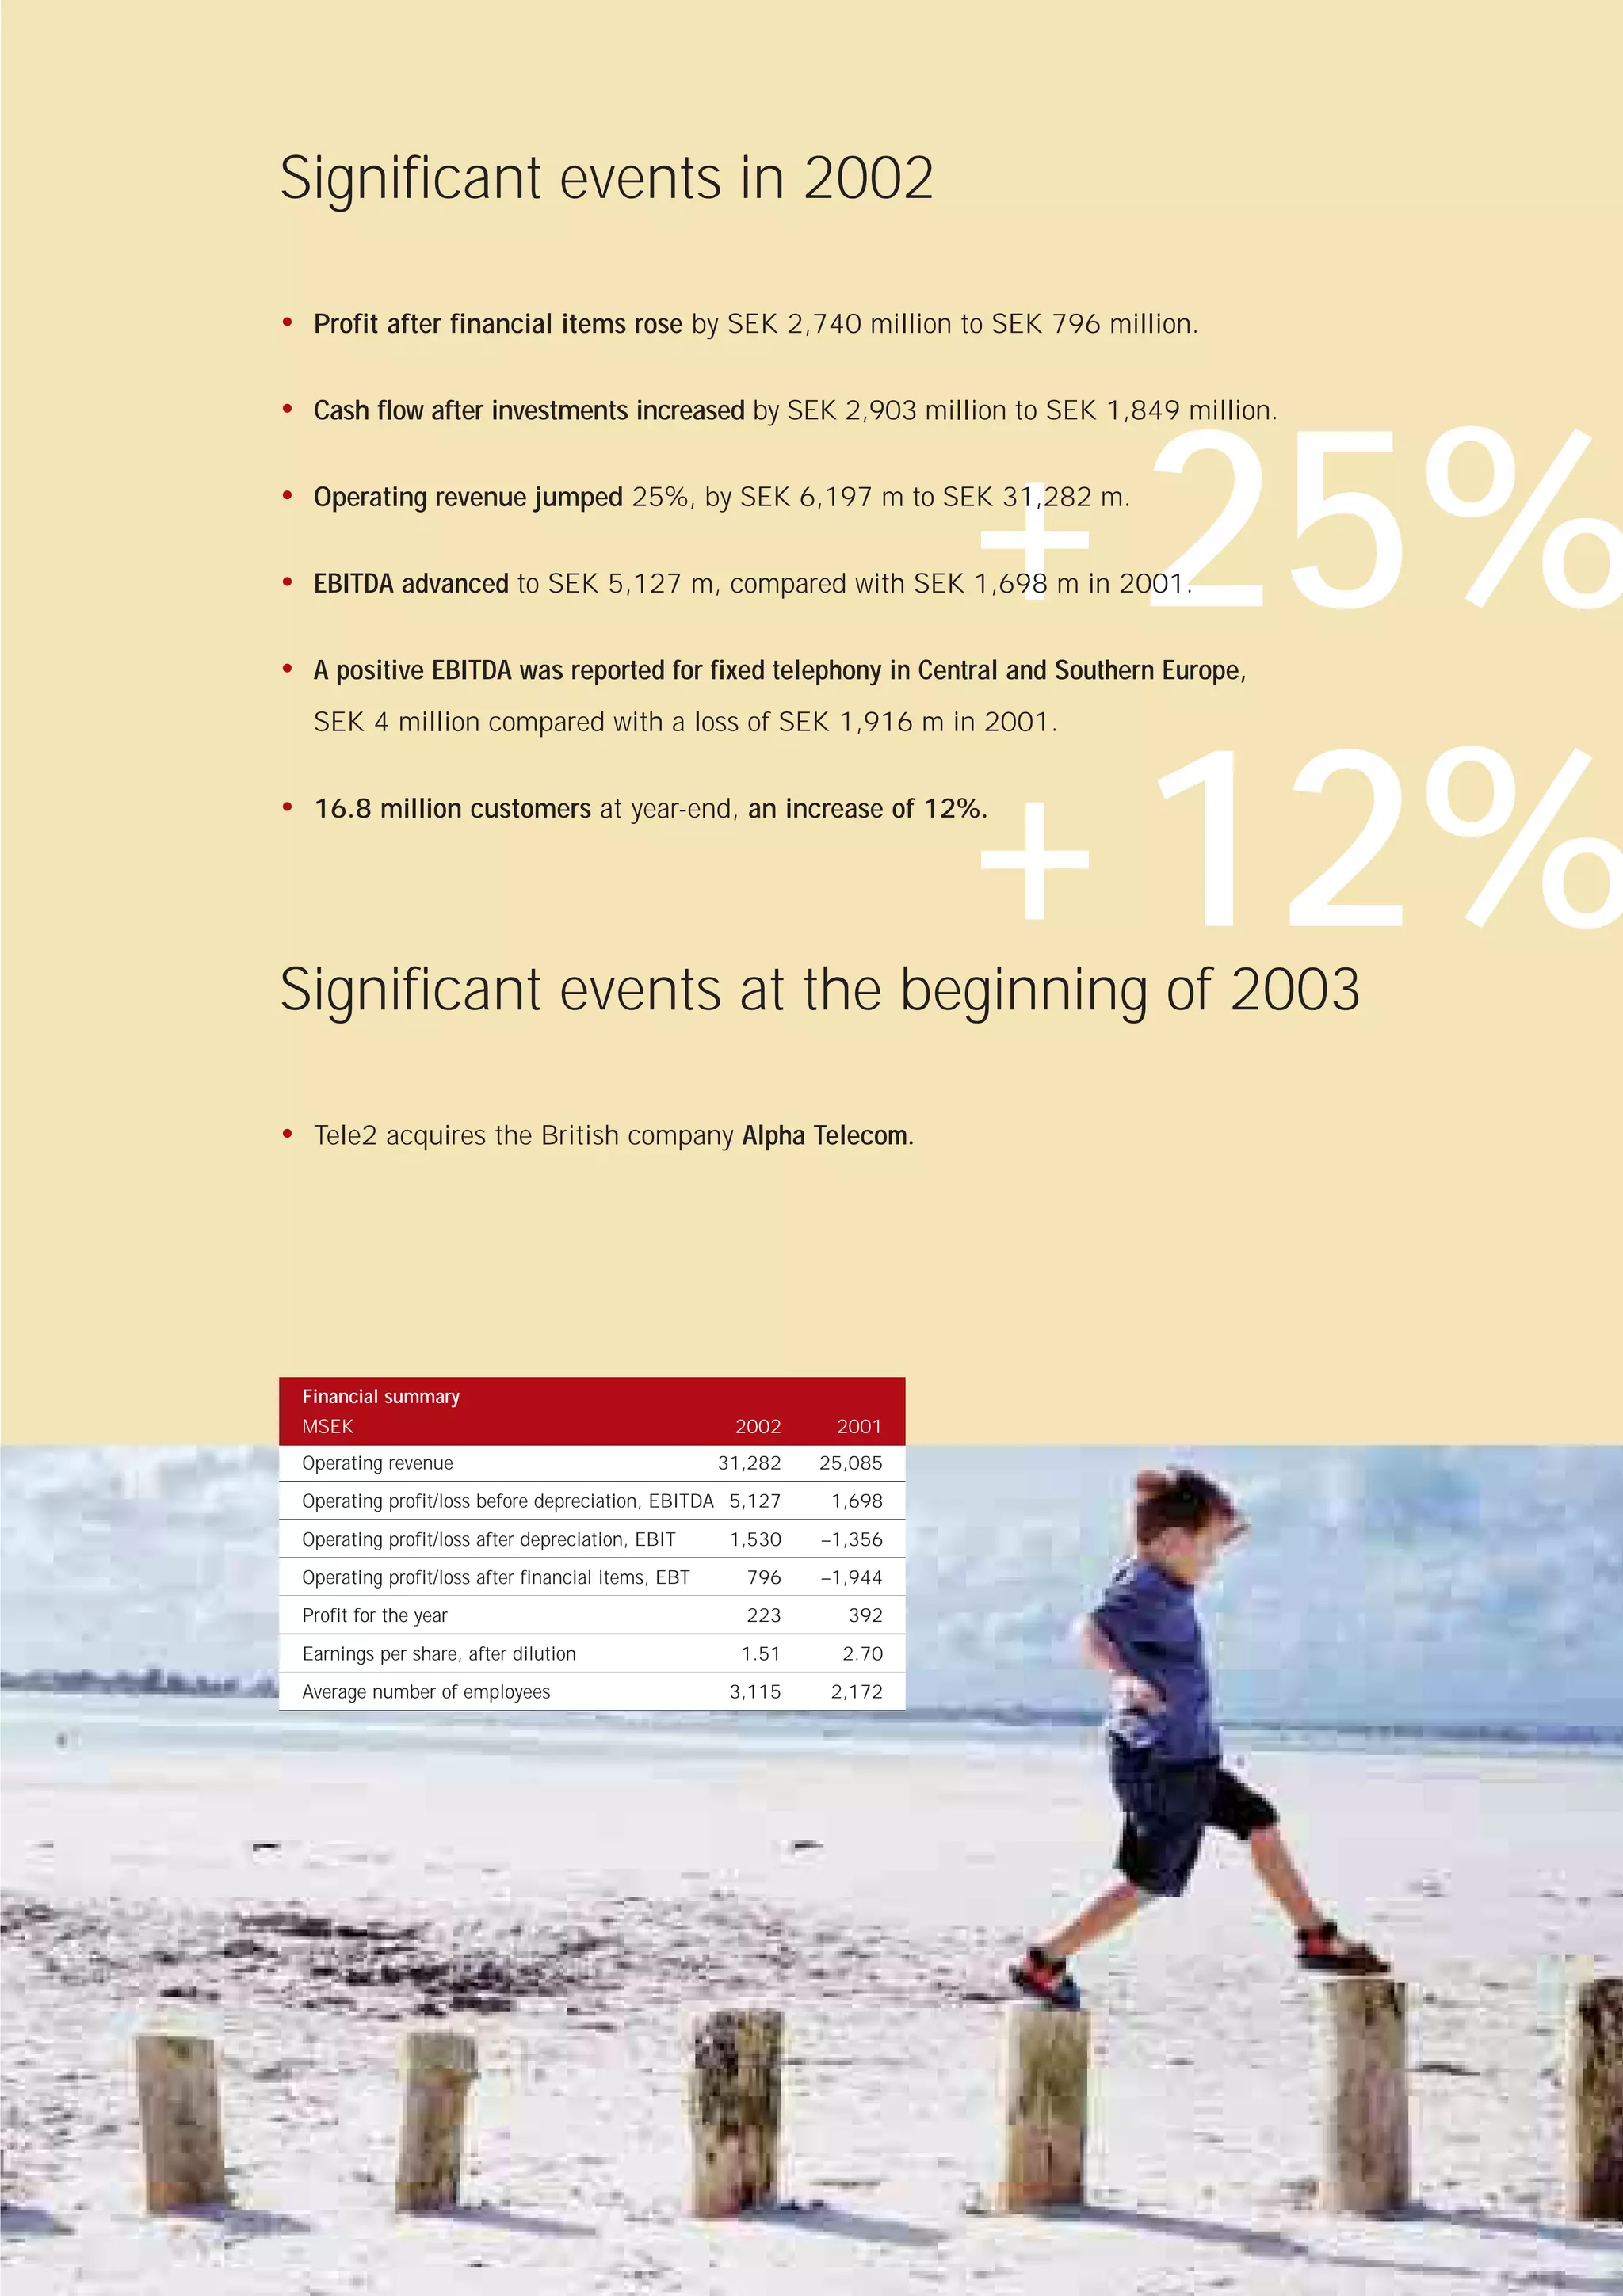
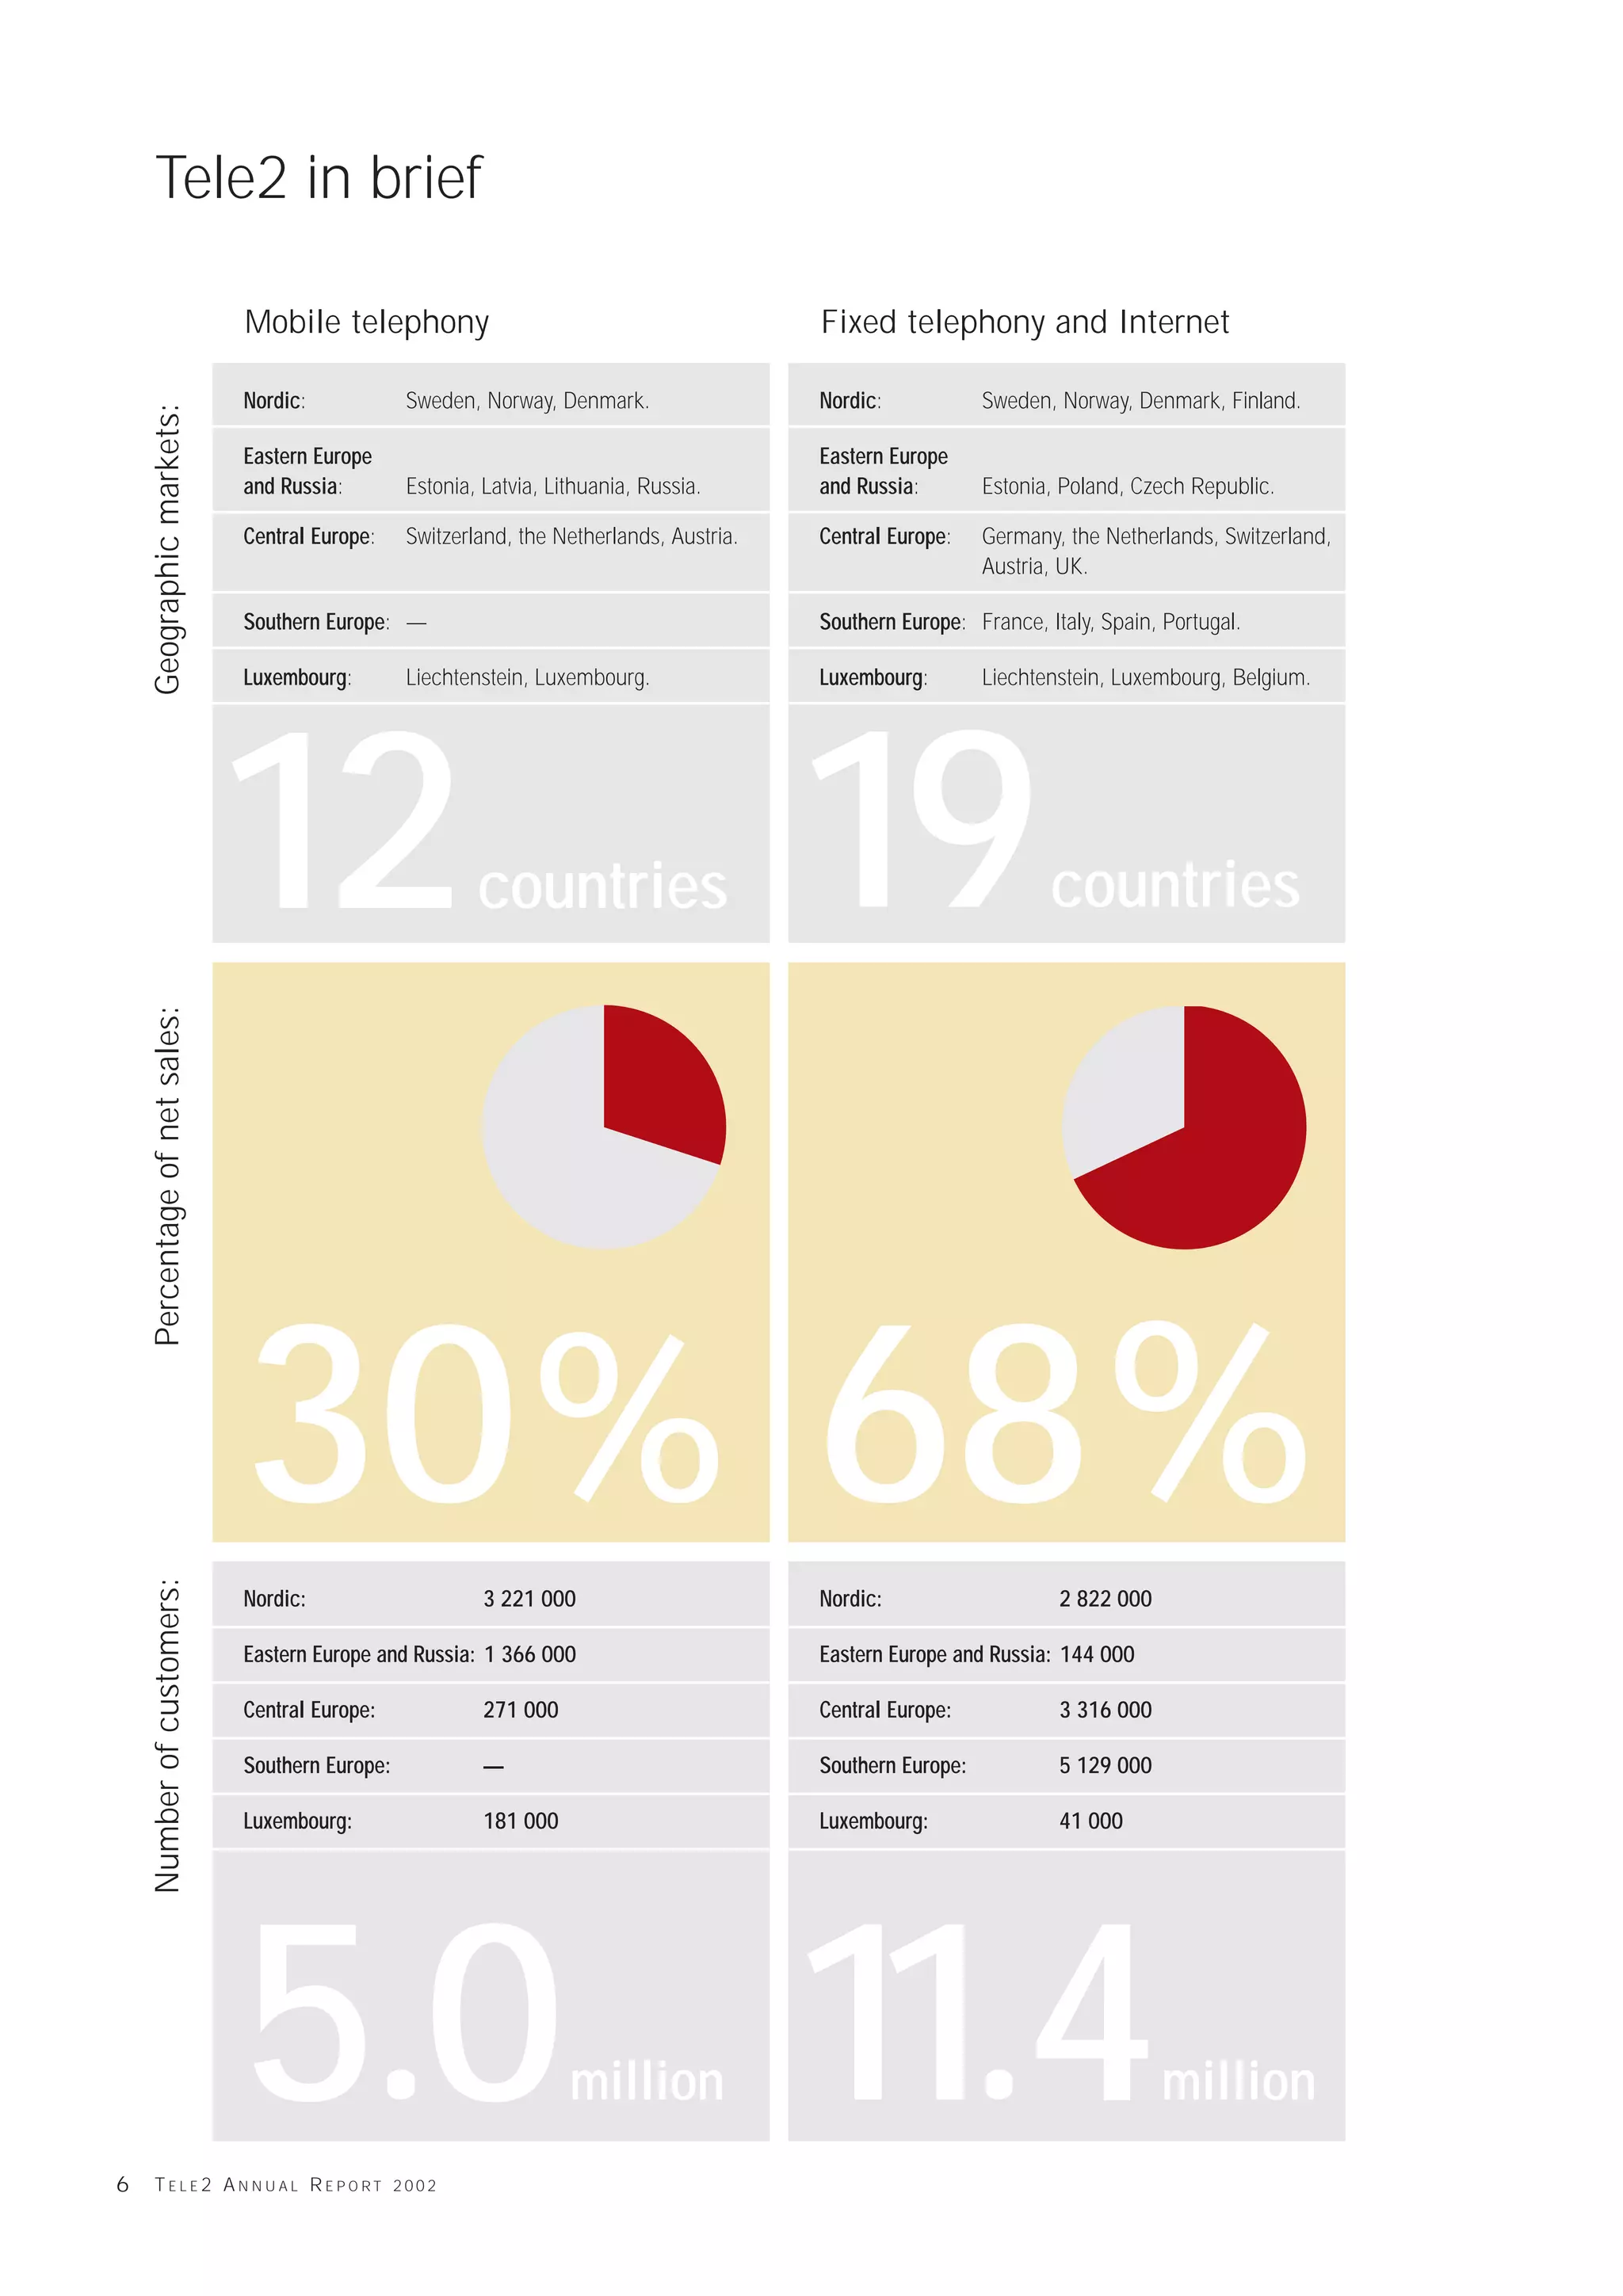
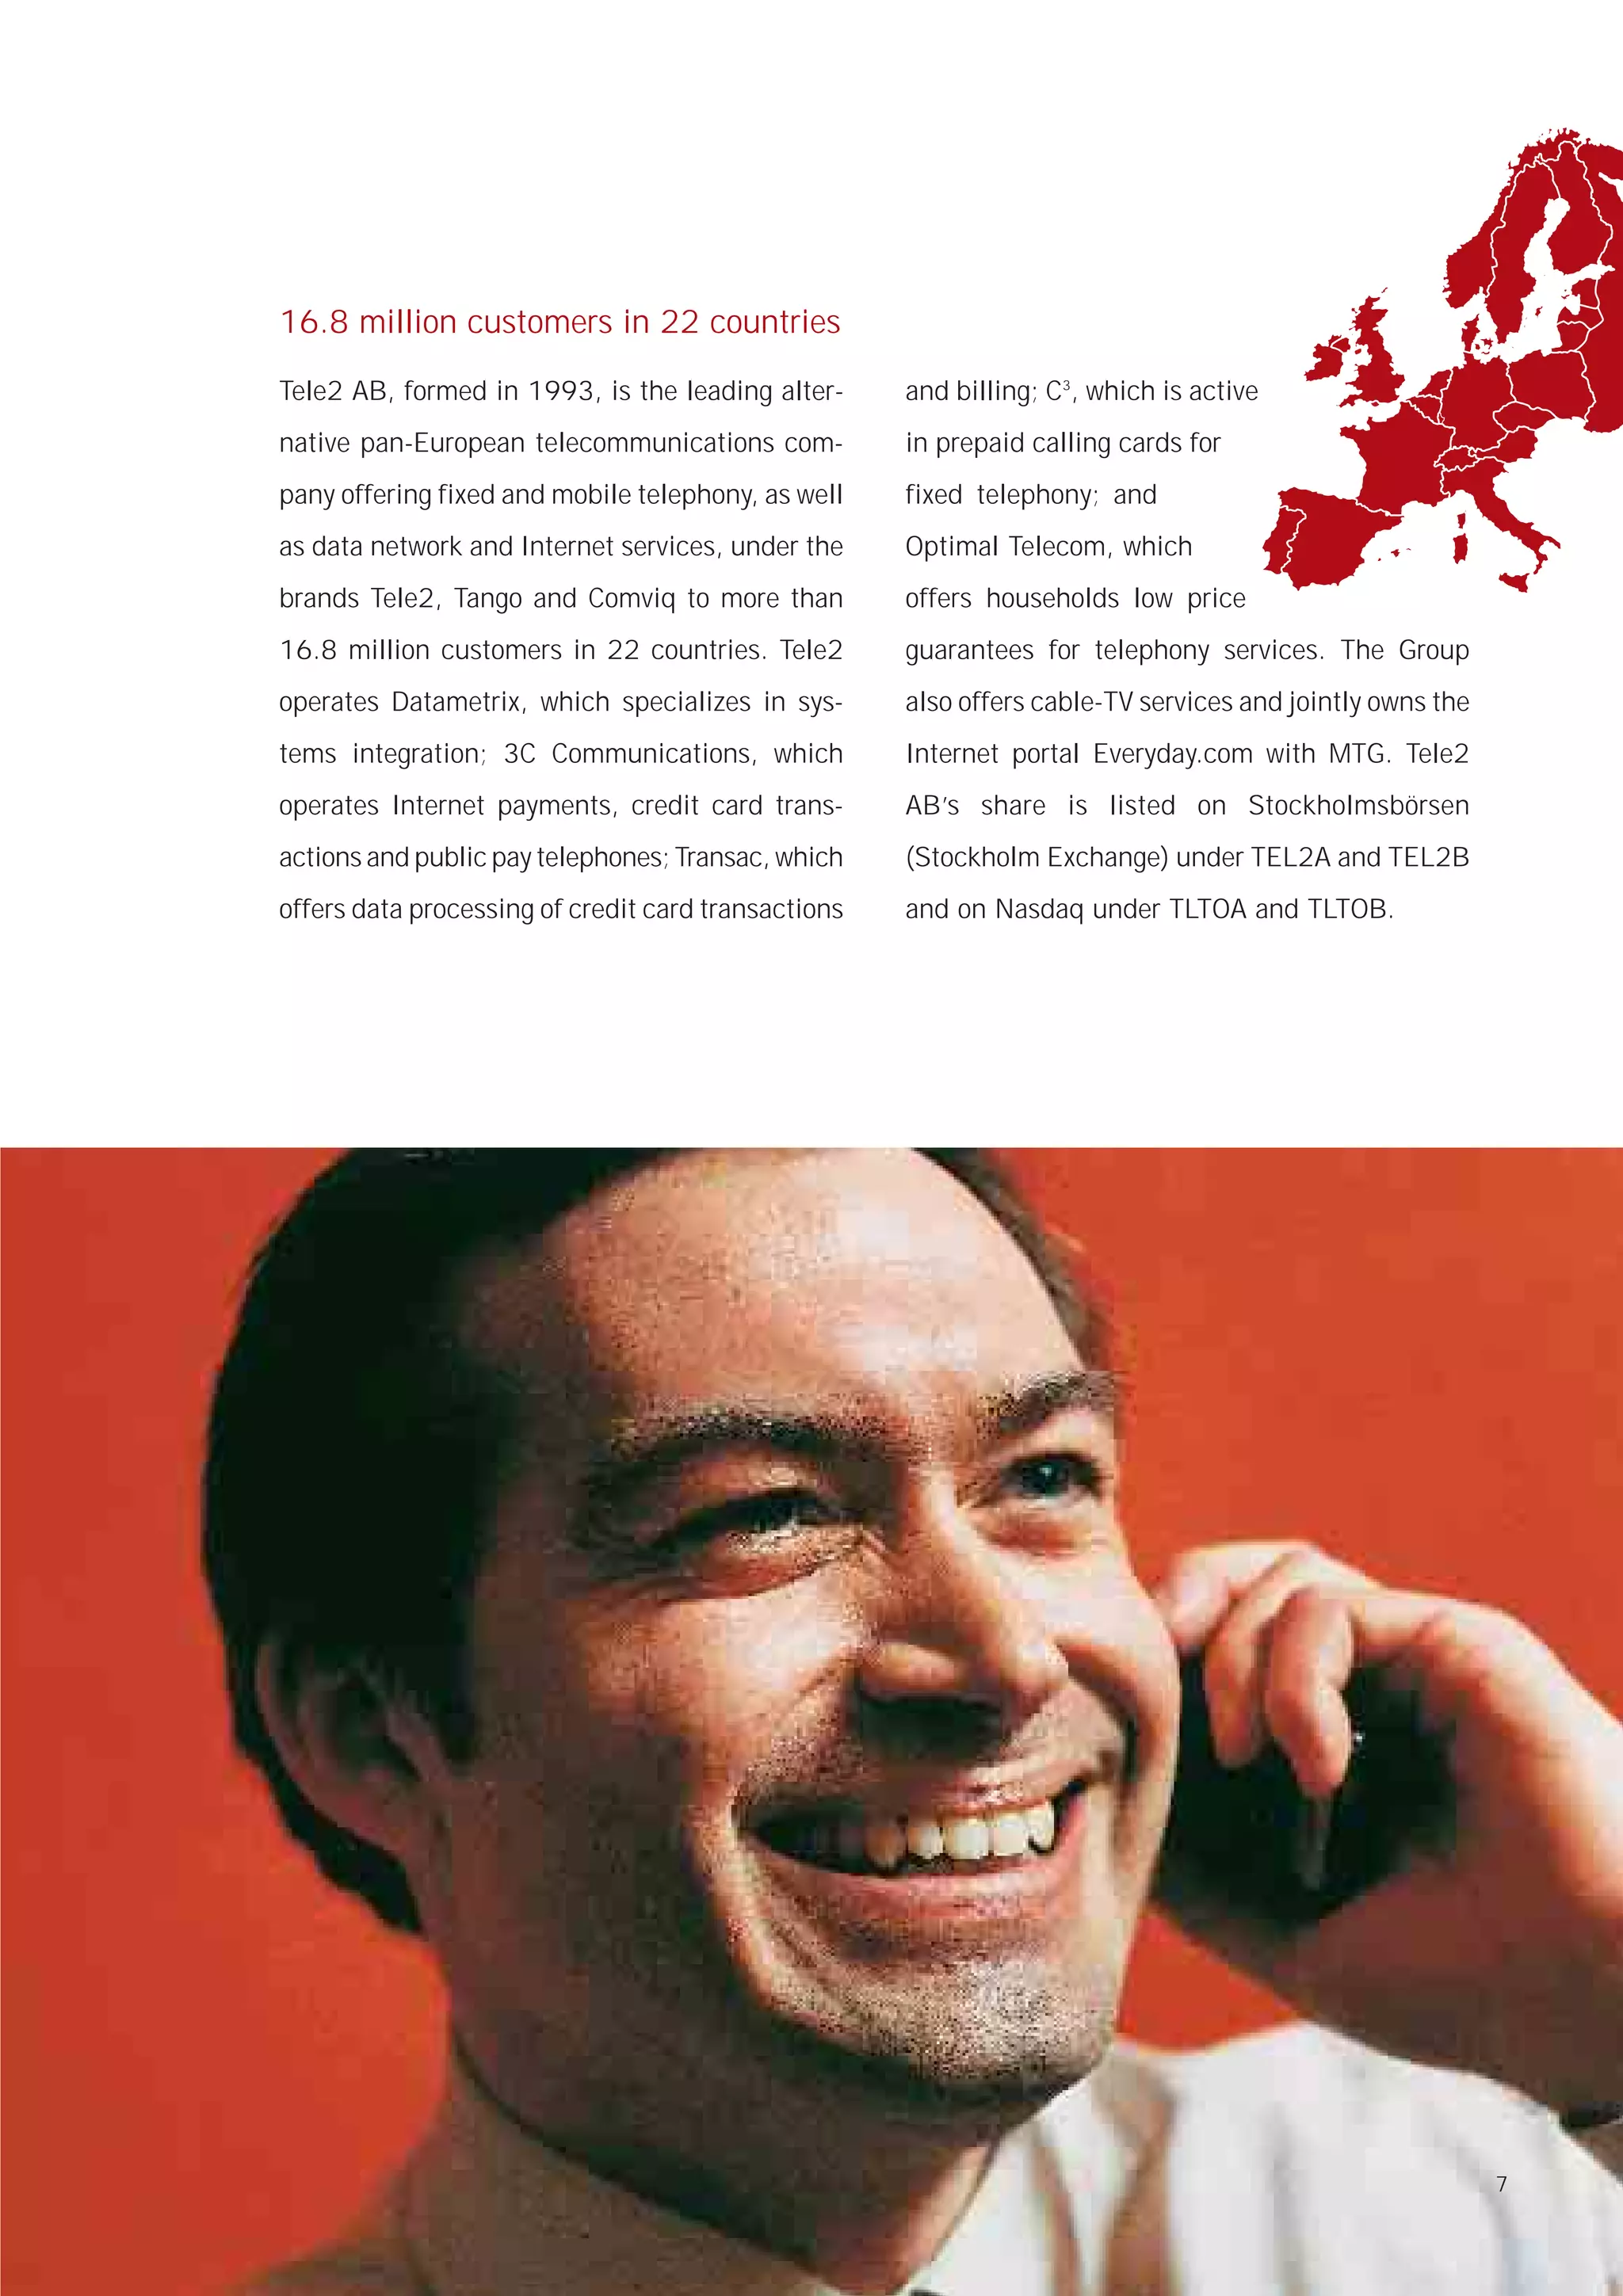
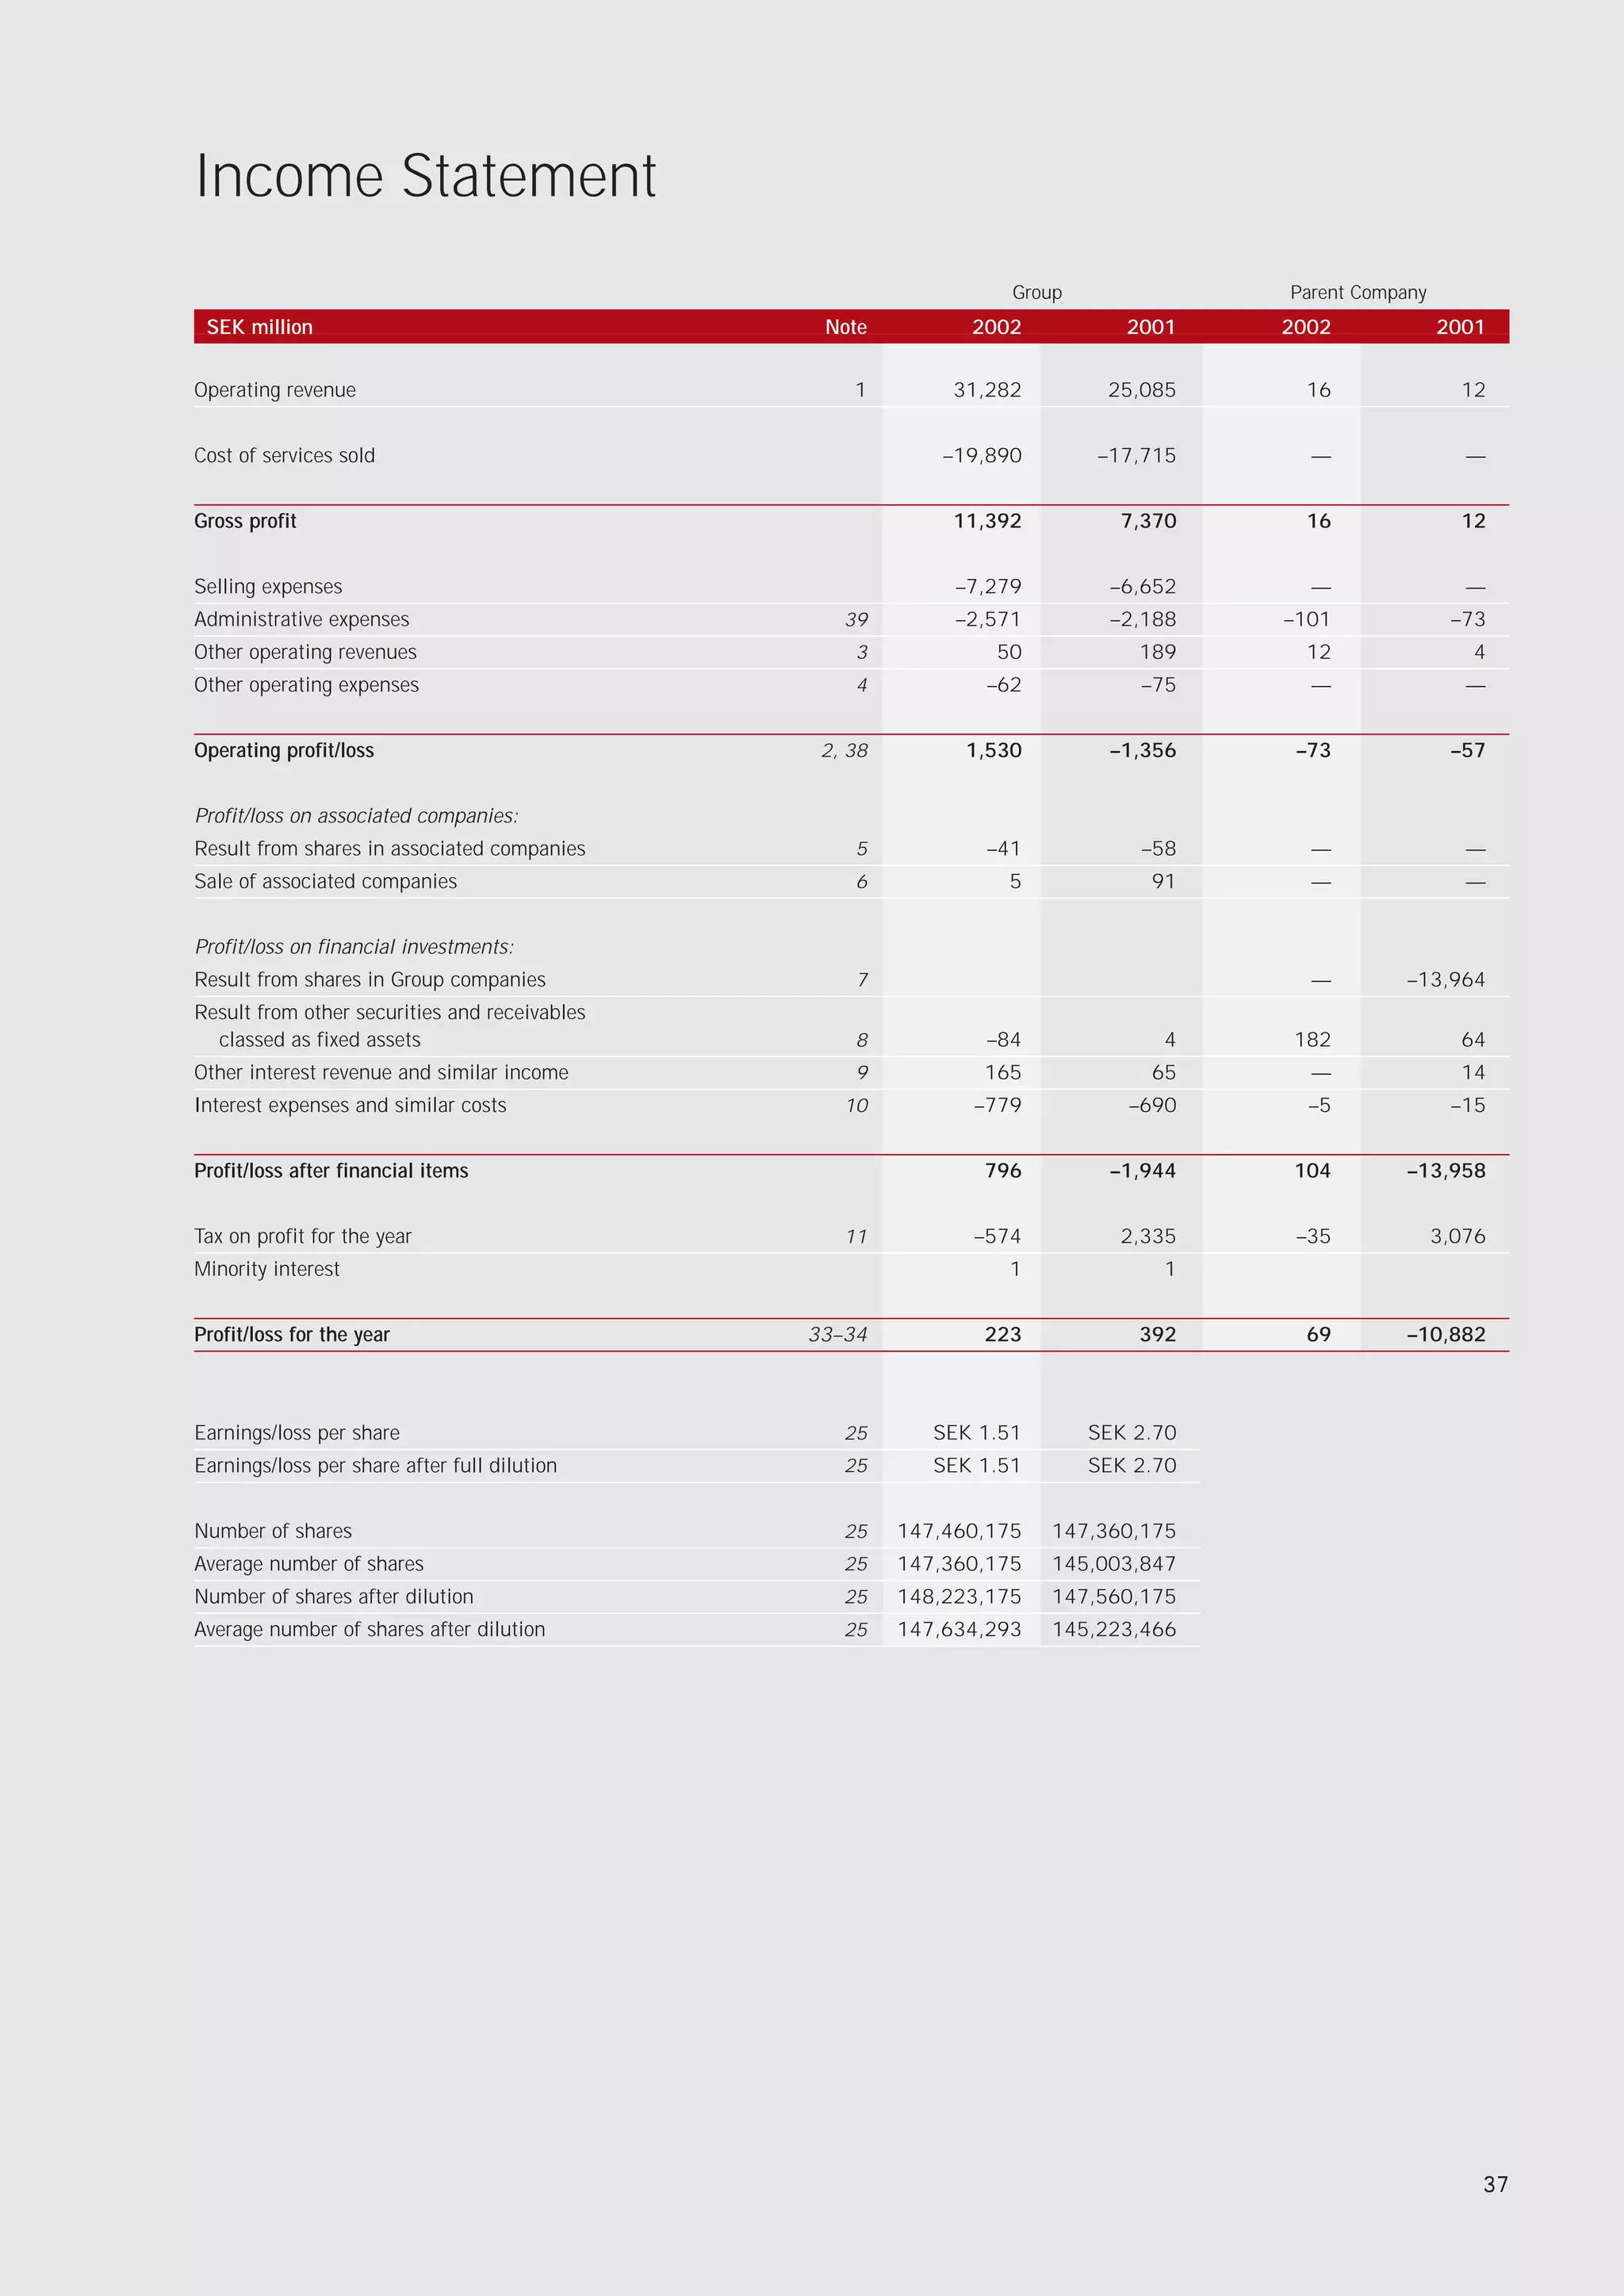
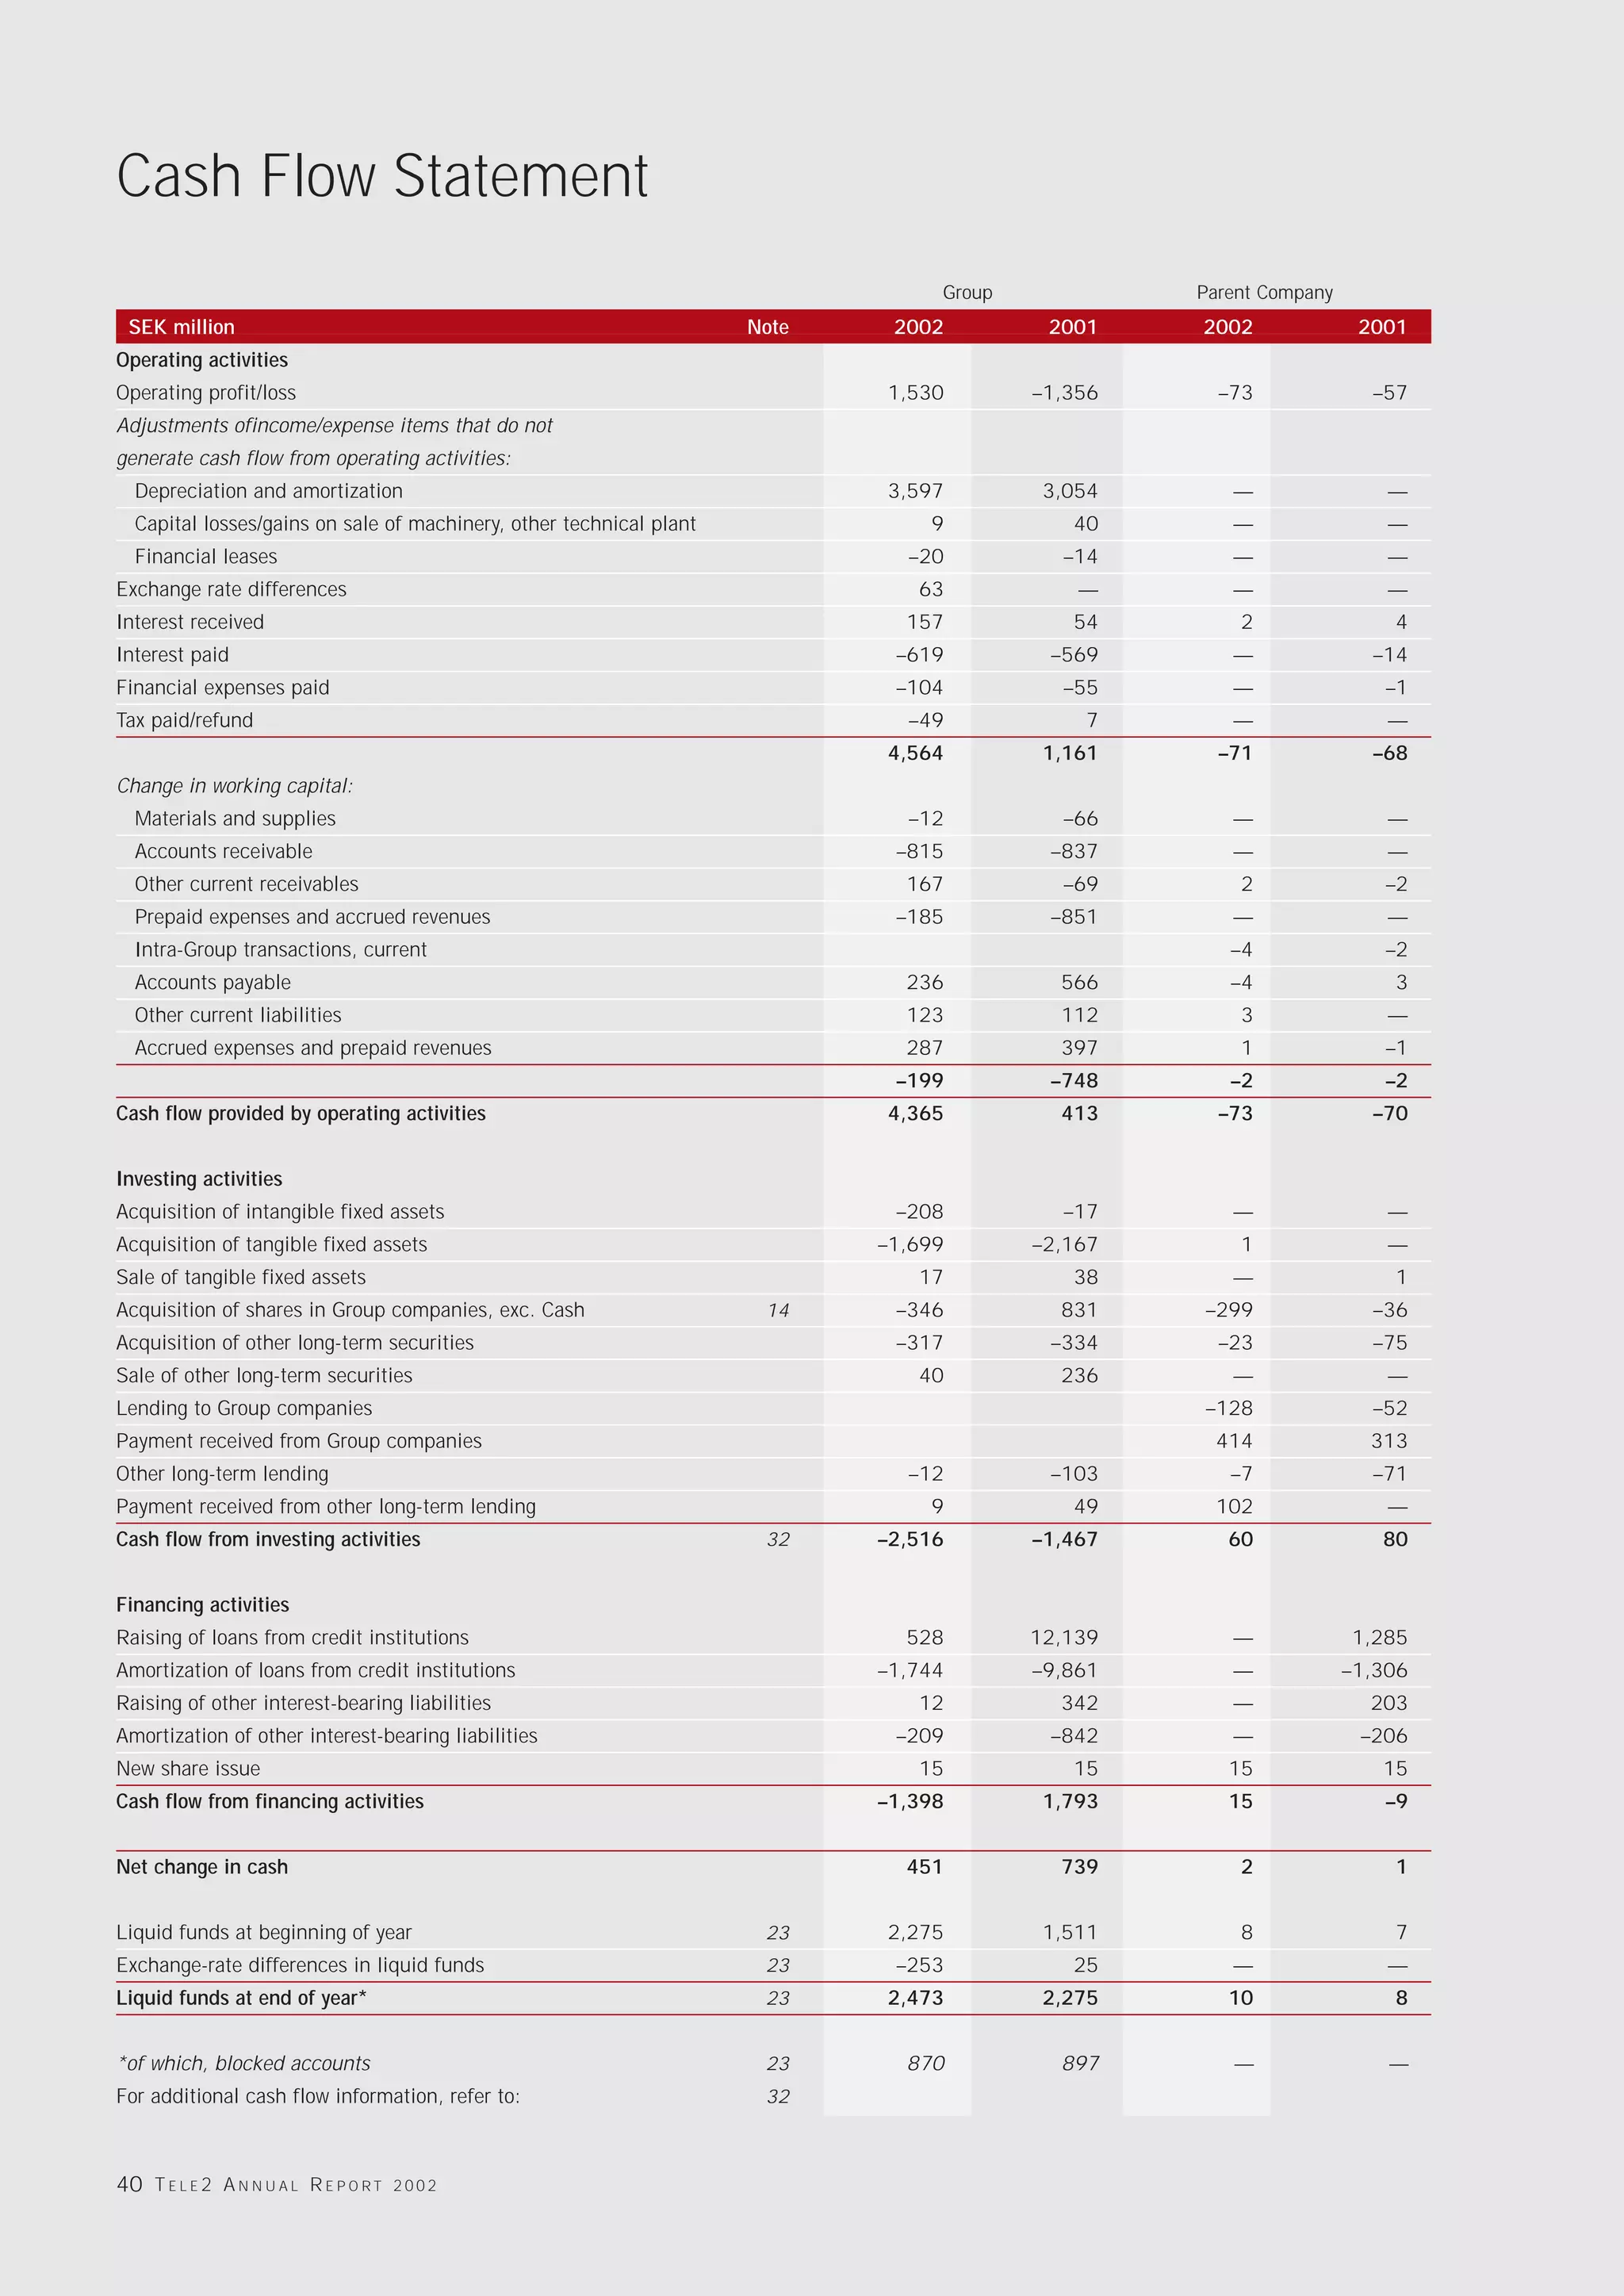
Annual Report 2002
Contents                                                                                                                   A key factor underlying

                                                                                                                           Tele2’s success is that
Significant events ........................................................................ 1
Jan Hugo Stenbeck ................................................................... 2                                    we communicate
Tele2 in brief ..................................................................................... 6                     with our customers
President’s message ............................................................. 10
                                                                                                                           in a way that appeals
Market – continuing growth ......................................... 12
Business concept and business model ........... 14                                                                         to them.
Services and products ........................................................ 17
                                                                                                                           page 10
Nordic ................................................................................................... 20
Eastern Europe and Russia .......................................... 23
Central Europe ............................................................................ 26
Southern Europe ....................................................................... 28
Luxembourg .................................................................................... 30
Branded products & services ...................................... 31
Report of the Directors ...................................................... 32                                          A central market
Income statement ................................................................... 37
                                                                                                                           driving force is that
Balance sheet .............................................................................. 38
Cash-flow statement ............................................................. 40                                       customers are
Change in shareholders’ equity ................................ 41                                                         increasingly seeking
Notes          ....................................................................................................   42
Audit report .................................................................................... 84                       total solutions.
Personnel and environment ......................................... 85                                                     page 12
Board of Directors ................................................................... 86
Senior executives ..................................................................... 87
Tele2 share ...................................................................................... 88
Addresses .......................................................................................... 90
History           ................................................................................................    92
Definitions ....................................................................................... 93

Annual General Meeting                                                                                                     Tele2´s business
The Annual General Meeting will be held at 1:30 pm
on Thursday, May 15, 2003, at Gamla Stans Bryggeri,                                                                        concept is to offer
Tullhus 2 at Skeppsbron in Stockholm.
                                                                                                                           simple, customer-
Shareholders who wish to attend the Annual General
                                                                                                                           friendly services at
Meeting
must be entered in the register of shareholders                                                                            the lowest price.
     maintained by VPC AB (the Securities Register
                                                                                                                           page 14
     Center) for the Annual General Meeting
     (registration must be completed by Monday
     May 5, 2003).
and notify the Company of their intention to attend
     no later than 1:00 pm on Friday, May 9, 2003.

Notification can be made by phone to
+46 33 724 12 67, or in writing to:
Tele2 AB, Box 2094, SE-103 13 Stockholm, Sweden
label the envelope “Annual General Meeting” or by                                                                          The rapid growth in
e-mailing to: bolagsstamma03@tele2.com
                                                                                                                           Southern Europe is
Financial information
Quarterly report, January–March                                                                     April 23
                                                                                                                           driven by the intro-
Annual General Meeting                                                                              May 15                 duction of local pre-
Quarterly report, January–June                                                                     August 5
Quarterly report, January–September                                                              October 21                selection.

                                                                                                                           page 28
Significant events in 2002

• Profit after financial items rose by SEK 2,740 million to SEK 796 million.

• Cash flow after investments increased by SEK 2,903 million to SEK 1,849 million.

• Operating revenue jumped 25%, by SEK 6,197 m to SEK 31,282 m.

• EBITDA advanced to SEK 5,127 m, compared with SEK 1,698 m in 2001.   + 25%
• A positive EBITDA was reported for fixed telephony in Central and Southern Europe,
   SEK 4 million compared with a loss of SEK 1,916 m in 2001.


• 16.8 million customers at year-end, an increase of 12%.


Significant events at the beginning of 2003
                                                                       + 12%
• Tele2 acquires the British company Alpha Telecom.


  Financial summary
  MSEK                                                2002     2001
  Operating revenue                                  31,282   25,085

  Operating profit/loss before depreciation, EBITDA 5,127      1,698

  Operating profit/loss after depreciation, EBIT      1,530   –1,356

  Operating profit/loss after financial items, EBT     796    –1,944

  Profit for the year                                  223      392

  Earnings per share, after dilution                   1.51     2.70

  Average number of employees                         3,115    2,172
Jan Hugo Stenbeck
    1942-2002


2   TELE2 ANNUAL REPORT 2002
Tele2 AB


Dear Shareholder,

Jan Hugo Stenbeck was Chairman of the Board of Directors of Tele2 AB for nine years from
1993 to 2002. He was also Chairman of Industriförvaltnings AB Kinnevik, Invik & Co. AB,
Modern Times Group MTG AB, Millicom International Cellular S.A., Metro International S.A.
and Transcom WorldWide S.A.

Jan passed away on 19 August 2002. He possessed a seldom-rivaled energy, panache, ambi-
tion and sense of fun. His dynamism, curiosity and restlessness, combined with a charm,
determination and healthy fear, drove him to create one of Europe’s most innovative and
successful group of companies. He would not compromise on quality or efficiency and
never ceased to surprise by breaking with convention. His insight – the ability to grasp the
key elements of an issue and articulate his views clearly - was his greatest attribute. Loyalty
was the quality that he valued most in others.

Born in Stockholm in 1942, Jan graduated in Law from Uppsala University in 1968 and
with an MBA from Harvard Business School in 1970. He then joined US investment bank
Morgan Stanley and rose to become a Vice President in the Bank’s Corporate Finance depart-
ment. He became a member of the Board of Directors of Industriförvaltnings AB Kinnevik in
1971 and became Chairman in 1993, taking over at the helm of the Group that his father,
the prominent lawyer Hugo Stenbeck, and the Klingspor and von Horn families had built
into one of Sweden’s largest industrial investment companies. With uncanny foresight, Jan
built a multinational information empire from this industrial foundation and transformed
Kinnevik into a holding company for new telecommunications, media and service businesses
whose brands are now household names not just in his native Sweden but a large number of
markets around the world.

As one of the leading entrepreneurs and visionaries of his generation, he started hundreds of
companies in his lifetime.They ranged from a college sweatshirt business established in
1963 with 10,000 customers and less than US$1 million in annual sales to Europe’s leading
alternative telecommunications provider with over 16.8 million customers and US$3.7 bil-
lion in annual sales. All the businesses share several common features – they all break
monopolies in order to provide people with choice, grow sales aggressively, are highly com-
petitive businesses with low cost structures, and they all aspire to be “best in class”.


                                                                                                  3
Jan Hugo Stenbeck

    From Kinnevik’s roots in the traditional steel and forestry industries, Jan created a group of
    companies that embraced new technologies and encouraged a competitive environment in
    the Nordic region and then internationally. As a pioneer of mobile telephony in the early
    1980s, Jan formed a joint venture with British defense company Racal to acquire the UK’s
    second mobile phone license. Racal-Millicom evolved into the US$122 billion global
    telecommunications giant,Vodafone. Jan also acquired one of the first mobile telephony
    licenses in the United States and this model was repeated around the world. Millicom and
    Tele2 today hold fixed line or mobile telephony licenses in 37 countries – from Estonia
    to Sierra Leone, Bolivia to Russia, and Portugal to Laos – and have more than 20 million sub-
    scribers around the world.

    In similar fashion, Jan introduced the first commercial television channel,TV3, to Scandinavia
    in 1987 by broadcasting commercial television into Scandinavia from London via the Astra
    satellite in Luxembourg.The same approach enabled Sky Television to launch in the UK. TV3
    is now the largest pan-Nordic television channel and the Viasat satellite TV platform broad-
    casts 36 channels to nine countries, which are watched in 45 million homes.

    The most recent project to achieve global scale and reflect the Group ambition is Metro
    International, the free newspaper group. Again challenging local market monopolies and
    established media in cities from Boston to Barcelona, Stockholm to Santiago, and Holland
    to Hong Kong, Metro now reaches over 12 million readers and is the world’s largest news-
    paper outside Japan.The company’s advertising revenues have grown at a compound annual
    rate of 47% since the launch of the first edition in Stockholm in 1995.

    All of these companies continue to shape and adapt successfully to new developments as third
    generation mobile telephony and digital multi-channel television become realities, and as
    exciting new markets in Eastern Europe and Asia offer significant new opportunities.

    Kinnevik has generated a compound annual average rate of return since 1976 of 13%, with
    the result that one dollar invested in Kinnevik in 1976 would be worth over US$25 today.
    The Stenbeck Group of publicly listed companies had a combined market capitalization of
    US$6 billion in February 2003 and employed more than 25,000 people in more than 50
    countries around the world.

    In typical style, the Stenbeck group of companies, combined established tradition with ground
    breaking originality by welcoming in the new millennium with a spectacular fireworks and
    multi-media display in Stockholm’s Old Town on New Year’s eve.The scale and complexity of
    this event not only mesmerized the record breaking crowd of 700,000 people and won its


4   TELE2 ANNUAL REPORT 2002
Jan Hugo Stenbeck

place in the Guinness Book of World Records, but also offered a unique showcase for group
brands such as Comviq,TV3 and Metro.The event perfectly illustrated Jan’s unusual combin-
ation of creative flair and intricate planning.

On the day after he passed away and only a few months before his 60th birthday, one of Jan’s
greatest dreams was realized when the second Victory Challenge yacht was launched
in Auckland, New Zealand. From the time that he had acquired the former committee boat
of the New York Yacht Club, Jan had nurtured a dream to compete for one of the sporting
world’s oldest and most coveted trophies – The America’s Cup.The Victory Challenge syndi-
cate brought together leading match race sailors from the Nordic countries in the
first challenge by a Nordic crew for twelve years.

The challenge exemplified Jan’s approach, as he acquired one of the yachts used by Team
New Zealand to win the Cup in 2000, then recruited and motivated world class boat design-
ers, builders, and sailors, forged a team, and pushed each member to the limits of their
potential, whilst maintaining a strict control on cost.This was an environment in which he
thrived – high adrenaline competition, pitting the Nordic team against the world’s best.
Every detail counted as seconds decided between success and failure. Victory Challenge won
eleven races, including two victories over the New York Yacht Club, reaching the quarterfinals
of the Louis Vuitton Cup and becoming the most successful Nordic entry ever.The Challenge
generated unparalleled media airtime for its group sponsors, including live television cover-
age in Sweden, Norway, Denmark, Switzerland, France, Italy, the United Kingdom, the United
States and Canada.

Despite, and perhaps because, of all the achievements above, Jan remained a very private and
modest man. “Tell them that I am only a Basett hound breeder” he would reply to the end-
less requests for interviews. As Jan always said, “if you can’t choose, you shouldn’t com-
plain”. He led a unique life and is greatly missed. His legacy is an opportunity to build on
his success and your Board is firmly committed to fulfilling this responsibility. On behalf
of the shareholders, customers, employees and business partners, the Board of Directors
wishes to express its gratitude for the enormous contribution of Jan Hugo Stenbeck to the
development of Tele2 and the other companies, which he founded and in which he engaged.


                              Stockholm, 27th February 2003
                                         Tele2 AB
                                  The Board of Directors


                                                                                                 5
Tele2 in brief

                               Mobile telephony                                            Fixed telephony and Internet

                               Nordic:            Sweden, Norway, Denmark.                 Nordic:            Sweden, Norway, Denmark, Finland.
    Geographic markets:


                               Eastern Europe                                              Eastern Europe
                               and Russia:        Estonia, Latvia, Lithuania, Russia.      and Russia:        Estonia, Poland, Czech Republic.

                               Central Europe:    Switzerland, the Netherlands, Austria.   Central Europe:    Germany, the Netherlands, Switzerland,
                                                                                                              Austria, UK.

                               Southern Europe: —                                          Southern Europe: France, Italy, Spain, Portugal.

                               Luxembourg:        Liechtenstein, Luxembourg.               Luxembourg:        Liechtenstein, Luxembourg, Belgium.


                               12                         countries                        19                        countries
    Percentage of net sales:


                               30 % 68%
    Number of customers:


                               Nordic:                     3 221 000                       Nordic:                    2 822 000

                               Eastern Europe and Russia: 1 366 000                        Eastern Europe and Russia: 144 000

                               Central Europe:             271 000                         Central Europe:            3 316 000

                               Southern Europe:            —                               Southern Europe:           5 129 000

                               Luxembourg:                 181 000                         Luxembourg:                41 000


6   TELE2 ANNUAL REPORT 2002
                               5.0 11.4                              million                                                      million
16.8 million customers in 22 countries

Tele2 AB, formed in 1993, is the leading alter-      and billing; C3, which is active
native pan-European telecommunications com-          in prepaid calling cards for
pany offering fixed and mobile telephony, as well    fixed telephony; and
as data network and Internet services, under the     Optimal Telecom, which
brands Tele2, Tango and Comviq to more than          offers households low price
16.8 million customers in 22 countries. Tele2        guarantees for telephony services. The Group
operates Datametrix, which specializes in sys-       also offers cable-TV services and jointly owns the
tems integration; 3C Communications, which           Internet portal Everyday.com with MTG. Tele2
operates Internet payments, credit card trans-       AB’s share is listed on Stockholmsbörsen
actions and public pay telephones; Transac, which    (Stockholm Exchange) under TEL2A and TEL2B
offers data processing of credit card transactions   and on Nasdaq under TLTOA and TLTOB.


                                                                                                          7
MVNO                                                      iHear
    MVNO (Mobile Virtual Network Operator) is a concept       iHear is a cordless digital

    that makes it possible for Tele2 to offer its customers   telephone equipped with

    mobile telephony without needing to invest in its own     a calling-router.

    mobile network. Tele2 buys the right to handle incom-

    ing and outgoing mobile traffic. As an MVNO, Tele2

    has its own SIM cards, bills its customers directly and

    develops its own services. As a result, customers gain

    access to Tele2’s services and lower rates. MVNO

    offers major growth potential for Tele2 in countries in

    which it has a large customer base in fixed telephony,

    but lacks its own infrastructure.


    Transcom                                                  Flexible solutions
    Transcom is a pan-European partner that handles           Tele2’s corporate culture is marked by flexibility and

    Tele2’s customer relations. Transcom serves as Tele2’s    adaptability in reacting to changes in customer

    customer service and handles all of Tele2’s ongoing       requirements and other market conditions – while

    customers matters.                                        focusing constantly on customer demand for attrac-

                                                              tive services and the lowest price.


8   TELE2 ANNUAL REPORT 2002
Anders Igel                      , President of TeliaSonera   Victory Challenge
“I think Tele2 is good at marketing, adopts a com-            Tele2 sponsored Victory Challenge – the Swedish

mercial approach and has an ability to get things done.       challenger for the America´s Cup in 2003. Victory

We’ve got a good deal to learn from them.”                    Challenge went all the way to the quarterfinals outside

                                                              Auckland in New Zealand. Tele2 is currently active in
Affärsvärlden, No. 3, 2003
                                                              22 countries and the exposure provided by the sailing

                                                              contests was a very effective way of strengthening the

                                                              brand among existing and new customers.


Network Management                                            GSM licenses
                                                              in Russia
To provide 100% availability in the networks, they are

monitored 24 hours a day, 365 days a year. This               Tele2 now has GSM licenses in all eleven of its oper-

ensures that our customers can communicate with as            ations in Russia. Preparations for the GSM network

few interruptions as possible.                                build-out are well advanced and general agreements

                                                              for delivery of GSM infrastructure have been reached

                                                              with suppliers.

                                                                                                                        9
Tele2 is a unique company

Tele2 is the only telecom company that has       more than SEK 2.3 billion. Another key            Our fixed network companies are also
a pan-European market in fixed network           benchmark of our solid financial base is       becoming mobile companies in pace with
telephony. As the leading alternative tele-      that net debt fell by SEK 1.6 billion dur-     deregulation. We’re focusing on the MVNO
com company in Europe, we can state with         ing the year and now amounts to SEK 7.7        concept, which means that we buy rights
satisfaction that our subsidiaries in country    billion.                                       to handle incoming and outgoing mobile
after country report positive operating profit      This is a solid platform for continuing     traffic from an established mobile opera-
before depreciation about three years after      operations.                                    tor. As an MVNO, we issue our own SIM
start-up.                                           The question posed for most telecom         cards, invoice customers directly and
   The image of Tele2 as primarily a Swedish     companies today is: “Are there sufficient      develop proprietary services. For the cus-
or Nordic company is increasingly inaccur-       funds?” The question I’m faced with is a       tomer, the difference between a subscrip-
ate. Each of our subsidiaries in France,         totally different one: “What will we do with   tion with Tele2 as the MVNO or having a
Italy and the Netherlands have more fixed        our funds?” The answer is easy to give:        subscription with the operator who owns
network customers than Tele2 in Sweden.             We will continue to be a growth compa-      the infrastructure is merely Tele2’s lower
   Tele2 is a unique telecom company             ny and win market share in markets in          rates and services. Being a Service Partner
since we are not burdened by major invest-       which we are present. The exciting feature     (SP) is less attractive for Tele2, since this
ments requiring write-offs. Tele2 reported       is that we can personally set the pace with-   does not permit the same type of customer
a positive bottom line in 2002 despite           out viewing financial resources as a bottle-   contact.
write-offs for our 3G venture in Norway.         neck.                                             Our efforts to develop fixed network cus-
Tele2’s profit before and after deprecia-           Over a number of years I’ve stated that     tomers and transform them into mobile
tion/amortization shows a much smaller           we’ve got our fingers in the cookie jar. By    customers is an expression of our cross-
difference than other telecom companies.         that I mean we are as close as possible to     selling strategy. Our large customer base is
   Focusing on markets and customers             our customers. We can see clearly how this     being offered an increasing number of ser-
instead of on costly investments in tech-        approach works in Estonia, Latvia and          vices, which means lower costs for one
nology was the basic philosophy of Tele2’s       Lithuania, countries in which we are high-     “new” customer.
founder Jan Stenbeck from the very begin-        ly successful. I’m convinced that these           Through MVNO´s, Tele2 is now trans-
ning. Jan Stenbeck’s passing away in             positive lessons can act as an excellent       forming part of its large stock of fixed net-
August 2002 was of course a profound loss        guide as we increase the pace in our           work customers in country after country
for Tele2, but the founder’s basic ideas         Russian operations.                            into Tele2 mobile customers. Mobile cus-
remain intact. Tele2 is now working active-         Tele2 started its operations in Sweden.     tomers accounted for the largest percent-
ly to develop these basic concepts through-      Operations there are wide-ranging and          age of the increase in customers in 2002.
out Europe.                                      highly important. This applies not least to    Tele2 returned its Norwegian UMTS
   Tele2 now has a solid financial base.         Comviq, which celebrated its tenth anni-       license during the year, opting instead to
The fact that the company began to report        versary in 2002, and reported 3 million        sign an MVNO deal with Telenor.
a profit in 2002 is, of course, significant,     mobile customers. Two million of these are        European telecom deregulation is far
but perhaps what is even more impressive         prepaid customers. Comviq’s mobile tele-       from complete, but the EU and the various
is that cash flow during the year was boost-     phony is based on our core values. Our aim     national supervisory authorities are now
ed by almost SEK 3 billion after invest-         is always to give customers minimum            worried by the threat that has emerged in
ments. The company’s disposable liquid           rates, while simultaneously developing         a number of countries, namely, that mar-
funds, including unutilized overdraft facil-     concepts and services.                         ket newcomers are disappearing so that
ities, amounted at year-end to slightly                                                         only the former monopolies remain. Since


“Tele2 is the world’s fourth fastest growing telecom/IT company…”
Business Week, June 19, 2002


10 T E L E 2 A N N U A L R E P O R T   2002
“Tele2 is the only
                                                                                               telecom company
                                                                                               with a pan-European
                                                                                               market in fixed
                                                                                               telephony.”


Tele2 is one of the few profitable European     point remains the same as in the past. We      Communication is fun, and fun shouldn’t
telecom operators, our operations attract       gain a major advantage from expanding our      cost too much.
substantial positive interest from the EU       3G network in Sweden in cooperation with         By rolling out Tele2’s concept across
and national regulatory authorities. As the     Telia. Our 3G operations will most likely be   Europe and taking our experience with us
sole alternative pan-European telecom           profitable earlier than in any other           from previously deregulated markets, we
operator, we are currently one of the few       European country. Our plan to commence         are gaining a profitable customer base in
examples of the positive effects of dereg-      commercial 3G operations at the end of         country after country.
ulation for companies and consumers.            2003 remains in place. But for consumers,        But there’s no shortage of challenges.
   Competition must continue in order to        voice communications, SMS and MMS will         My colleagues and I continue to focus on
ensure consumer value. This means that          remain the most important features.            offering additional services to our enor-
the supervisory authorities have an interest    Subsequently, long-term 3G factors will        mous customer base. This is a guarantee
in maintaining competition. I definitely        impact positively on earnings. But also in     for continued growth and increased prof-
feel that this represents a significant guar-   this case I believe that our close-to-the-     itability in the sprit of a small company.
antee against national protection of the        customer work approach will offer advan-
former monopolies regaining the upper           tages. Our dialogue with customers is filled   Stockholm, February 2003
hand. But there are definitely countries in     with respect and interest in the customer’s
which one would wish for greater pressure       requirements. Not least, we are following
for change. This applies primarily to           with great interest the use of mobile tele-
Germany, but even in France this would be       phony among young women, whom to date          Lars-Johan Jarnheimer
very desirable.                                 have been major trendsetters in this area.
   UMTS (3G) continues to be a topical            A key factor underlying Tele2’s success
subject. I never expected rapid 3G devel-       is that we communicate with our cus-
opment and therefore my message on this         tomers in a way that appeals to them.


                                                                                                                                        11
Market – continuing growth

The European telecom market is charac-        Continuing growth                              and market conditions permit. Tele2 has a
terized by stiff competition, acquisitions    At the same time as competition is stiff-      history of offering customers attractive
and mergers – but also by continuing          ening, the telecom market continues to         products at competitive prices.
growth in demand.                             expand. For example, the total market for
     Following deregulation in the EU,        fixed telephony, mobile telecom services       Varying progress in deregulation
numerous new players established a pres-      and Internet access in Sweden rose 7%          EU telecom markets were deregulated to
ence in the market, at the same time as       during the first six months of 2002, com-      stimulate greater competition. The intro-
the former monopolies expanded into new       pared with the same period a year earlier.     duction of new legislation designed to lead
geographic markets.                             A central driving force in the market is     to increased competition has, however,
     Following a wave of investments in 3G    that customers are increasingly seeking        progressed differently in various countries.
licenses, data networks and other applica-    total telecom solutions. Tele2 has access      Germany, for example, has fallen behind
tions, many companies have abandoned          to services and expertise in mobile teleph-    other countries as regards local carrier pre-
the market, either as result of acquisition   ony, fixed telephony, Internet, data net-      selection. In those countries in which local
or bankruptcy. One feature of the com-        works, cable-TV and broadband and is           pre-selection is made available for players
panies that were pushed out is that they      working continually to transfer know-how       other than the former monopolies, such as
lacked financial strength and/or a feasible   among the various areas and countries to       France and Italy, Tele2 has gained consid-
business model. This trend has created        strengthen its customer offering. Tele2 has    erable successes.
opportunities for Tele2 to acquire cus-       had major success in cross selling new            Also, the EU Commission believes there
tomers from these companies.                  products to its existing customer base.        is no effective competition in, for example,
                                                In markets in which Tele2 is relatively      broadband services via access networks,
                                              recently established, the strategy is to add   meaning copper wire that connects switch-
                                              new services and products as deregulation      es with end customers. The pricing applied


12
by the former monopolies discriminates         leases an existing network and thus avoids        with Telenor. Tele2 is already active as an
against newcomers.                             building a new mobile network.                    MVNO in Denmark and the Netherlands,
   Also, interconnect traffic charges are an      The difference between MVNO and SP             and during 2002, an MVNO agreement
area in which improvements are required.       is a fundamental one. In the latter case,         was signed with Connect Austria in Austria,
The interconnect traffic charge is the fee     the operator becomes a vendor of another          where service was launched in February
paid by a telecom operator to enter the        company’s telephony, since it only handles        2003.
access network. Interconnect traffic           outgoing traffic. MVNO means simply that
charges are one of the largest expense         a mobile operator purchases radio access          UMTS – third generation mobile telephony
items for Tele2. Consequently, lower inter-    from an existing mobile operator, but is          Tele2 holds UMTS licenses for third gen-
connect traffic charges provide highly pos-    otherwise completely independent and can          eration telephony in Sweden, Finland
itive effects.                                 develop services, payment forms and               (through joint ownership of Suomen
   The pricing originates from the former      direct traffic accordingly as if it were a con-   Kolmegee Oy), Liechtenstein, Luxembourg
monopoly’s attempts to retain control of       ventional mobile operator. The only differ-       and Latvia.
the access network. It is only when these      ence between a conventional operator and            In an effort to keep down costs of con-
– and thus subscriptions – are exposed to      a real MVNO is that the MVNO has no con-          struction and operation of the UMTS net-
competition that deregulation of the mar-      trol of coverage build-out. For the cus-          work in Sweden, Tele2 and Telia have
ket will have a full impact.                   tomer, there is no difference between hav-        established a jointly owned company,
                                               ing a subscription with a conventional            Svenska UMTS-nät AB. Costs are curtailed
MVNO offers new growth opportunities           operator or having one with an MVNO.              through the use of both companies’ exist-
In cases in which deregulation is effective,      The model opens major growth oppor-            ing infrastructure, such as telecom masts.
new markets are opened up to new forms         tunities for a company like Tele2, which            Tele2 has a strong brand, large cus-
of service suppliers. Both Mobile Virtual      has a large customer base in many coun-           tomer base, service development close to
Network Operators (MVNO) and Service           tries but which does not have its own infra-      customers, an efficient organization and
Providers (SP) have emerged as new busi-       structure. During the year, Tele2 returned        comprehensive technical know-how – fac-
ness models that add to competition in the     its UMTS license in Norway and instead            tors that suggest success in the market for
mobile market. In both cases, the operator     elected to conclude an MVNO agreement             3G-based services.


                                                                                                                                         13
Business concept

Based on customers’ needs, Tele2 shall through
simple, customer-friendly sevices and the lowest
price have the most satisfied customers in the
market.


This is Tele2                                                                        Values

Tele2, formed in 1993, is the leading alternative                                    Tele2’s corporate culture rests on three
pan-European telecommunications company and                                          fundamental values:
is active in GSM, public telecommunications and
                                                                                     • flexibility
data networks, as well as Internet and cable-TV
                                                                                     • informality
services.
                                                                                     • cost-consciousness


Tele2’s organization

                                                               Tele2 AB
                                                      Lars-Johan Jarnheimer, CEO
                                                           Håkan Zadler, CFO


         Nordic                  Eastern Europe   Central Europe      Southern Europe           Luxembourg     Branded products
                                   and Russia       Germany                France                                  & services
       Sweden                                                                                  Luxembourg
       Norway                        Estonia       Netherlands              Italy              Liechtenstein          C3
      Denmark                         Latvia       Switzerland             Spain                  Belgium       United Kingdom
       Finland                      Lithuania        Austria              Portugal                  3C             Everyday
   Optimal Telecom                   Poland          Ireland                                      Transac
     Datametrix                  Czech Republic
                                     Russia
                                    X-source


14 T E L E 2 A N N U A L R E P O R T   2002
Strength factors:                                                            Strategies

• profitability                                                              The company’s strategy is reflected in:

• low rates                                                                  • Being the price-leading operator in all markets
                                                                                in which the Group is present.
• large customer base
                                                                             • Price-leadership and the role of challenger to the
• industry-leading efficiency
                                                                                former monopolies have been decisive factors in
• well-known brands
                                                                                successfully securing new customers and thus
• flexibility                                                                   Tele2’s growth.

• prompt adjustment to new customer                                          • When expanding into new markets, the aim is
   requirements and market conditions                                           to rapidly build up a customer base that can

• committed and skilled employees                                               subsequently be cross sold services in pace
                                                                                with market maturity and deregulation to offer
                                                                                more people the opportunity to communicate
                                                                                less expensively through Tele2.


Business model

In existing markets in continental Europe,     when it is not necessary. In countries in      Baltic states are extremely important for
future growth is expected to derive largely    which Tele2 owns infrastructure, it would      expansion in Russia. Know-how and experi-
from the cross-selling of services and         not have been possible to compete with the     ence from the Baltic market can be used
products to the existing customer base. In     former monopoly without access to propri-      to gain efficient growth in Russia.
less mature markets, the penetration rate      etary infrastructure.
remains relatively low, permitting rapid         The objective in each country is to reach    Rapid growth
growth when an increasing number of            a positive operating income before depre-      In 2002, Tele2 was the fastest growing
people demand attractive communications        ciation/amortization within three years        telecom operator in Europe, thereby con-
services. Tele2 is also monitoring countries   from the start of operations. Tele2 has        firming the functional nature of its busi-
bordering on current market areas.             achieved this in all markets except            ness model.
  Tele2 consistently attempts to transfer      Germany, where deregulation has lagged
know-how among its various product areas       behind the rest of Europe.                     Quality
and countries. Customer offerings and suc-       In Southern Europe, with France and          Tele2 has a quality policy that serves as a
cessful concepts create synergies since        Italy as the largest markets, Tele2 has        guide for all operations in the Group. One
they can be more used effectively in sev-      established itself as a strong brand and has   of the most important means of attaining
eral markets, creating conditions for high-    had great success in fixed telephony.          the Group’s target is high quality in every-
er profitability through economies of scale      Operations in the Baltic States have         thing it does. Tele2’s commitments,
and better resource utilization.               largely emulated Nordic activities with        actions and products will be perceived as
  Cost-consciousness also entails not          great success – the area is one of the most    an expression of quality. The foundation
contracting and owning infrastructure          rapidly growing in mobile telephony. The       comprises the Group’s values and accu-


                                                                                                                                       15
Business model cont.


mulated expertise. Constant improvement                     The rapid addition of new customers in       with an expected introduction in Germany
is the work motto.                                       the Baltic States is driven by mobile tele-     during 2003, revenues in Central Europe
   The experience of a product or service                phony and particularly the prepaid card. In     will grow in 2003 without triggering any
must always meet the customer’s expect-                  Latvia, Tele2 acquired one of two UTMS          rise in costs. As an MVNO, new possibili-
ations. The customer is the center of atten-             licenses. In January 2003, the market           ties for growth are created. Tele2 has an
tion and the key quality benchmark is cus-               opened for fixed telephony and Tele2            MVNO agreement with Telenor in Norway,
tomer satisfaction. Customer surveys are                 expects to introduce services during the        with launch planned for the first quarter of
conducted regularly in an effort to improve              first half of the year. Tele2 launched fixed    2003. During 2002, Tele2 rolled out an
results consistently. Customers must                     telephony in Poland during the first quarter    MVNO in the Netherlands and signed an
always feel confidence in Tele2 as a sup-                of 2003 and plans to introduce local pre-       MVNO agreement with Connect Austria in
plier.                                                   selection in the Czech Republic during the      Austria.
                                                         year.                                             In February 2003, Tele2 acquired Alpha
Opportunities in 2003                                       In Continental Europe, fixed telephony       Telecom, the leading prepaid fixed tele-
During 2002, Tele2 grew faster than its                  operations continued to post strong growth      phony operator in the UK for private indi-
competitors, generated the best cash flow                in 2002 and at year-end had 8.5 million         viduals and the market leader in prepaid
and       improved         earnings           sharply.   customers. Central Europe and Southern          cards for fixed telephony. Alpha will ben-
Maintaining the balance between cus-                     Europe combined reached breakeven at            efit from Tele2’s strong market position
tomer growth, profitability and cash flow                the     EBITDA   level   during   the   year.   and will be able to expand to Tele2’s mar-
continues to be the priority in 2003.                    Introduction of local pre-selection in          kets in Europe.
   Tele2’s mobile operations are “Best in                Southern Europe fueled Tele2’s very rapid
Class” with very favorable margins in                    development in the market area. Fixed
Sweden. Tele2 has more than 3 million                    telephony was launched in Portugal in
mobile customers in Sweden. Profitability                2003.
in the Swedish fixed telephony operations                   With local pre-selection available in the
continues to be good.                                    Netherlands since August 1, 2002, and


                                                     Good positioning
                                                    Tele2 always aims to improve


16 T E L E 2 A N N U A L R E P O R T   2002
Products and services

Tele2 offers fixed telephony, mobile telephony, Internet services, and data network services,

cable-TV and content services in 22 countries in Europe.

    Tele2’s product strategy is to have a joint product portfolio with fixed telephony as a base and

add dial-up Internet services, mobile telephony and broadband when the market in each country

is sufficiently mature. This strategy permits Tele2 to deliver and continually improve products that

satisfy customer demands for low-cost, high-quality communications services.


Fixed telephony                                Prepaid telephony
                                               Prepaid fixed telephony means that the
                                               customer pays his/her own “call account”
                                               which they then use when calling via the
Carrier Pre-select                             fixed telecom network. For Tele2, the
Pre-selection means that customers can         service means fewer unpaid receivables,
select to use Tele2’s lower prices for their   lower customer churn and reduced invoicing
fixed telephony. They no longer need to dial   costs, and at the same time, it is positive
a prefix. Local pre-selection means that       for cash flow.
Tele2 also takes charge of local calls via       Tele2 has had considerable success
pre-selection.                                 with prepaid fixed telephony in France,
  Following deregulation in France, Italy      Italy, Spain and Finland.
and the Netherlands – Tele2 began to offer
                                               iHear                                          stores and news stands. C3 works closely
customers cheaper call rates using Tele2
                                               iHear is a cordless telephone equipped         with Tele2, which provides the network
via pre-selection. Tele2 continues to work
                                               with a calling-router that always connects     capacity.
with the authorities in countries in which
pre-selection and local pre-selection have     the call via Tele2, and thus provides access
not yet been deregulated.                      to the company’s attractive rates. In recent   Telephone booths, Internet
  The access network, meaning the cop-         years, Tele2 has used the iHear telephone      terminals and WLAN Hot Spots
                                               successfully to increase customer satis-       Via 3C Communications, Tele2 operates
per wire connecting households with the
                                               faction, customer loyalty and call volumes.    credit card-based telephone kiosks and
telecom network, is still not open to com-
                                               The telephone is particularly effective in     Internet terminals in hotels, restaurants
petition but is instead handled almost ex-
                                               countries where pre-selection is not avail-    and    other    well-frequented   locations
clusively by Europe’s former telecom mon-
                                               able. Tele2 launched the latest Dect 3         throughout Europe. The kiosks and termin-
opolies. As a result, customers who have
                                               model of iHear in 2002.                        als are an excellent base for adding WLAN
selected an alternative, must pay sub-
                                                                                              Hot Spots (Wireless LAN) which permit a
scription charges to the former monopoly.
                                               Telephone cards                                link up with portable computers. Tele2
However, we have succeeded in offering
                                               Since 1999, C – Calling Card Company –
                                                                3                             operates via the operator organization
subscriptions to customers in Denmark
                                               has sold calling cards for fixed telephony     Pass-One for global roaming among vari-
and we are intensively pursuing this issue
                                               in a number of markets in Europe. The call-    ous Hot Spots.
in other countries. This gives our cus-
tomers one invoice and a better overview       ing card is available in different denomi-
of their telephony costs, resulting in more    nations for domestic and international         VoIP
                                               calls and features a code. The customer        Voice over Internet Protocol – telephony via
satisfied customers and notably lower cus-
                                               calls up the number indicated on the card      the Internet.
tomer turnover.
                                               and dials in his/her code – then it’s just a     During 2002, Tele2 conducted a num-

                                               matter of calling cheaper with Tele2.          ber of successful tests using VoIP in broad-

                                                 The calling card is marketed under a         band networks.

                                               number of brands and is sold primarily in
                                                                                                                                       17
Mobile telephony                               make calls outside Sweden using a pre-
                                               paid card. This service has proved to be
                                               very successful.


Tele2 offers mobile telephony via a number     UMTS
of subscription forms and prepaid cards.       UMTS technology increases capacity in
Regardless of whether the service targets      mobile networks considerably compared            infrastructure. Capacity is leased instead
consumers or the corporate market, it is       with GSM. Tele2 believes firmly that third       from a network owner. In countries in
positioned as price leader.                    generation mobile telephony, 3G, will            which Tele2 does not have a mobile
   Having a mobile telephone with a pre-       involve a revolution for access to personal      license, the MVNO concept permits Tele2
paid card is growing in popularity and has     information and entertainment by con-            to supply fixed telephony with a full range
contributed to Tele2’s rapid growth. It’s      necting mobile customers with mobile             of services in subscription and prepaid
easy to understand why many people opt         broadband services such as e-mail, image         calling cards for mobile telephony.
for prepaid calling cards. Customers can       services, games and content portals.               Tele2 expects MVNO´s to expand in the
start calling immediately, they have good         Tele2 has UMTS licenses in Sweden,            immediate future, since deregulation of
control of their telephone costs and can       Finland (via the jointly owned Suomen            the EU telecom market is gaining an
always check how much credit they have         Kolmegee Oy), Luxembourg, Liechtenstein          impact and the mobile market is maturing.
left. They also avoid bills and credit         and Latvia.                                      Tele2 operates as a MVNO in Denmark and
appraisals are unnecessary.                                                                     the Netherlands. During 2002, a MVNO
   A major innovation in Sweden during         MVNO                                             agreement was signed with Telenor in
2002 was the introduction of a service         MVNO – Mobile Virtual Network Operator           Norway and with Connect Austria in
allowing Tele2 customers to receive and        – means that Tele2 can act as a complete         Austria, where the service was subse-
                                               mobile operator without owning its own           quently launched in February 2003.


Internet services                              the conventional network are impossible
                                               due to technical, legal or business reasons.
                                               The success of wireless broadband also
                                               indicates that the former monopolies have
Dial-up Internet                               an erroneous and ongoing monopolistic
Dial-up Internet means that customers are      approach in the pricing of broadband ser-
not permanently connected but can use a        vices.
modem when they wish to link up to the            Tele2 offers wireless broadband via WLL
Internet. Dial-up Internet is available in     in parts of Poland, Czech Republic,
subscription form and as a link-up without     Finland, Norway, Sweden and Denmark.
a fixed charge, for which customers pay                                                         Metropolitan Area Networks
only for the time they are connected. The      ADSL                                             Tele2 offers broadband at 10 Mbit/s in a
primary growth in the area is represented      ADSL – Asymmetric Digital Subscriber Line        number of MANs (Metropolitan Area
by connections without a fixed charge.         – is a technology that permits the use of        Networks) in Sweden and Denmark.
   Tele2 is the market leader in Scandi-       broadband via conventional telephone               In Sweden, the MAN is linked to Tele2’s
navia for dial-up Internet and has very suc-   lines. This area offers major potential,         wide-ranging trunk network, Swipnet,
cessfully launched Internet with subscrip-     especially since customers find the product      which was the first commercial IP network
tions as base in France and Italy in 2002.     easy to use by customers, although pricing       in Sweden. In Denmark, MAN is linked to
Dial-up Internet will be launched in more      by the former monopolies presents a major        the country’s largest trunk network.
countries during 2003. The Internet product    obstacle to future growth. Tele2 is active-
is continually upgraded with new services.     ly continuing its efforts to find solutions to   Broadband via cable-TV
                                               the monopoly problem.                            As early as 1998 in Sweden, Tele2 began
Wireless broadband                                Tele2 offers ADSL in Sweden, Norway,          to offer broadband using cable-TV as the
Broadband is a method for transferring         Denmark and Switzerland. Tele2’s ADSL            carrier. During 2001 and 2002, a large
data in the form of text, images and voice     services have made a definite impact in the      portion of the network was upgraded to
at very high speeds. Wireless broadband        Nordic market and the company has con-           handle broadband. The offering is one of
via WLL (Wireless Local Loop, via radio net-   solidated its position as the largest Internet   the cheapest on the market.
works) is a way of circumventing the access    supplier in Scandinavia. ADSL will be intro-       Tele2 also offers broadband via cable-
network when broadband connections via         duced in additional countries in 2003.           TV network in Estonia and Lithuania.

18 T E L E 2 A N N U A L R E P O R T   2002
Cable-TV
Under the Kabelvision brand, Tele2 offers
one of the market’s best basic packages in
Sweden at an attractive price. Kabel-
vision’s basic package (Pluspaket) offers
access to 15 popular TV channels such as
MTV, Visasat Sport, Discovery, Eurosport
and E!. In addition, Kabelvision offers two
highly competitive expanded packages,
Silver and Gold, as well as premium
channels such as Canal+ and TV1000.
Available throughout Sweden, Kabelvision
has 310,000 household subscribers –
making it the country’s second largest
cable-TV operator. Tele2 also conducts
cable-TV     operations     in    Estonia     and
Lithuania.


Content services
Tele2’s strategy is to organize but not                 During the year, the Tele2 SelfNavigator
develop content services (e-mail, news,              service was launched, permitting cus-
games, ringtones, image services) which              tomers to review, add to or terminate cer-
makes things easier for our customers. The           tain services on the Internet. It is also pos-
services     are   linked    to    the      portal   sible to view billing information and account
Tele2Internet that can be accessed irre-             information.
spective of the form of communication.                  Tele2 also offers a large amount of SMS
Tele2 has a payment solution attached to             and WAP-based services in various mar-
the platform for micro-payments to the               kets. For example, Tele2 was one of the
companies supplying services, indepen-               first companies in Estonia to offer payment
dens of access. The business model is                of parking charges via mobile telephone.
based on distribution of revenue.                    Tele2 was also the first operator to give
                                                     customers in Luxembourg the potential to
                                                     send images using MMS.


                                                                                                      19
Market position
                                       among alternative
                Service         Launch    operators

Sweden          Mobile          1981                                 Market area
                Fixed
                Internet
                Cable TV
                                1993
                                1991
                                1986
                                                    1                Nordic
Norway          Mobile          2000
                Fixed
                Internet
                                1998
                                1997
                                                    1
Denmark         Mobile          2000
                Fixed
                Internet
                                1996
                                1997
                                                    1
Finland         Fixed           2000
                Internet        2001
                                                                     Sweden                                             Comviq was the first operator in Sweden
                                                                     Tele2 was established in Sweden and this        to offer all prepaid card customers the
                                                                     market accounts for the Group’s broadest        opportunity to call and receive calls from


Market area’s share
of the Group’s
                           43%                                       product portfolio. Sweden is also a key test
                                                                     market for new services and their develop-
                                                                     ment, which are subsequently implement-
                                                                                                                     abroad.
                                                                                                                        For corporate customers, Tele2 launched
                                                                                                                     mobile centrex, which offers the potential
net sales                                                            ed in other Tele2 countries.                    to use switch functions directly in the
                                                                        During 2002, Tele2 Sweden sharpened          mobile phone. Customers are seeking to
                                                                     its focus on profitability and sales volumes.   integrate solutions between fixed and
                                                                     Efforts in this direction have highlighted      mobile telephony and the launch of cen-
                                                                     the primary products – mobile telephony,        trex is a step in this direction.
                           2002           2001        Change         fixed telephony, Internet, data network ser-
                                                                     vices and cable-TV.                             Fixed telephony
Number of
                                                                                                                     In February Tele2’s fixed telephony cus-
customers, 000s            6,252*        6,274
                                                                     Sharper customer focus                          tomers were also offered pre-selection for
Net sales, SEK M        13,566         11,898          +14%          Two customer areas were created: Private        local calls. This means that customers
                                                                     Customers and Corporate Customers. The          were also able to benefit from Tele2’s low
EBITDA, SEK M              4,814         3,768         +28%
                                                                     customer areas are in charge of services        prices for local calls. Tele2 is working
*including adjustment to the Group’s definition of active customer   and packaging as well as for reaching their     towards achieving a solution to offer fixed
                                                                     preset profitability targets. The change has    telephony susbcriptions, since this offers
Brands Tele2, Comviq, Kabelvision, Datametrix,                       led to a clear customer focus. The primary      additional potential to reduce customer
          Uni2, Optimal, Tango, Everyday, Get2Net                    results are more effective distribution as      costs and enhance customer loyalty.
                                                                     well as a distinct product offering. The
2002      Increased market shares
                                                                     measures are a major factor underlying          Launch of ADSL
          Improved profitability
                                                                     higher profitability and have been con-         In the case of Internet customers, the
                                                                     ducted in all product areas.                    focus has been on ADSL, which was
                                                                                                                     launched in June. Due to unreasonable
                                                                     Higher market shares                            pricing from the network owner, Tele2 is
“We’re stronger                                                      Tele2 Sweden won market share in all            unfortunately unable to offer a price that
                                                                                                                     is substantially below that of competitors.
than ever in the                                                     product areas. The most aggressive growth
                                                                                                                     However, it is gratifying to see that the dial-
                                                                     was noted in Comviq prepaid, with the num-
Nordic region.”                                                      ber of customers exceeding two million dur-     up Internet service, Free2Connect, has
                                                                     ing autumn 2002. The total number of cus-       shown stable growth.
Fredrik Berglund                                                     tomers exceeded three million at year-end.         Tele2 also launched IP-VPN for the data
Market Area Director, Nordic                                                                                         network market. The launch marked a
                                                                     Consolidated price position in mobile           major sales success and it is planned to
                                                                     Tele2 has consolidated its price position in    enhance the product portfolio in data net-
                                                                     the private and corporate markets. Private      works during 2002.
                                                                     customers are offered “Five ways of
                                                                     calling more cheaply” and corporate cus-        Stronger brands
                                                                     tomers   have    two   new     subscriptions    A logical development of the above is the
                                                                     “Company” and “Company+”. At the close          growing recognition of the Tele2 and
                                                                     of the year, Comviq celebrated its 10th         Comviq     brands.    Currently,    97%     of
                                                                     anniversary with a number of activities,        Sweden’s     population    recognizes     both
                                                                     which included presenting existing and          brands.
        20 T E L E 2 A N N U A L R E P O R T      2002               new customers with lower calling prices.
A taste for action
                                               Tele2 – in pole position


Norway                                          In September Tele2 signed an MVNO               In August, Tele2 launched its ADSL ser-
Despite a slower growth rate in the market    agreement with Telenor. The agreement          vice for households, which offers cus-
as a whole, Tele2 continued to expand and     offers Tele2 the potential to transfer cus-    tomers access to the market’s lowest rates.
win market share. Growth, combined with       tomers currently covered by the present
cost control, resulted in record high prof-   Service Provider agreement to the more         Corporate market
itability for Tele2 Norway.                   competitive MVNO service. The agreement        Tele2 has a complete range of services for
                                              permits Tele2 to develop new, price-lead-      companies, but focuses particularly on
Fixed telephony                               ing services for its customers in Norway.      offering standardized package solutions to
Tele2 strengthened its customer offering        In November, Tele2 returned its UMTS         small and large companies. Standard-
and sales rose throughout the year, despite   license to the Norwegian authorities.          ization of the product portfolio is a suc-
aggressive marketing from old and new         Consequently, Tele2 no longer has any          cessful concept in reaching profitability in
competitors.                                  commitments or expenses linked to the          the corporate market.
                                              expansion of the UMTS network in Norway.
Mobile telephony                                                                             Denmark
Tele2 increased its market share and          Internet                                       The Danish telecom market is undergoing
strengthened its position in the mobile       Although the market for dial-up Internet       restructuring and consolidation. A number
market, with revenue showing a stable         continued to weaken in 2002, Tele2 man-        of players have withdrawn from the mar-
increase during 2002.                         aged to raise its market share. Marketing      ket. Tele2 is continually seeking to max-
  Tele2 successfully recruited mobile         campaigns in January and December were         imise the resulting emerging opportuni-
customers from Tele2’s existing customer      successful in recruiting a substantial num-    ties.
base in fixed telephony. Cross-selling        ber of new customers. Cross-selling has           Tele2 focused on controlling growth and
offers lower costs in attracting new cus-     also proved to be highly successful, result-   costs and is entering 2003 with good
tomers, moreover this type of customer        ing in a larger number of more loyal cus-      prospects in terms of growth and earnings.
calls more frequently and is more loyal       tomers.
than other customer groups.
                                                                                                                                      21
Mobile telephony                                 Tele2 operates a Wireless Local Loop for     Datametrix
2002 was a year of consolidation, restruc-    broadband in Jyväskylä. The service was         Datametrix is a strong system integrator in
turing and reassessment of the market for     launched in spring 2002 and Tele2 is            the Nordic market. The company is char-
Danish mobile operators. Prices in the pri-   studying the possibility of expanding into      acterized by good geographic coverage,
vate market have declined and competi-        other cities with other network owners.         flexibility and cost-consciousness.
tion continues to be tough. Tele2 conduct-                                                      The market is driven by the develop-
ed measures aimed at raising profitability    Monopolistic market                             ment of conventional telephony with innova-
from mobile services, which led to a reduc-   The monopolistic nature of the Finnish          tive applications and the ever-growing
tion in costs for customer procurement and    market means that Tele2 cannot yet offer        demand for mobile solutions. IP telephony
an increase in call volume per customer.      local calls. Nevertheless the number of         has established itself as a competitive
   During early 2002, Tele2 launched a        customers and revenue rose during 2002.         alternative for commercial applications.
subscription service, which reported rapid      During the year, new agreements were
growth.                                       signed covering international calls and other   Sweden
                                              services that reduce costs for Tele2. During    The Swedish organization has been
Internet                                      2002, Tele2 moved from the development          streamlined and is now focusing on IP
Tele2 ASDL was launched in August 2002.       phase to greater customer focus and further     telephony and system integration of tele-
The strategy is to attain balanced and cost   developed its fixed telephony services,         phony and data. Like Tele2, Datametrix is
effective growth. The launch of broadband     which were launched in autumn 2001.             a unique total solution supplier with a
has meant a reduction in dial-up traffic in                                                   strong product and service profile.
the overall market. But customer intake       Optimal Telecom
continues nonetheless.                        Optimal Telecom is a Service Provider           Norway
   A review of the company and its inter-     offering individuals fixed telephony and        In November 2002, Datametrix in Norway
nal processes permitted the achievement       Internet and the Tango prepaid calling card     celebrated its 20th anniversary. The com-
of synergies between Tele2 and UNi2, the      for mobile telephony.                           pany has developed into a prominent sys-
brand for corporate Internet.                                                                 tems integrator in the Norwegian market.
                                              Lowest-price guarantee                          It has become a market heavyweight
Fixed telephony                               Optimal Telecom’s lowest price guarantee        through its consistent efforts in its three
During the year, Tele2 launched what          automatically gives customers the lowest        core areas: infrastructure, IP telephony
could be viewed as an alternative to fixed    ordinary rate from Telia, Tele2, TeleNordia,    and security.
price telephony, namely, the Weekend+         Rix Telecom, Utfors, Glocalnet and ACN. The
service, which offers 24-hour free tele-      guarantee is the primary factor underlying      Denmark
phony each Sunday. The service attracted      Optimal Telecom’s high customer loyalty.        In September, Datametrix in Denmark was
considerable attention and appeals to the        Optimal Telecom also sells cordless          ranked number 18 on the Børsen Gazelle
conservative, fixed telephony market.         telephones    and     speaker    telephones     index of the fastest growing companies in
   Two small operators with the corporate     equipped with a calling-router, which           Denmark, computed by the daily paper
sector as their niche were acquired during    means calls are always handled by Optimal       Børsens Gazelle index. The factor underly-
the year, which contributed to an increase    Telecom.                                        ing the success of Datametrix is its keen
in the customer base and revenue in the                                                       focus on products for the call-center mar-
corporate segment.                            Expansion in the private market                 ket.
   At the end of the year, the Danish         Optimal Telecom continued to report
authorities presented new regulations that    robust growth in fixed and mobile teleph-       Partners
entail a reduction in interconnect charges    ony, while the company also raised prof-        In May 2002, Datametrix was appointed
in certain areas during 2003.                 itability, despite stiff competition in the     Norway Gold Partner to Cisco. This is con-
                                              market.                                         firmation of the company’s leading-edge
Finland                                          During 2003, the focus is on generat-        expertise and business skills. In Sweden,
Tele2 offers fixed telephony in Finland in    ing continued growth and improved prof-         the company is Gold Partner to Avaya and
the form of domestic calls, international     itability in fixed and mobile telephony         a certified Ericsson Service and Sales
calls and calling cards. In the Helsinki      through increased cross-selling and build-      Partner. During the year, Datametrix signed
area, dial-up Internet is also offered. The   ing long-term customer relations.               an OEM agreement with Intel, making it
launch of iHear telephones commenced in                                                       the sole vendor of Intel’s product line for
the summer of 2002.                                                                           VPN in Sweden.


22 T E L E 2 A N N U A L R E P O R T   2002
Market position
                                                                                                                                  among alternative
                                                                                                            Licenses       Launch*   operators

Market area                                                                                  Estonia        Mobile         1998
                                                                                                            Fixed
                                                                                                            Cable-TV
                                                                                                                           1998
                                                                                                                           1998              1
Eastern Europe                                                                               Latvia         Mobile         1999
                                                                                                                                             1
and Russia                                                                                   Lithuania      Mobile         2000
                                                                                                                                             2
                                                                                             Czech
                                                                                             Republic
                                                                                                            Fixed
                                                                                                            Internet
                                                                                                                           2002
                                                                                                                           2000              1
                                                                                             Poland         Fixed          2003
                                                                                                            Internet       2000
Russia                                        Estonia
Tele2 offers mobile telephony in eleven
regions in Russia. Most of the companies
                                              Tele2 in Estonia offers a broad range of
                                              telecom services: mobile telephony (sub-
                                                                                             Russia         Mobile
                                                                                                                                             7
operate under the FORA brand. In              scription and prepaid calling cards), fixed    *Year of launch by Tele2
November Tele2 sold its share of the          telephony, Internet, content services and
Moscow-based NMT450 operator MCC.


Preparations for GSM
                                              cable-TV.
                                                2002 was one of the most successful
                                              years in the history of the company. The
                                                                                             Market area’s share
                                                                                             of the Group’s
                                                                                                                        8%
During the year, Tele2 received GSM           sharp growth from 2001 continued into          net sales
licenses for Nishny Novgorod, Chelyabinsk     2002. Tele2 is the most rapidly growing
and the St Petersburg region. Thus, all       mobile operator in Estonia and now has a
companies have licenses for GSM1800           tight grip on the second place in the mar-
and work is in progress to launch the first   ket. Tele2 now commands one-third of the
regions during 2003.                          Estonian mobile market.
                                                                                                                        2002   2001      Change
                                                Tele2 is also clearly the leading alter-
Calling Party Pays                            native operator in fixed telephony.            Number of
                                                                                             customers, 000s         1,574        996    +58%
Tele2’s company in Omsk was the first
mobile operator to launch CPP (Calling        Supplementary services launched                Net sales, SEK M        2,320     1,148     +102%
Party Pays) services, which, as the name      During 2002, several supplementary ser-
                                                                                             EBITDA, SEK M               541      272    +99%
implies, means that the calling person        vices were launched that create added
pays the call. CPP is unusual in Russia,      value for customers and which offer com-
where it is most common that the mobile       petitive advantages for Tele2. Among other
                                                                                             Brands Tele2, Fora, C gates, Zeta Zivtina
telephone owner pays (MPP, Mobile Party       points, Tele2 is the only mobile operator to
Pays), even when that person is called.       date that offers pan-Baltic roaming for pre-   2002      Revenue doubled
CPP has proved to be an attractive and        paid customers. Tele2 has also introduced                Continuing profitability
effective means of competition in the         a uniform invoice for customers who have
Russia market. Tele2 has also launched        fixed as well as mobile telephony.
CPP in Chelyabinsk. During 2003, Tele2                                                       “Tele2 is growing rapidly
will continue its efforts in negotiating      Attractive services
                                                                                             in the Baltic States, with
agreements for CPP in other regions.          Tele2 is very positive about prospects in
                                              2003, not least because of a highly attract-   more than one million
Outlook for 2003                              ive product and service offering, although     satisfied customers.”
Prospects for the Russian economy in          competition in the Estonian market has
2003 are positive. The mobile telephone       stiffened in recent times.                     Johnny Svedberg
                                                                                             Market Area Director, Eastern Europe and Russia
market expanded by 125% in 2002. Rapid
growth is expected to continue during the
current year. The customer segments now
seeking to acquire mobile telephones are
the middle class, middle management in
companies and small business owners,
which traditionally have been strong cus-
tomer groups for Tele2.


                                                                                                                                        23
Tele2 fångar de stora fiskarna
                               Thrives on competition
                              Tele2 – more efficient than the old monopolies


Latvia                                          vice means that both subscription and pre-       Recognition of Tele2 is very high. 80%
Tele2 is the leading alternative mobile         paid customers can call from anywhere in       of Latvians recognize the brand, even
operator in Latvia. The company’s growth        the Baltic States and still enjoy call rates   though it was launched less than two years
is being driven particularly by the success     as if they were at home in Latvia.             ago. This level of recognition is reflected
in prepaid calling cards. Tele2 plans to          Prepaid customers now get a bonus            in growth: Tele2 is the most rapidly grow-
launch fixed telephony during 2003.             when they are called, which contributes to     ing telecom company in Latvia.
                                                raising call volumes. They can also refill
Leader in the prepaid calling card market       the prepaid card directly from their bank
Tele2 leads the market for prepaid calling      account, all that is required is an SMS –
cards with Zelta Zivtina, “Gold Fish”.          making it simple for customers and offer-
Subscription services are the leading alter-    ing a cost saving for Tele2.
native to the former monopoly. A new ser-


24 T E L E 2 A N N U A L R E P O R T   2002
Increasingly comprehensive range               Deregulation of fixed telephony                  In early 2002, Tele2 became the first
During 2002, Tele2 acquired one of two         There are good prospects for the strong        company to win a public license for fixed
UMTS licenses in Latvia. Tele2 also has        growth in mobile telephony continuing.         telephony. Negotiations for an intercon-
one of the two GSM licenses (900 and           The market for fixed telephony was deregu-     nect traffic agreement with the former
1800) for Internet services and a license      lated in 2003 and Tele2 will maximise the      monopoly were concluded in December
for broadband via radio networks. An           opportunities for cross-selling as they        and the launch of fixed telephony is
application for fixed telephony has been       emerge.                                        planned for the first quarter of 2003.
submitted, and Tele2 expects an allocation
during early 2003.                             Cable-TV and broadband                         Deregulation heralds new opportunities
                                               During 2002, Tele2 achieved a dominant         In November 2002, Tele2 signed a distri-
Exciting development                           position in cable-TV in all the company’s      bution agreement for its prepaid calling
Both the customer base and revenue are         areas in Vilnius. During the autumn the        cards for fixed telephony with the Polish
expected to rise when Tele2 enters the         cable-TV network was expanded to cover all     Post Office, which sharply increased the
market for fixed telephony, at the same        of Vilnius.                                    number of sales outlets from 2,000 to
time as it continues to fuel growth in            The number of broadband customers           10,000.
mobile telephony.                              doubled during the year. Tele2 offers cable-     Since Poland has some of the highest
                                               TV and broadband under the C gates brand.      telephony rates in Europe, there are major
Lithuania                                                                                     opportunities awaiting Tele2 during the
Since its start-up in Lithuania in 2000,                                                      first quarter of 2003 with the finalization
Tele2 has established a strong position as     Czech Republic                                 of deregulation. This creates the potential
the leading operator among private cus-        Tele2 has strengthened its position as one     for Tele2 to market a more comprehensive
tomers.                                        of the three largest suppliers of wireless     service range in fixed telephony.
  Mobile penetration rose sharply in 2002      broadband in the Czech Republic and has
and the customer base more than doubled.       established a presence in the market for       X-source
Tele2 is winning market share at the           fixed telephony.                               X-source operates in IT outsourcing. The
expense of the two competitors; Bite and          During 2002, Tele2 expanded wireless        company was started by Tele2 in an effort
Omnitel.                                       broadband to an additional two cities and      to support IT operations in the group. The
                                               the number of customers rose by 52%.           head office is located in Stockholm.
Strong brand                                   Depending on the business terms and con-         During 2002, X-source expanded and
During the past year, strength and trust in    ditions that can be achieved, Tele2 is like-   opened offices in London, Luxembourg
the Tele2 brand have grown considerably,       ly to offer ADSL during 2003.                  and Copenhagen. It also took over part of
with brand recognition rising to 71% dur-                                                     Transcom Sweden’s IT operations. As a
ing the fourth quarter of 2002. A contribu-    Success in fixed telephony                     result, X-source is now established in six
tory factor is the fact that the GSM network   In July, Tele2 became the first operator to    locations in Sweden. The company plans
was expanded so that it now covers a little    conclude an interconnect traffic agree-        to established a presence in the Baltic
more than 90% of the population.               ment with Cesky Telecom. The agreement         States by spring 2003.
                                               permits private customers to call more
Subscriptions launched                         cheaply with Tele2 by dialing a prefix.        Competitive prices
During the first quarter of 2002, the Joker    Tele2 is now a well-known brand in the         X-source offers services in operations and
subscription service was launched, offer-      Czech Republic and the largest alternative     the development of PC workplaces, oper-
ing the market’s lowest monthly charge         operator in the private market. During         ations and maintenance of servers, data com-
and a price guarantee. During the third        2003 Tele2 plans to offer pre-selection        munications and data security. X-source
quarter, a subscription was launched that      and local calls.                               introduces a business approach to PC work-
is aimed at small and medium-sized com-                                                       places and assists client companies in
panies.                                        Poland                                         creating a secure and controlled IT infra-
  Tele2 in Lithuania was also the first        Tele2 Poland continued its rapid develop-      structure, while simultaneously reducing IT
operator to launch pan-Baltic roaming for      ment in IP telephony and wireless broad-       costs.
prepaid customers.                             band access. The focus is on small and           X-source’s services are also competitive
                                               medium-sized companies. The number of          for companies outside the Tele2 Group.
                                               customers more than doubled during             Customers include Datscha, Metro, MTG,
                                               2002.                                          Viasat, EIM. Iocore and Basset Support
                                                                                              Solutions.

                                                                                                                                       25
Market position
                                      among alternative
               Licenses        Launch    operators

                                                          Market area
Germany        Fixed           1998
                                               3
The
Netherlands
               Mobile
               Fixed
                               2001
                               1997            1          Central Europe
Switzerland    Mobile         2000
               Fixed
               Internet
                              1998
                              2002             2
Austria        Mobile
               Fixed
                              2003
                              1999             1
Ireland        License for fixed telephony.

                                                          Germany                                         The Netherlands
                                                          In 2002, Tele2 strengthened its position        Tele2 bolstered its position as the second-


Market area’s share
of the Group’s
                       18%                                as the third-largest alternative operator in
                                                          the German fixed telephony market and is
                                                          currently one of the fastest-growing oper-
                                                                                                          largest alternative operator in the Dutch
                                                                                                          fixed telephony market in 2002. At the end
                                                                                                          of the year, 80% of the population was
net sales                                                 ators in the country.                           familiar with the Tele2 brand.


                                                          Focus on growth                                 Fixed telephony
                                                          Growth is the result of several measures        Greater focus on pre-selection customers
                                                          undertaken during the year such as a sim-       and iHear phones led to a dramatic
                        2002          2001      Change    plified price structure, successful market-     increase in ARPU during the latter part of
                                                          ing campaigns focusing on comparing             2002. Efforts to increase customer loyalty
Number of                                                 Tele2’s prices with competitors’ and a dis-     during the third and fourth quarter were
customers, 000s        3,587          3,191      +12%
                                                          tinct targeting of pre-selection customers.     successful and contributed to the rise in
Net sales, SEK M       5,689          4,844      +17%     Combined with an increased focus on             volume. With huge success, Tele2 focused
                                                          measures to limit customer turnover, this       its marketing on private customers, and
EBITDA, SEK M             –81         –606
                                                          will pave the way for sustained growth in       market share increased during the year.
                                                          2003.
                                                                                                          Tele2Mobile – MVNO
Brands Tele2, Everyday, Calling Card Company, 3C
                                                          Deregulation lags behind rest of Europe         Tele2Mobile experienced fantastic growth
2002      Sharp growth in earnings                        The deregulation of the German market           as well as strong development during the
          Fixed telephony provides positive EBITDA        has lagged behind the rest of Europe. For       second half of 2002. Tele2 operates as a
                                                          example: local calls are not deregulated,       Mobile Virtual Network Operator, MVNO,
                                                          pre-selection rules are more complicated        and is the sixth-largest mobile operator in
                                                          than in other countries and Deutsche            the country. Cross-selling to current fixed
                                                          Telekom is allowed to package its services      telephony customers has proven to be suc-
“Deregulation                                             jointly despite the fact that local calls are   cessful. Tele2’s success in the future is
                                                          not open to competition. After strong pres-     founded on its ability to offer fixed tele-
opens up                                                  sure from the EU, Germany is expected to        phony customers new services at more

opportunities                                             start a deregulation process in 2003.           attractive rates. The marginal cost stem-
                                                                                                          ming from the new services is low.
for Tele2.”                                               Tele2 gaining greater brand recognition
                                                          Tele2’s market strategy and comprehen-          Switzerland
Roman Schwarz                                             sive cost efficiency guarantee that Tele2       Tele2 has become the second-largest alter-
Market Area Director, Central Europe
                                                          will survive as one of the strongest players    native fixed operator in Switzerland fol-
                                                          on the market. Market consolidation is pos-     lowing its 1998 launch of fixed telephony
                                                          itive because it weeds out many operators       in the country. The company is known for
                                                          that lack a sound business model. This          its competitive rates, easy-to-understand
                                                          eases pressure from future competition.         pricing and for challenging the former
                                                            Recognition of the Tele2 brand increased      monopoly.
                                                          dramatically in 2002. Tele2 is the third
                                                          most recognized brand within fixed tele-
                                                          phony.


       26 T E L E 2 A N N U A L R E P O R T   2002
Confident outlook
                                 Tele2 welcomes new challenges


Simple pre-selection sign-up                    Austria                                        Focus on growth
Tele2 succeeded in building a strong base       Tele2 is the largest alternative fixed tele-   Tele2 will continue to focus on profitable
of pre-selection customers, a feat made         phony operator in Austria. The number of       growth while exploring new business
possible by actions such as being the first     customers as well as operating revenue         potential such as MVNO agreements and
operator in Switzerland to take advantage       rose during 2002. Tele2 is known for its       other value-added services. The launch of
of the so-called Third Party Verification, in   attractive rates, excellent customer service   mobile telephony as a MVNO occurred in
which, as the name implies, a third party       and reliability.                               early 2003.
verifies that an agreement has actually
been reached. This makes it easy for cus-       Increased recognition of Tele2                 Ireland
tomers to sign up for pre-selection with one    A growing number of Austrians know what        Tele2 has a fixed telephony license in
simple phone call.                              Tele2 represents and as many as 85% of         Ireland.
   The launching of Tele2Mobile in May          the population is familiar with the Tele2
2000, Tele2 Voicebox in April 2002 and          brand. A high proportion of pre-selection
Tele2 Internet ADSL in November 2002            customers and a low churn reflect a great
has enabled Tele2 to broaden its product        degree of customer satisfaction and loyalty.
offering substantially and has strengthen          During the year, the company intro-
its market position. The focus is on private    duced e-invoices and prepaid cards for
customers as well as on small businesses        international calls.
and medium-size companies.


                                                                                                                                      27
Market position
                                     among alternative
               Licenses       Launch    operators

                                                          Market area
France         Fixed
               Internet
                              1999
                              2002              1
Italy          Fixed
               Internet
                              1999
                              2002              2         Southern Europe
Spain          Fixed          2001
                                                4
Portugal       Fixed          2003


Market area’s share
of the Group’s
                          26%                             France
                                                          Tele2 provides a complete range of fixed
                                                          telephony services to private customers
                                                                                                          Italy
                                                                                                          Tele2 also has a complete range of services
                                                                                                          in fixed telephony in Italy. Tele2 is Italy’s
net sales                                                 and smaller businesses: local calls, nation-    second largest alternative operator, with a
                                                          al calls, international calls and calls to      market share of about 9%.
                                                          mobile phones.                                     Tele2 continued to experience fast-
                                                             The company is the leading alternative       paced growth in Italy in 2002. Compared
                                                          operator in France with a market share of       to 2001, revenues grew by more than 60%

                          2002        2001       Change   12%. With almost three million active cus-      and traffic volumes rose 80%. The back-
                                                          tomers and 50% of the market area’s rev-        ground to the rapid growth is that Tele2
Number of                                                 enue, France is also one of Tele2’s largest     has been offering all customers local calls
customers, 000s           5,129      4,286        +20%
                                                          operations.                                     via pre-selection since 2001.
Net sales, SEK M          8,105      5,124        +58%
                                                          Price-leading operator                          Strong brands
EBITDA, SEK M             –101      –1,331
                                                          Tele2 is perceived as the price-leading         With about 2 million customers and a high
                                                          operator and is known for its quality and       ARPU, Tele2 Italy is a strong and profitable
                                                          customer service and for products that are      part of the Group. Tele2, which is posi-
Brands Tele2, Everyday, Calling Card Company, 3C
                                                          easy to use. Tele2 enjoys a brand recogni-      tioned as the price leader in the Italian
2002     Sharp rise in revenue growth                     tion rate exceeding 80% among the French        market, is a well-known brand – more than
         Robust earnings trend                            population. The French market offers major      80% of the population recognizes it.
                                                          potential for continuing growth. The strong     Greater recognition of Tele2, combined
                                                          brand offers Tele2 the potential to strength-   with higher customer satisfaction, has
                                                          en its position as the price-leading opera-     increased customer loyalty.
                                                          tor and keep down costs in order to attract
                                                          new customers.                                  Cross-selling to Tele2’s customers
                                                                                                          Tele2 benefits from being able to offer
                                                          Higher revenue                                  local calls and a stable competitive situa-
                                                          The launch of local calls in 2002 con-          tion. During the third quarter of 2002,
“Tele2 continues to                                       tributed to increases in revenue and cus-       dial-up Internet was launched, which
                                                          tomer loyalty and helped Tele2 to report        proved to be a remarkable success. The
attract an increasing                                     profitability, three years after its opera-     strategy of supplementing the product and
                                                          tional start. The improvements were             service offering to the existing customer
number of customers.”                                     gained at a very low cost. The trend towards    base and an increased number of pre-
                                                          profitability remained strong throughout        selection customers creates the potential
Jean-Louis Constanza
Market Area Director, Southern Europe                     the year, especially during the fourth quar-    for continuing growth.
                                                          ter. Tele2 expects to launch ADSL suc-             As in the case of Tele2 France, Tele2
                                                          cessfully this current year, against the        Italy is undergoing strong development
                                                          background of the access network being          and the rapid customer intake has contin-
                                                          opened up and the fact that Tele2 already       ued in early 2003.
                                                          has an attractive dial-up Internet offering.


        28 T E L E 2 A N N U A L R E P O R T   2002
Gillar utveckling
                     A great future i Eurpoa
                        Tele2 växer snabbast

                          Tele2 for big and small


Spain                                           MVNO license
In just a short period, Tele2 has estab-        With a brand recognition rate of 60%
lished itself in the Spanish market and is      among the Spanish population, Tele2 is
already the country’s fourth largest alter-     beginning to capitalize on its marketing
native operator. Tele2 offers prepaid fixed     and effective IP-based network. Spain is
telephony services for national calls,          the first country in Southern Europe in
international calls and calls to and from       which Tele2 received an MVNO license.
mobile networks.
   The prepaid services are highly effect-      Portugal
ive in curtailing billing costs, reducing bad   Using Spain as the base, Tele2 is launch-
debts and reducing churn.                       ing fixed telephony in Portugal during the
   Tele2’s revenue rose more than 160%          first half of 2003.
compared with 2001.


                                                                                             29
Market position
                                       among alternative
                 Licenses       Launch    operators

Luxembourg       Mobile        1998                        Market area
                 Fixed
                 Internet
                               1999
                               2000            1
Liechtenstein Mobile           2000
                                                           Luxembourg
              Fixed
              Internet
                               2000
                               2000            1
Belgium          Fixed          2003


                                                           Luxembourg                                     2002 and plans to offer UMTS services in

Market area’s share
of the Group’s
                         2%                                Tele2 has offered fixed telephony in
                                                           Luxembourg since 1999 and is clearly the
                                                           largest competitor to the former monopoly.
                                                                                                          the new network during the second half of
                                                                                                          2003. Fixed telephony has been available
                                                                                                          under the Tele2 brand since June 2000.
net sales
                                                           Pre-selection customers comprise 40% of        The company holds a license for GSM and
                                                           the customer base. After repeated appeals      for all types of fixed-line telecommunica-
                                                           from Tele2, the authorities have forced the    tion services, including the Internet.
                                                           former monopoly to cut its interconnection
                                                           fees by another 20% during 2003. In            Belgium
                         2002        2001       Change
                                                           March 2002, Tele2 began to offer prepaid       Tele2 has a license for fixed telephony in

Number of                                                  calling cards for fixed telephony.             Belgium and services have been offered
customers, 000s           222          211           +5%                                                  since January 2003. The goal is to quickly
                                                           Growth in mobile telephony                     become the leading alternative to the for-
Net sales, SEK M          754          663       +14%
                                                           The Tango brand is one of the most appre-      mer monopoly.
EBITDA, SEK M             126            5                 ciated in Luxembourg. With a GSM 900
                                                           and GSM 1800 license, Tango is the largest     3C
                                                           mobile operator in Luxembourg with a share     3C has been active in public telecommu-
Brands Tele2, Tango, Everyday, 3C, Transac                 of almost 50% of the active customers in       nications for more than 17 years.
                                                           the market. The traffic volume rose by            The company currently offers integrated
2002    Increased revenue
        Higher profitability
                                                           more than 40% compared to 2001, main-          solutions for processing credit card trans-
                                                           ly because of strong growth within prepaid     actions, solutions for payments via the web
                                                           calling cards. Tango received a UMTS           and public credit card telephones.
                                                           license in May 2002 and services in the           3C approves and processes credit card
                                                           new network are scheduled for commercial       transactions for 20 different national and
                                                           launch in the second quarter of 2003.          international banks. Its pan-European
                                                             Everyday Media encompasses Tango TV          presence in 650 hotels, 300 restaurants
                                                           and Tango Radio. The main purpose for          and 550 parking companies makes the
                                                           this – apart from marketing Tango’s ser-       company a unique player in the European
“An exciting 2003                                          vices – is to create interactivity between     market for integrated credit card transactions.

with, among other                                          the media and mobile telephony by using           The Parking service is an overall con-
                                                           SMS, MMS, WAP and IVR as bearers of            cept for parking lot operators. The concept
things, a launch                                           content services being generated by the        was developed in Britain, where 3C has
                                                           media companies.                               95% of the market for parking spaces at
in Belgium.”                                                                                              the airports and in larger cities. Operations
                                                           Internet services                              are being expanded to Sweden, Norway
Jean-Claude Bintz
                                                           Internet services were launched in June        and Germany.
Market Area Director, Luxembourg
                                                           2000 and are reporting steady growth, pri-        3C has credit card phones at major
                                                           marily thanks to its prices, which are the     European airports, hotel chains and trade
                                                           lowest in the market.                          fairs.


                                                           Liechtenstein                                  Transac
                                                           Tele2 is the largest alternative operator in   Transac is a Luxembourg-based company
                                                           Liechtenstein. The company has provided        offering services in data processing to
                                                           mobile telephony services in the country       companies that process large amounts of
                                                           since March 2000 under the Tango brand.        data, such as credit card transactions and
                                                           Tele2 was awarded a UMTS license in            billing.

       30 T E L E 2 A N N U A L R E P O R T   2002
Market area
Branded products & services


United Kingdom                                 Calling Card Company (C3)
Tele2 launched fixed telephony in cooper-
ation with the British Post Office in
November 2001. Tele2 had already sup-
                                               C3 sells calling cards in the UK, France,
                                               Germany, Italy, the Netherlands, Spain and
                                               Austria and Tele2’s rechargeable interna-
                                                                                              Market area’s share
                                                                                              of the Group’s
                                                                                                                     3%
                                                                                              net sales
plied national and international access for    tional call card, which may be used in a
the Tele2 group. Prepaid calling cards for     large number of countries. C3 operates in
fixed telephony are sold under the Post        close cooperation with Tele2, which sup-
Office brand and may be purchased at post      plies network capacity, with the focus on
offices, via Post Office telephone services    price and quality in international lines.
or at the Post Office website.                                                                                   2002       2001      Change
                                                 Prepaid calling cards are sold mainly in
  During the year, the customer base in        stores and kiosks, but C3 is continuing to     Net sales, SEK M      848    1,408         –40%
fixed telephony grew constantly and the        seek additional sales channels. The pre-
challenge ahead is to continue to capital-                                                    EBITDA, SEK M         –172    –410
                                               paid card was launched in cooperation
ize on the major potential       of the Post   with the British Post Office in October
Office brand, as represented by the Post       2001 and volumes increased steadily dur-
Office’s 40,000 cashier counters at                                                           Brands Tele2, C3, iHear, Everyday
                                               ing 2002.
17,500 sales outlets.                            In February 2002, C3 won a tender from       2002    Success for calling cards
  Tele2 has successfully managed trials        AAFES (American Army and Air Force) for                Improved earnings
to offer pre-selection services in the UK      deliveries to bases in Italy, UK and the
and will continue its launch during the        Netherlands. In October, the agreement
first quarter of 2003.                         was extended to include US naval bases.
  Access operations doubled their traffic        After trials during the summer, Tele2
volume during the year as Tele2 increased      was selected as the supplier of calling
its presence in the tough market for access    cards to the Travelex group in continental
services in London.                            Europe. C3 doubled its volume in the sec-
                                               ond half of the year compared with the first
iHear                                          six months.
Tele2 has its own product range of ana-          C3 enhanced its prepaid calling card
logue and digital cordless phones, which       technology to permit calls from Call Shops,
                                                                                              “Implementing
are marketed under the brand name iHear.       a service now available in France, Italy and   successful marketing
The telephones are equipped with a call-       Spain, and which will be further expanded
ing-router that automatically routes the       to include the UK and Germany during the       based on best practices
calls to the Tele2 network. More than          first half of 2003.
600,000 iHear telephones were sold               Along with 3C, C3 has also developed a
                                                                                              across Europe”
across Europe during 2002, mainly through      magnetic card that is undergoing trials in     Anders Olsson
telemarketing.                                 Italy and the UK.                              Market Area Director, Branded products & sevices


                                               Everyday
                                               Tele2    owns       the   Internet   portal
                                               Everyday.com jointly with MTG.


                                                                                                                                    31
Report of the Board of Directors

The Board of Directors herewith presents the Annual Report for Tele2 AB (publ) company registration number 556410-8917 for
fiscal 2002.


Tele2 AB’s share is listed on Stock-               667 million (2001: SEK 1,376 million)           amounting to SEK 1.9 billion, and in-
holmsbörsen (Stockholm Stock Exchange)             and sales of shares amounted to SEK 40          creased pre-tax profit by more than SEK
under the abbreviations TEL2A and TEL2B            million (2001: SEK 236 million).                2.7 billion to SEK 796 million. Main-
and Nasdaq under the abbreviations                    Tele2 had a total of 16.8 million cus-       taining a balance between customer
TLTOA and TLTOB.                                   tomers at December 31, 2002, to which a         growth, profitability and cash flow will con-
   The     ten     largest     shareholders   at   one-off adjustment of –389,000 has been         tinue to have priority during 2003, and as
December 31, 2002 held shares corre-               applied to adjust all Group companies to        a result of this it is probable that the Board
sponding to 60% (2001: 44%) of the cap-            report in line with the Group’s definition of   will propose a dividend for fiscal 2003.
ital and 80% (2001: 72%) of the voting             an active customer (see Note 36). Net cus-         Fixed telephony operations in continen-
rights, of which the Invik & Co AB,                tomer intake for 2002 as a whole before         tal Europe continue to show sharp growth
Industriförvaltnings AB Kinnevik, Emesco           this adjustment was 15%, corresponding          and now have 8.5 million customers.
and Millicom International Cellular S.A.           to 2,195,000 (2001: 3,108,000). Tele2’s         Combined, Southern and Central Europe
owns 30%, 26%, 9% and 3%, respectively,            operating revenue amounted to SEK               reached breakeven at the EBITDA level
of the voting rights, and 9%, 21%, 2% and          31,282 million (2001: SEK 25,085 mil-           during 2002. Growth of 58% in Southern
7% of the capital.                                 lion), or an increase of 25%.                   Europe is in turn being driven through the
                                                      EBITDA amounted to SEK 5,127 mil-            introduction of local carrier pre-selection.
Operations                                         lion (2001: SEK 1,698 million), with an         This is encouraging since local pre-selec-
Tele 2 AB, formed in 1993, is the leading          EBITDA margin of 16% (2001: 7%). EBIT           tion is about to be introduced in Germany
alternative pan-European telecommunica-            totaled SEK 1,530 million (2001:SEK             during 2003, which will boost revenue in
tions company offering fixed and mobile            –1,356 million) with an EBIT margin of          Central Europe without raising costs. The
telephony, as well as data network and             5% (2001: –5%).                                 EBITDA margin of 22% in our Swedish
Internet services, under the brands Tele2,            Net interest expense and other financial     fixed telephony operations remains within
Tango and Comviq to more than 16.8 mil-            items totaled SEK –698 million (2001:           our profitability target. Tele2’s mobile
lion customers in 22 countries. Tele2 oper-        SEK –621 million). The average interest         operations are “Best in Class”, with EBITDA
ates Datametrix, which specializes in sys-         rate on outstanding liabilities was 6.4% in     margins of 55% in Sweden, along with an
tems integration; 3C Communications,               2002. Net profit after financial items          impressive customer intake, notably in the
which operates Internet payments, credit           amounted to SEK 796 million (2001: SEK          Baltic States. We are continuing to focus
card transactions and public pay tele-             –1,944 million).                                on cutting costs in an effort to win new
phones; Transac, which offers data pro-               Tax on net profit for the year amounted      customers, reduce customer turnover, or
cessing of credit card transactions and            to SEK –574 million, which was positive-        churn, and gain control over operating
billing; C3, which is active in prepaid call-      ly affected by SEK 576 million in respect       expenses.
ing cards for fixed telephony; and Optimal         of a revaluation of loss carry-forwards in a       Local carrier pre-selection is being
Telecom, which offers households low               number of European companies. In 2001,          steadily introduced throughout Europe and
price guarantees for telephony services.           tax on net profit was SEK 2,335 million,        already in 2002 it was widely available in,
The Group also offers cable-TV services            which reflected the tax effects in Swedish      for example, Sweden, Denmark, France,
and jointly owns the Internet portal               operations, and a tax effect of SEK 3,082       Spain and Italy. Local pre-selection made
Everyday.com with MTG. Tele2 AB’s share            million in connection with the restructur-      a major contribution to growth in Southern
is listed on Stockholmsbörsen (Stockholm           ing of SEC. Profit after tax was SEK 223        Europe during the year, with revenue surg-
Exchange) under TEL2A and TEL2B and                million (2001: SEK 392 million). Earnings       ing by 58%. With local pre-selection
on Nasdaq under TLTOA and TLTOB.                   per share were SEK 1.51 (2001: SEK              already available in the Netherlands since
   During 2002, the Tele2 Group invested           2.70) after full dilution.                      August 2002 and with its introduction in
a net of SEK 1,890 million (2001: SEK                 During 2002, not only did Tele2 grow         Germany during 2003, Central Europe is
2,145 million) in intangible and tangible          faster than its competitors, with an organ-     expected to experience the same benefits
fixed assets (see Not 32). Investments in          ic growth of 25%, but also managed to           during 2003.
shares in companies amounted to SEK                generate the record cash flow to date,


32 T E L E 2 A N N U A L R E P O R T   2002
Five-year summary
    SEK million                                                                  2002*            2001          2000**         1999***            1998


Income statement and balance sheet items:
Operating revenue                                                               31,282          25,085          12,440            8,171          5,918
EBITDA                                                                           5,127           1,698           1,820            2,060          1,165
EBIT                                                                             1,530          –1,356             420            1,152            506
EBT                                                                                796          –1,944              165           4,184                219
Net profit/loss                                                                    223             392             –396           3,768                53
Shareholders' equity                                                            28,728          29,517          26,539            6,659          2,926
Shareholders' equity, after dilution                                            28,870          29,547          26,584            6,659          2,926
Balance sheet total                                                             46,872          49,156          42,345          14,401           9,995
Cash flow from current operations                                                4,365             413              883           1,753                971
Liquidity                                                                        2,332           1,625            1,304           1,123                821
Net borrowing                                                                    7,729           9,286            7,095           4,605          4,600
Net borrowing, after dilution                                                    7,587           9,256            7,050           4,605          4,600
Investments, including financial leases                                          2,581           1,485              774           1,475          1,941


Key figures:


Solidity, %                                                                          61              60              63              46                 29
Solidity, after dilution, %                                                          61              60              63              46                 29
Debt/equity ratio                                                                 0.27             0.31            0.27            0.69            1.57
EBITDA margin %                                                                   16.4              6.8            14.6            25.2            19.7
EBIT margin %                                                                       4.9            –5.4             3.4            14.1                8.6
Return on shareholders equity, %                                                    0.8             1.4            –2.4            78.6                1.8
Return on shareholders equity, after dilution, %                                    0.8             1.4            –2.4            78.6                1.8
Return on capital employed, %                                                       3.9            –3.3             1.9            45.2                6.8
Average interest expense, %                                                         6.4             6.3             4.8              4.8               6.6
Average interest expense, after dilution, %                                         6.4             6.3             4.8              4.8               6.6


Value per share, SEK:


Profit/loss after tax                                                             1.51             2.70           –3.47           36.28            0.51
Profit/loss after tax, after dilution                                             1.51             2.70           –3.47           36.28            0.51
Shareholders’ equity                                                            194.95          203.56          232.62            64.12          28.24
Shareholders’ equity, after dilution                                            195.55          203.46          232.74            64.12          28.17
Cash flow                                                                        29.62             2.85            7.74           16.88            9.38
Cash flow, after dilution                                                        29.56             2.85            7.73           16.88            9.35
Dividend                                                                             —               —                —                  —              —
Share price on closing date                                                     230.50          378.00          392.00          598.00          330.00


*     Operating revenue for 2002, include SEK 237 million, relating to a court case against Telia, which, for reasons of prudence was not previously
      reported as income. During 2002, Tele2 Norway returned its UMTS license, whereby the net book value of capitalized costs was eliminated in its
      entirety and was charged against depreciation for the year in an amount of SEK –400 million. EBT for 2002 was affected by a write-down of SEK 86
      million, attributable to shares in XSource Corporation, which is under the item ”Interest expense and other financial expenses”.
** Net profit/loss for 2000 was affected by the acquisition of SEC Group on October 2, 2000.
***EBT for 1999 was affected by a non-recurring item of SEK 3,228 million, attributable to a capital gain on the acquisition of the associated company
     NetCom ASA.


                                                                                                                                                         33
Tele2 Sweden has more than 3 million       monthly average revenue per user (ARPU)        Eastern Europe and Russia
mobile telephony customers, reflecting        in mobile telephony, including cash cards,     Operatng revenue, 2002: SEK 2,320 mil-
growth during 2002 when Tele2 expanded        amounted to SEK 196 (2001: SEK 204)            lion (2001: SEK 1,148 million), +102%.
faster than its two primary competitors,      in 2002. Meanwhile, the monthly minutes        EBITDA, 2002: 541 million (2001: 272),
attaining a market share of more than 50%     per user and month (MoU) in 2002               +99%.
of the total number of new customers.         amounted to 103 (2001: 107). Prepaid             Eastern Europe and Russia comprises
   Tele2 Sweden finalized the financing of    customers accounted for 72% of the total       Tele2’s operations in the Baltic States,
Svenska UMTS nät AB – the Swedish             customer base in mobile telephony. Fixed       (Estonia Latvia and Lithuania) Poland,
UMTS network company that is equally          telephony and Internet had 1.9 million         Czech Republic and Russia as well as
and jointly owned with Telia. Tele2 and       customers at year-end.                         XSource operations.
Telia announced that a bank credit of SEK        Operations in Denmark, Finland and            In the Baltic States, Tele2’s services are
11 billion had been signed to finance the     Norway are primarily involve fixed teleph-     experiencing robust customer growth,
expansion of the UMTS network in              ony and Internet. Competitive pressure         which is primarily driven by mobile tel-
Sweden.                                       continues to decline in these countries.       ephony and especially prepaid customers.
                                              Moreover, costs have fallen as a result of a   In Latvia, Tele2 acquired one of two UMTS
Nordic                                        10% reduction in the workforce in              licenses in 2002. In January 2003, the
Operating revenue, 2002: SEK 13,566           Denmark and 20% in Norway, among other         market for fixed telephony in Latvia was
million (2001: SEK 11,898 million),           factors.                                       opened to competition and Tele2 expects
+14%. EBITDA, 2002: SEK 4,814 million            During the third quarter, Tele2 signed      to launch fixed telephony services there
(2001: SEK 3,768 million), +28%.              an MVNO agreement for UMTS with                during the next six months.         Customer
   The Nordic market area comprises           Telenor in Norway in exchange for Telenor      intake in the Czech Republic was high and
Tele2 operations in Sweden, Norway, Den-      gaining access to Tele2’s UMTS network in      Tele2 will introduce local pre-selection
mark and Finland, as well as Datametrix.      Sweden. Tele2’s Norwegian MVNO will be         during 2003. Meanwhile, in Poland, Tele2
As of January 1, 2002, Optimal Telecom        launched during the first quarter of 2002.     will launch fixed telephony during the first
is included in the Nordic Market Area. It     The advantage for Tele2 is reduced invest-     quarter of 2003, following deregulation of
was previously included in Branded            ment costs of some SEK 5 billion for UMTS      international calls on January 1.
Products & Services.                          in Norway. The decision to return the
   Tele2 has reached agreement with Telia     UMTS license in Norway to the Norwegian        Central Europe
in Sweden, Telenor in Norway and TDC in       authorities meant that Tele2 conducted a       Operating revenue, 2002: SEK 5,689 mil-
Denmark on the terms and conditions for       write-down of SEK 399 million during the       lion (2001: SEK 4,844) million, +17%.
offering ADSL services, and Tele2 will        fourth quarter. Margins in Norway and          EBITDA, 2002: SEK –81 million (2001:
launch these services during the summer.      Denmark have improved and in Denmark a         SEK –606 million), of which SEK 105
   Tele2 Sweden is the largest operation in   review of switched traffic fees means that     (2001: SEK –585 million) related to fixed
the Nordic market area. During 2002, suc-     these will be reduced by the equivalent of     telephony and Internet.
cessful marketing campaigns for both fixed    DEK 20 million annually. Denmark is the          Central Europe comprises Tele’s opera-
and mobile telephony led to larger market     last country to start applying the Group’s     tions in Germany, Netherlands, Switzer-
shares. During 2002, Telia 2 Sweden           definition of active customers. This result-   land and Austria, as well as a license in
retained its high margins, with an EBITDA     ed in a one-off reduction in the number of     Ireland.
margin of 55% for fixed telephony and         customer by 461,000 as a result of the           Central Europe displayed robust growth
22% for fixed telephony and Internet.         data-processing system in Denmark being        in revenue and EBITDA during the year,
Mobile telephony operations in Sweden         upgraded to the same standard as the rest      with EBITDA for fixed telephony at a pos-
reported 3 million customers, a rise of       of the Group. Accordingly, all companies       itive level throughout the year. The market
19% on an annual basis. Comviq increased      within Tele2 apply the same definition of      area’s ARPU was SEK 153 (2001: SEK
its share of new sales on the market. The     active customer.                               148) for 2002.


34 T E L E 2 A N N U A L R E P O R T   2002
Tele2 is the third largest alternative       expects to launch an MNVO in early 2003.           2002. The improvements were achieved at
operator in Germany in fixed telephony and         In Switzerland, Tele2 is now the second         minimal cost.
one of the fastest growing operators nation-    largest alternative operator and has signed          Tele2 France continued its high growth
wide. During 2002, recognition of Tele2         agreements with a large number of cus-             and has consolidated its position as the
increased dramatically and it is now the        tomers for pre-selection by using what is          leading alternative operator. Tele2 Italy is
third best known brand in the country in        referred to as Third Party Verification.           the second largest alternative operator,
fixed telephony, just behind number two,        During 2002, Tele2 broadened its offering          and continues to report strong customer
Arcor. Tele2 simplified its price structure     in Switzerland through the launch of               intake and is adding new services, such as
and had considerable success with its mar-      mobile telephony services in May, Tele2            the recently launched Internet services. In
keting, which focuses on comparisons with       Voice box in April and Internet ADSL in            Spain, Tele2 introduced local pre-selec-
competitor prices. During the fourth quarter,   November.                                          tion in June, which has increased call traf-
operating revenue increased and EBITDA                                                             fic considerably. Using Spain as a base,
strengthened. However, as a market,             Southern Europe                                    Tele2 will launch fixed telephony services
Germany has fallen behind the rest of           Operating revenue, 2002: SEK 8,105 mil-            in Portugal during 2003.
Europe, notably in the area of local pre-       lion (2001: SEK 5,124 million), +58%.
select, which are not deregulated there-        EBITDA, 2002: SEK –101 million (2001:              Luxembourg
by benefiting the former monopoly.              SEK –1,331 million).                               Operating revenue, 2002: SEK 754 mil-
Coordinated lobbying at the EU level has           Southern Europe comprises Tele2’s               lion (2001: SEK 663 million), +14%.
had an effect and Germany will start to         operations in France, Italy, Spain and             EBITDA, 2002: SEK 126 million (2001:
deregulate during 2003, thus suggesting         Portugal.                                          SEK 5 million).
that the Central Europe market area can            Southern Europe continued to report               The Luxembourg market area compris-
expect to gain the same benefits from local     sharp growth in operating revenue, which           es Tele2 operations in Liechtenstein and
pre-selection during the second half of         rose 58% in 2002, and a highly significant         Luxembourg, the newly launched opera-
2003 as experienced by Southern Europe          improvement in EBITDA. The EBITDA-                 tions in Belgium, 3C’s operations and
during 2002.                                    trend was robust during 2002, notably dur-         Transac.
   In the Netherlands, Tele2 is the second      ing the fourth quarter, when it reached              Tango is the largest mobile operator in
largest alternative operator and Tele2 has      SEK 156 million, which reflects good               Luxembourg. Tele2 has received a UMTS
a brand recognition rate of 80% of the popu-    results in both Italy and France, and lower        license and recently launched MMS ser-
lation. Tele2 launched an MVNO during           marketing costs in the market area as a            vices. TANGO TV, combined with the Tango
the first half of 2002, which enjoyed           whole. Tele2 has begun to launch services          Sunshine radio station, permits access to
strong growth during the second half of the     in Portugal, which will be launched in their       a young target group and also represents
year and is now the sixth largest mobile        entirety during early 2003. Tele2 attained         the first step towards interactivity between
operator nationwide. Tele2 attained its tar-    a good ARPU of SEK 149 (2001: 129) in              media and mobile telephony, which will act
get of converting 10% of the customer           Southern Europe in 2002.                           as a driving force for SMS and MMS traf-
base in fixed telephony during the first year      Tele2 offers a complete product port-           fic. Tele2 launched fixed telephony in
of operations. These mobile customers           folio with local, nationwide and interna-          Belgium on January 15, 2003.
have been gained at a low cost.                 tional calls as well as calls for the fixed net-
   Tele2 Austria is the country’s second        work to mobile networks and has recently           Branded products & services
largest alternative operator and experi-        added Internet services. Local pre-selec-          Operating revenue, 2002: SEK 848 mil-
enced sharp growth during 2002, with a          tion has been available for all customers in       lion (2001: SEK 1,408 million).
brand recognition rate of 85% of the popu-      France, Italy and Spain, which has had a           EBITDA, 2002: SEK –172 million (2001:
lation. The low customer turnover reflects      very positive impact on call volumes, oper-        SEK –410 million).
considerable customer satisfaction. Tele2       ating revenue and customer turnover in


                                                                                                                                            35
Other trademarks comprise Tele UK, an       the Board’s work. Matters placed before
operation launched in the UK in coopera-       the Board are dealt with by the entire
tion with The Post Office, C3 operations,      Board. In 2002, Tele2’s Board of Directors
Everyday operations and IntelliNet opera-      held eleven meetings at which minutes
tions.                                         were taken. Specific instructions govern-
                                               ing the President’s responsibilities and
Significant events after the end               authority were adopted. Each year, the
of the financial year                          company’s auditors report to the Board the
In February 2003 Tele2 Alpha Telecom           result of their examination and provide
was acquired. This is the UK’s leading         their assessment of internal control.
operator in prepaid fixed network teleph-
ony for individuals and a market leader in     Parent Company
cash cards for fixed telephony. Tele2 Alpha    The Parent Company performs functions
Telecom, sells about 1.25 million cash         and conducts certain development pro-
cards per month from 60,000 sales outlets      jects common to the Group.
in the UK and has sales of SEK 1.9 billion.      A convertible debenture was converted
The acquisition will directly contribute to    to 100,000 B-shares on December 31,
Tele2’s earnings per share in 2003, even       2002, which affected shareholders’ equi-
without the expected synergy effects. The      ty by SEK 15 million. The Parent Company
acquisition price amounted to approxi-         gave a shareholder contribution to sub-
mately SEK 780 million, on a debt-free         sidiaries in the amount of SEK 400 million
basis.                                         and received Group contributions totaling
   The acquisition of Alpha Telecom is a       SEK 3,035 million.
unique opportunity for Tele2 to attain crit-
ical mass in the UK and is line with Tele2’s   Proposed appropriation of profit
strategy of steadily establishing a presence   The   Group’s    non-restricted    reserves
in the UK market. Alpha is a stable base       amount to SEK 3,590 million. No alloca-
on which to further develop Tele2’s opera-     tion to restricted reserves is proposed for
tions in the UK. The objective is to emu-      companies within the Group.
late Alpha’s successful product concept in       The Board of Directors and President
other significant markets in Europe, in        propose that the amount at the disposal of
which Tele2’s current presence will con-       the   Annual    General   Meeting,      SEK
tribute major revenue and cost synergies.      2,253,624,328, be carried forward to a
                                               new account.
Work of the Board of Directors
It was with great sorrow that the Board of
Directors of Tele2 AB announced the death
of Board Chairman Jan Hugo Stenbeck at
the age of 59. Bruce Grant was appointed
Board Chairman on August 22.
   The work of the Board of Directors fol-
lows an annual plan, designed to secure
the Board’s need for information and in
other respects is affected by the specific
work procedure that has been adopted for


36 T E L E 2 A N N U A L R E P O R T   2002
Income Statement
                                                                  Group              Parent Company
 SEK million                                    Note          2002           2001    2002             2001


Operating revenue                                  1        31,282         25,085     16                12


Cost of services sold                                       –19,890       –17,715      —                 —


Gross profit                                                11,392          7,370      16               12


Selling expenses                                             –7,279        –6,652      —                 —
Administrative expenses                           39         –2,571        –2,188    –101              –73
Other operating revenues                           3            50            189      12                4
Other operating expenses                           4           –62            –75      —                 —


Operating profit/loss                           2, 38         1,530        –1,356     –73              –57


Profit/loss on associated companies:
Result from shares in associated companies         5           –41            –58      —                 —
Sale of associated companies                       6             5             91      —                 —


Profit/loss on financial investments:
Result from shares in Group companies              7                                   —        –13,964
Result from other securities and receivables
  classed as fixed assets                          8           –84              4     182               64
Other interest revenue and similar income          9           165             65      —                14
Interest expenses and similar costs               10          –779           –690      –5              –15


Profit/loss after financial items                              796          –1,944    104       –13,958


Tax on profit for the year                        11          –574          2,335     –35             3,076
Minority interest                                                1              1


Profit/loss for the year                       33–34           223            392      69       –10,882


Earnings/loss per share                           25       SEK 1.51       SEK 2.70
Earnings/loss per share after full dilution       25       SEK 1.51       SEK 2.70


Number of shares                                  25    147,460,175   147,360,175
Average number of shares                          25    147,360,175   145,003,847
Number of shares after dilution                   25    148,223,175   147,560,175
Average number of shares after dilution           25    147,634,293   145,223,466


                                                                                                          37
Balance Sheet
                                                                  Group                       Parent Company
 SEK million                                   Note   Dec. 31, 2002   Dec. 31, 2001   Dec. 31, 2002   Dec. 31, 2001


ASSETS
Fixed assets
Intangible assets
Licenses and right of use                       12             509             736               —                —
Goodwill                                        12          24,587          27,033               —                —
Total intangible assets                                     25,096          27,769               —                —


Tangible assets
Buildings and land                              13             115             124               —                —
Machinery and other technical plant             13           8,334           8,270               —                —
Equipment, tools and installations              13             575             687               —                —
Fixed plant under construction                  13             233             350               —                —
Total tangible assets                                        9,257           9,431               —                —


Financial fixed assets
Shares in Group companies                       14                                           2,686             1,987
Receivables from Group companies                15                                          15,353          12,526
Shares in associated companies                  16             542             326               —                —
Receivables from associated companies           17              19             115              19              115
Other long-term holdings of securities          18             139             202              28                5
Other long-term receivables                     19              74              85               —                —
Deferred tax receivable                         11           1,246           1,764           1,771             2,656
Total financial fixed assets                                 2,020           2,492          19,857          17,289
Total fixed assets                                          36,373          39,692          19,857          17,289


Current asset
Materials and supplies                                         353             362               —                —


Current receivables
Accounts receivable                             20           4,373           3,624               —                —
Current tax receivables                                          1               6               —                —
Receivables from Group companies                                                                 7                2
Other receivables                               21             250             530               —                2
Prepaid expenses and accrued revenues           22           3,049           2,769               1                1
Total current receivables                                    7,673           6,929               8                5


Cash and bank balances                          23           2,473           2,275              10                8
Total current assets                                        10,499           9,566              18               13


Total assets                                  33–34         46,872          49,258          19,875          17,302


38 T E L E 2 A N N U A L R E P O R T   2002
Group                       Parent Company
 SEK million                                        Note   Dec. 31, 2002   Dec. 31, 2001   Dec. 31, 2002   Dec. 31, 2001


EQUITY AND LIABILITIES
Shareholders’ equity                                 24
Restricted equity
Share capital                                        25             737             737             737              737
Restricted reserves                                              24,401          35,741          16,562          23,935
Total restricted equity                                          25,138          36,478          17,299          24,672


Non-restricted reserves/accumulated losses
Non-restricted reserves/accumulated losses                        3,367          –7,353           2,185             3,495
Profit/loss of the year                                             223             392              69         –10,882
Total non-restricted reserves/accumulated losses                  3,590          –6,961           2,254          –7,387


Total shareholders’ equity                                       28,728          29,517          19,553          17,285


Minority interest                                                    22              28


Provisions
Shares in associated companies                       16              28             102              —                 —
Total provisions                                                     28             102              —                 —


Long-term liabilities
Interest-bearing
Liabilities to financial institutions                26           7,876          10,843              —                 —
Liabilities to Group companies                                                                      303                —
Bank overdraft facility                              23              —               14              —                 —
Other liabilities                                    27              23             115              —                 —
Total interest-bearing liabilities                                7,899          10,972             303                —


Non-interest-bearing
Other liabilities                                                    —                8              —                 —
Total non-interest-bearing liabilities                               —                8              —                 —


Total long-term liabilities                                       7,899          10,980             303                —


Current liabilities
Interest-bearing
Liabilities to financial institutions                26           2,377             731              —                 —
Other liabilities                                    27               5             151              —                 —
Total interest-bearing                                            2,382             882              —                 —


Non-interest bearing
Accounts payable                                                  3,542           3,344               6               10
Current tax liabilities                                              57              16              —                 —
Other liabilities                                    28             441             375               5                —
Accrued expenses and prepaid revenues                29           3,773           4,014               8                7
Total non-interest bearing liabilities                            7,813           7,749              19               17


Total current liabilities                                        10,195           8,631              19               17


Total shareholders’ equity and liabilities         33–34         46,872          49,258          19,875          17,302


PLEDGED ASSETS AND CONTINGENT LIABILITIES
Pledged assets                                       30          23,678          24,139            None             None
Contingent liabilities                               31            None            None          12,825          15,133

                                                                                                                        39
Cash Flow Statement
                                                                                 Group            Parent Company
 SEK million                                                         Note    2002         2001    2002              2001
Operating activities
Operating profit/loss                                                       1,530        –1,356     –73              –57
Adjustments ofincome/expense items that do not
generate cash flow from operating activities:
  Depreciation and amortization                                             3,597         3,054      —                 —
  Capital losses/gains on sale of machinery, other technical plant              9           40       —                 —
  Financial leases                                                            –20          –14       —                 —
Exchange rate differences                                                      63            —       —                 —
Interest received                                                             157           54        2                4
Interest paid                                                                –619         –569       —               –14
Financial expenses paid                                                      –104          –55       —                –1
Tax paid/refund                                                               –49            7       —                 —
                                                                            4,564         1,161     –71              –68
Change in working capital:
  Materials and supplies                                                      –12          –66       —                 —
  Accounts receivable                                                        –815         –837       —                 —
  Other current receivables                                                   167          –69        2               –2
  Prepaid expenses and accrued revenues                                      –185         –851       —                 —
  Intra-Group transactions, current                                                                  –4               –2
  Accounts payable                                                            236          566       –4                3
  Other current liabilities                                                   123          112        3                —
  Accrued expenses and prepaid revenues                                       287          397        1               –1
                                                                             –199         –748       –2               –2
Cash flow provided by operating activities                                  4,365          413      –73              –70


Investing activities
Acquisition of intangible fixed assets                                       –208          –17       —                 —
Acquisition of tangible fixed assets                                        –1,699       –2,167       1                —
Sale of tangible fixed assets                                                  17           38       —                 1
Acquisition of shares in Group companies, exc. Cash                   14     –346          831    –299               –36
Acquisition of other long-term securities                                    –317         –334      –23              –75
Sale of other long-term securities                                             40          236       —                 —
Lending to Group companies                                                                        –128               –52
Payment received from Group companies                                                              414               313
Other long-term lending                                                       –12         –103       –7              –71
Payment received from other long-term lending                                   9           49     102                 —
Cash flow from investing activities                                   32    –2,516       –1,467      60               80


Financing activities
Raising of loans from credit institutions                                     528        12,139      —             1,285
Amortization of loans from credit institutions                              –1,744       –9,861      —             –1,306
Raising of other interest-bearing liabilities                                  12          342       —               203
Amortization of other interest-bearing liabilities                           –209         –842       —              –206
New share issue                                                                15           15       15               15
Cash flow from financing activities                                         –1,398        1,793      15               –9


Net change in cash                                                            451          739        2                1


Liquid funds at beginning of year                                     23    2,275         1,511       8                7
Exchange-rate differences in liquid funds                             23     –253           25       —                 —
Liquid funds at end of year*                                          23    2,473         2,275      10                8


*of which, blocked accounts                                           23      870          897       —                 —
For additional cash flow information, refer to:                       32


40 T E L E 2 A N N U A L R E P O R T   2002
Change in Shareholders’ Equity
                                                                                                      Group
                                                               Note        Share         Restricted        Unrestricted      Total share-
 SEK million                                                               capital        reserves          reserves         hold.’ equity
Closing shareholders’ equity, Dec. 31, 2000                                 724           25,098                 717           26,539
Items reported directly against shareholders’ equity
Gradual acquisitions                                                          —                 —                –12               –12
Exchange-rate difference                                     Note 24          —             1,844               –110            1,734
Total items reported directly against shareholders’ equity                    —             1,844               –122            1,722


Other changes in shareholders’ equity
New share issue, acquisition of Tele2 Russia                                  12              837                  —               849
New share issue                                                                1                14                 —                15
Transfers within shareholders’ equity                                         —             7,948              –7,948                —
Net profit/loss for the year                                                  —                 —                392               392
Closing shareholders’ equity, Dec. 31, 2001                                 737           35,741               –6 961          29,517


Closing shareholders’ equity, Dec. 31, 2001                                 737           35,741               –6,961          29,517
Items reported directly against shareholders’ equity
Exchange-rate difference                                     Note 24          —            –4,189               3,163          –1,026
Total items reported directly against shareholders’ equity                    —            –4,189               3,163          –1,026


Other changes in shareholders’ equity
New share issue                                                               —                 14                 —                14
Utilization of share premium reserve                                          —            –7,387               7,387                —
Transfers within shareholders’ equity                                         —               222               –222                 —
Net profit/loss for the year                                                  —                 —                223               223
Closing shareholders’ equity, Dec. 31, 2002                                 737           24,401                3,590          28,728

                                                                                                Parent Company
                                                                       Restricted shareholders’ equity Unrestricted equity      Total
                                                                       Share capital   Share premium         Profit/loss sharehold. equity
 SEK million                                                                              reserve         brought forward
Closing shareholders’ equity, Dec. 31, 2000                                 724           23,083                1,983          25,790
Items reported directly against shareholders’ equity
Group contribution, received                                                  —                 —               2,100           2,100
Group contribution, tax effect                                                —                 —               –588             –588
Rounding off                                                                  —                  1                 —                    1
Total items reported directly against shareholders’ equity                    —                  1              1,512           1,513


Other changes in shareholders’ equity
New share issue, acquisition of Tele2 Russia                                  12              837                  —               849
New share issue                                                                1                14                 —                15
Net profit/loss for the year                                                  —                 —             –10,882         –10,882
Closing shareholders’ equity, Dec. 31, 2001                                 737           23,935               –7,387          17,285


Closing shareholders’ equity, Dec. 31, 2001                                 737           23,935               –7,387          17,285
Items reported directly against shareholders’ equity
Group contribution, received                                                  —                 —               3,035           3,035
Group contribution, tax effect                                                —                 —               –850             –850
Total items reported directly against shareholders’ equity                    —                 —               2,185           2,185


Other changes in shareholders’ equity
New share issue                                                               —                 14                 —                14
Utilization of share premium reserve                                          —            –7,387               7,387                —
Profit/loss for the year                                                      —                 —                 69                69
Closing shareholders’ equity, Dec. 31, 2002                                 737           16,562                2,254          19,553


                                                                                                                                        41
Notes
(SEK million)


 General accounting principles
The annual report has been prepared in accordance with the Annual           Tele2’s management conducts continual appraisals to confirm
Accounts Act and recommendations of the Swedish Financial                   these assumptions remain reasonable.
Accounting Standards Council’s Emerging Issues Task Forece and           • Tele2’s management continually makes assessments of the sus-
the Swedish Financial Accounting Standards Council’s recommen-              tained value of intangible and tangible fixed assets. If manage-
dations RR1: 00-RR28, of which RR2:02, RR22 and RR24-RR28                   ment identifies factors that entail a risk of reduced value of the
were applied before they came into force.                                   particular asset, a revaluation of the asset is conducted by com-
   In 2002, Tele2 modified its accounting principles to conform to          paring the sum of the future discounted cash flow with the
recommendations RR2:02-Materials and Supplies, RR22-Layout                  asset’s book value. In cases in which the book value exceeds the
of Financial Reports, RR23-Information on Related Parties, RR24-            future discounted cash flow, a write-down requirement emerges.
Managed Properties, RR25-Reporting for segments -operating                  The appraisal that concludes that there are factors indicating
areas and geographical areas, RR26- Events after the Closing Date,          that an asset is exposed to a decline in value; the assessment
RR27-Financial Instruments: Information and Classification, and             of future cash flow, including discounting factors; and the final
RR28-State support.                                                         decision regarding the real value of the asset, entail a require-
   The new recommendations have no significant impact on Tele2’s            ment for management to conduct essential estimates and
financial reporting. Effective 2003, Tele2 has begun to apply RR29          approximations. (Note 12–13).
Employee Benefits, which means that defined-benefit pension              • The calculation of deferred taxes takes into consideration tem-
plans for all the Group’s subsidiaries are to be reported on the basis      porary differences, including a valuation of unutilized loss carry-
of uniform principles. To date, Tele2 has reported such plans in line       forwards. Deferred tax receivables are reported only for loss
with local rules and stipulations in each country. Since the com-           carry-forwards to the extent that the loss-carry forwards will be
pany has largely had defined-contribution plans (Note 38), the              utilized in the near future. A prudent valuation has been made
introduction of RR29 is not expected to have any material impact            of deferred tax receivables and the company’s management con-
on the Group’s earnings and financial position.                             ducts continual appraisals to confirm that these assessments
   Assets and liabilities in subsidiaries are valued on the basis of        are reasonable. (Note 11).
the accounting principles applied by the Parent Company.                 • Receivables are valued continually and reported in the amounts
                                                                            expect to be paid. Reserves for doubtful receivables are based
Critical accounting principles                                              on various assumptions and historical experience (Note 20).
Assets and liabilities are valued at their acquisition value unless
otherwise stated.                                                        Consolidated accounts
   The consolidated financial reports are, in part, based on account-    The consolidated financial statements include the accounts of the
ing methods, assumptions and estimates in conjunction with the           Parent Company and all companies in which the Parent Company,
drawing up of the consolidated accounts. The estimates and approxi-      directly or indirectly, controls more than 50% of the votes, or in
mations are based on historical experience and a number of other         some other respect has a decisive influence.
assumptions, which result in a decision regarding the value of the          The consolidated accounts were prepared using the purchase
assets or liabilities that cannot be set in any other way. The actual    method, which means that the Parent Company’s purchase cost of
outcome may deviate from these estimates and approximations.             shares in each subsidiary is charged against that subsidiary’s acqui-
   The account below presents the accounting principles applied          sition value, that is, the subsidiary’s shareholders’ equity (includ-
to the most critical estimates and approximations used in drawing        ing the equity component of untaxed reserves) at the time of acqui-
up the Group’s financial reports.                                        sition based on a market appraisal of the subsidiary’s net assets.
• Depreciation according to plan is based on the acquisition value       Consequently, the Group’s shareholders’ equity includes only that
    and estimated utilization period of fixed assets. The utilization    part of each subsidiary’s equity that has been earned after the
    period for machinery and technical plant is estimated to amount      acquisition.
    to between 2–25 years. All depreciation is straight-line over the       The difference between the purchase cost of shares in a sub-
    utilization period (Note 2).                                         sidiary and the market value of that subsidiary’s net assets at the
        Amortization periods for goodwill are set on the basis of each   time of acquisition is allocated to the subsidiary’s identifiable
    acquisition date and the acquisition’s estimated long-term,          assets if the book value is less than the market value. Remaining
    strategic significance. An amortization period of 20 years           amounts are reported as goodwill.
    applies for each corporate acquisitions in new markets. This            The current method is used to translate the accounts of foreign
    means that goodwill arising from all strategic acquisitions in       subsidiaries. Consequently, the exchange rate on the closing date
    recent years (meaning acquisitions in the Baltic States, contin-     is used to translate items in the balance sheet, while items in the
    ental Europe and Russia) is written off over a period of 20 years.   income statement are translated using the average exchange rate
                                                                         for the year.
42 T E L E 2 A N N U A L R E P O R T   2002
All non-Swedish companies in the Tele2 Group are regarded as          Receivables and liabilities of Swedish and non-Swedish sub-
independent foreign operations since they conduct independent           sidiaries denominated in foreign currencies
operations and operations that are pursued with transactions in         Receivables and liabilities of Group companies denominated in for-
local currency, so that exchange rate differences arising from trans-   eign currencies have been translated into Swedish kronor applying
lations are charged directly to shareholders’ equity.                   the year-end rate.
  When an independent foreign operation is divested, the accu-             Gains or losses on foreign exchange in international transactions
mulated exchange-rate differences attributable to the divested          related to regular operations are included in the income statement
operation are reported in “Net assets in Group companies divest-        under “Other operating revenues” and “Other operating expenses”,
ed” in the income statement.                                            respectively, while differences in financial receivables and liabil-
                                                                        ities are reported among financial items. Note 24 summarizes the
Accounting for associated companies and joint ventures                  exchange rate differences charged directly to shareholders’ equity
Companies in which the shareholding is regarded as long term and        and the differences that affected profit/loss for the year.
in which the Group’s voting rights amount to a minimum of 20%              Long-term lending to/borrowing from Tele2’s foreign operations
and a maximum of 50%, or in which the management believes that          is regarded as a permanent part of the Parent Company’s financing
the shareholders have equal control, are treated as associated com-     of/borrowing from foreign operations, and thus as an expansion/
panies. Companies in which the owners have major control pursuant       reduction of the Parent Company’s investment in the independent
to agreement are regarded as joint ventures.                            foreign operation. This lending/ borrowing is translated at the his-
  Associated companies and joint ventures (“associated com-             torical rate of exchange if the borrowing is denominated in the for-
panies”) are reported in accordance with the equity method. This        eign company’s currency.
means that the book value of the shares in the associated company
that is reported in the consolidated financial statements corre-        Fixed assets
sponds to the Group’s share in the equity of the associated com-        Intangible and tangible fixed assets are reported in net form after
pany and any residual value of consolidated surplus values after        deductions for accumulated amortization and depreciation accord-
adjustment to the consolidated accounting principles. Participation     ing to plan. Depreciation/amortization according to plan is based
in earnings after net financial items of the associated company are     on the acquisition value of the assets and the estimated utilization
reported in the income statement in the item “Result from shares        period. Note 2 presents depreciation and amortization schedules
in associated companies” along with amortization of acquired sur-       for fixed assets and reasons for amortizing certain intangible fixed
plus values. The share of associated companies’ tax expense and         assets over utilization period longer than five years.
deferred tax expense/income is reported in the income statement            If there is an indication that a tangible or intangible asset has
in the item “Tax on profit for the year” and in the balance sheet as    declined in value, an estimate is made of its recovery value. If the
“Shares in associated companies”. Earnings accrued in associated        calculated recovery value is less than the reported value, a write-
companies arising after the acquisition date, and which have not        down is made to the asset’s recovery value.
yet materialized through dividends, are allocated to the equity
method reserve, which comprises part of restricted shareholders’        Intangible assets
equity in the Group. The equity share reduces unrestricted share-       License fees and right of use
holders’ equity in the event of losses.                                 The Company holds a number of licenses issued by the Swedish
  In the event of an increase or decrease in the Group’s equity         National Post and Telecom Agency and the equivalent licensing
share in associated companies through share issues, the loss or gain    authority in other countries. Capitalized expenses for these rights
is reported in the consolidated income statement in the item            are amortized over the duration of the contract.
“Result from participations in associated companies”. If the non-
recurring effect is significant, the amount is reported in the item     Goodwill
“Items affecting comparability”.                                        Goodwill is defined as the difference between the purchase cost of
  In the event of negative shareholders’ equity in associated com-      shares or assets acquired and the market value of net assets.
panies and in which the company has pledged to contribute add-
itional capital, the negative portion is reported as a provision.       Tangible assets
  Group surplus values relating to foreign associated companies         Buildings and land
are reported as assets in foreign currencies. These values are trans-   Buildings and land pertain to fixed assets intended for use in actual
lated in accordance with the same principles as the income state-       operations. Buildings are written off straight-line over the utilization
ments and balance sheets for associated companies.                      period. Acquisition value includes direct costs attributable to the
                                                                        building.
Minority interest
The minority share in net profit/loss and shareholders’ equity is
reported as minority interest.
                                                                                                                                            43
Machinery and technical plant                                            Liquid funds
Machinery and technical plant include equipment and machinery            Liquid funds consist of cash and bank balances as well as current
intended for use in operations, such as network installations. The       investments with a maturity of a maximum three months. Liquid
asset is written off on a straight-line basis over the utilization       funds according to the cash flow statement and balance sheet
period. The acquisition value includes direct expenses attributable      include blocked bank accounts.
to the construction and installation of networks. Interest directly
relating to acquisition, construction or production of an asset that     Financial items
necessarily requires considerable time to complete for the intended      Financial items are reported originally at their acquisition value.
application is included in the acquisition value of the asset.           Current financial assets are subsequently reported in line with the
   Additional expenses for extensions and improvements that              lower of cost and market value. Financial items such as cash and
increase value are capitalized, while additional expenses for repairs    bank balances, current investments, receivables and liabilities, pre-
and maintenance are charged continually to income during the period      paid income and current liabilities to financial institutions are
in which they arise.                                                     viewed as corresponding to their real value as they are of a short-
                                                                         term nature. The book value of long-term liabilities to financial insti-
Equipment, tools and installations                                       tutions is also regarded as corresponding to their real value.
Equipment comprises assets used in administration, sales and
operations.                                                              Shareholders’ equity
                                                                         Shareholders’ equity consists of registered share capital, reserves
Proprietary software for internal use                                    that are not available for distribution (statutory reserve, share pre-
Tele2 capitalizes certain direct development costs attributable to       mium reserve and other restricted reserves) and disposable earn-
software for internal use. These are written off over the period of      ings/accumulated losses, net profit/loss and shares in losses of
use, which commences when the asset is ready for application.            associated companies.
Costs attributable to the project phase in the planning stage as well       The share premium reserve pertains to surplus portions when a
as costs for maintenance and training are expensed as they arise.        company’s shares are issued at a price that exceeds the normal
                                                                         value. The equity reserve pertains to positive earnings of associat-
Leasing                                                                  ed companies received after the acquisition date. According to the
Leases are classified as either financial or operating leases. A lease   Swedish Companies Act, a provision must be made each year to the
is considered financial if all economic risks and benefits associated    statutory reserve in a minimum amount corresponding to 10% of
with ownership of the asset have been transferred, to a material         that portion of net profit for the year that is not used to cover
degree, to the lessee; otherwise, the lease is an operating lease. In    retained losses until the statutory reserve and the share premium
the case of financial leases as reported in the consolidated finan-      reserve, combined, correspond to 20% of the share capital.
cial statements, each asset is entered as a tangible fixed asset, and    Restricted reserves in Tele2 and the Swedish Group companies may
a corresponding amount is entered as a loan on the liability side of     be used to increase share capital in order to cover accumulated
the balance sheet. In the income statement, the cost of the lease        losses, under certain conditions. Other restricted reserves pertain
is divided into a depreciation portion and an item in interest           to the equity share of untaxed reserves, deferred tax receivables and
expense. The asset is written off on a straight-line basis over the      a portion of exchange-rate differences.
utilization period.                                                         According to the Swedish Companies Act, Tele2’s disposable
   Agreements covering financial leases before January 1, 1997 have      earnings after the requisite provision to the statutory reserve and
been reported as operational leases in line with a transitional rule.    after covering accumulated losses of previous years are available
                                                                         for distribution to shareholders. The legal limit for distributable
Materials and supplies                                                   funds is represented by rules to the effect that dividends may not
Inventories of materials and supplies are valued in line with the        threaten the company’s liquidity or overall position or exceed unre-
first-in, first-out principle at the lower of purchase cost and market   stricted shareholders’ equity in the Group. The dividend is deter-
value.                                                                   mined by shareholders at the Annual General Meeting and, gener-
                                                                         ally, may not exceed the dividend proposed by the Board.
Receivables
Receivables are reported in the amounts expected to be paid.


44 T E L E 2 A N N U A L R E P O R T   2002
Revenue recognition                                                           Transactions with related parties
Sales are reported net of VAT, discounts and exchange rate differ-            Transactions with related parties are shown in Note 35.
ences for sales in foreign currency. Revenue from telephony, cable
TV and other services and products is recognized at the time the              US accounting principles (US GAAP)
service/product is supplied to the customer.                                  The Group’s balance sheet and income statement were drawn up
                                                                              in accordance with Swedish accounting principles. These diverge
Marketing expenses                                                            to a certain extent from US accounting principles (US GAAP). Note
Expenditure for advertising and other marketing activities is                 40 shows the adjustments necessary to report in accordance with
charged on an ongoing basis.                                                  US-GAAP.


Corporate income tax                                                          Other information
Consolidated profit or loss for the year is charged with the tax on           Tele2 AB is a limited liability company domiciled in Stockholm,
taxable income for the year (“Current tax”) and with estimated tax            Sweden. The company’s head office (phone +46 8 5620 0060) is
charges or credits for temporary differences (“Deferred tax”). A tem-         located at Skeppsbron 18, Box 2094, 103 13 Stockholm, Sweden.
porary difference is a provision to appropriations made by an indi-              The balance sheets and income statements will be approved at
vidual company or any other item that merely alters the time when             the Annual General Meeting on May 15, 2003.
an item is considered taxable or entitling the company to a deduction.
   The calculation of deferred tax receivables in the Group takes
into account the Group’s loss carry-forwards to the extent that it is
expected they can be used in the foreseeable future. Deferred tax
receivables and deferred tax liabilities are netted only among units
with the same domicile for tax purposes.
   The tax effects of Group contributions paid and received are
reported in the individual companies as a tax expense or tax rev-
enue in the income statement (“Current tax”) and charged to
retained losses or earnings.


Earnings per share
Earnings per share after dilution is calculated according to a
method in which the present value of the exercise price of the option
is assumed to be used to acquire shares at the average market value
during the accounting period. If the result for the year is negative,
this does not affect the calculation, since the dilution may not
reduce the loss per share.


 Note 1      Operating revenue

Intra-group sales include sales to companies in the Tele2 Group. Intra-Group sales in each market area and additional information concerning the
segments are shown in Note 33, Market areas and Note 34, Operating areas. Sales of telephones are included in operating revenue in the amount of
SEK 453 million (2001: SEK 306 million). The number of customers per market area and business area is shown in Note 36.
   Optimal Telecom, which was previously reported in the Branded products & services market area, is included in the concept “Tele2 Sweden” as
of January 1, 2002 and in the Nordic market area. Operating revenue for Optimal Telecom amounted to SEK 450 million in 2001.
   During the first quarter of 2002, Tele2 won a case in the County Administrative Court against Telia regar-ding the principles of payment for joint
traffic charges, which means that Telia is responsible for paying SEK 350 million for switched traffic transited via its network (Cascade Accounting).
As a result, operating revenue was positively affected in the amount of SEK 237 million in 2002 for traffic attributable to earlier periods.
   The entire operating revenue of the Parent Company pertains to sales to other Group companies.


                                                                                                                                                  45
Cont. note 1

Operating area by market area:
                                                                        Group
                                                                   Operating revenue
                                                           2002         2001           Change
Nordic:
Mobile telephony                                           7,109       6,029             18%
Fixed telephony and Internet                               6,637       5,886             13%
Cable-TV                                                     270         171             58%
Data processing                                              214         280            –24%
Intra-Group sales                                           –664        –468             42%
Total, Nordic                                             13,566      11,898             14%
   of which, Tele 2 in Sweden;         Mobile telephony    6,611       5,720             16%
   of which, Tele 2 in Sweden:         Fixed telephony     3,877       3,183             22%
   of which, Tele 2 in Sweden:         Cable TV              253         157             61%
   of which, Tele 2 in Sweden;         Total              10,741       9,060             19%

Eastern Europe and Russia:
Mobile telephony                                           2,068        1,094           89%
Fixed telephony and Internet                                 198           34          482%
Cable-TV                                                      26           —              —
Data processing                                               77           53           45%
Intra-Group sales                                            –49          –33           48%
Total, Eastern Europe and Russia                           2,320        1,148          102%

Central Europe:
Mobile telephony                                             145           25          480%
Fixed telephony and Internet                               5,922        5,339           11%
Intra-Group sales                                           –378         –520          –27%
Total, Central Europe                                      5,689        4,844           17%

Southern Europe:
Fixed telephony and Internet                               8,415        5,591            51%
Intra-Group sales                                           –310         –467           –34%
Total, Southern Europe                                     8,105        5,124            58%

Luxembourg:
Mobile telephony                                            535          471             14%
Fixed telephony and Internet                                209          211             –1%
Cable-TV                                                      2           —                —
Data processing                                             124          104             19%
Intra-Group sales                                          –116         –123             –6%
Total, Luxembourg                                           754          663             14%

Branded products & services:
Mobile telephony                                              —            17              —
Fixed telephony and Internet                               1,004        1,559           –36%
Intra-Group sales                                           –156         –168            –7%
Total, Branded products & services:                          848        1,408           –40%

Total by market                                           31,282      25,085             25%

                                                                        Group
                                                                   Operating revenue
                                                          2002           2001           Change

Mobile telephony                                           9,857       7,636             29%
Fixed telephony and Internet                              22,385      18,620             20%
Cable TV                                                     298         171             74%
Data processing                                              415         437             –5%
Intra-Group sales                                         –1,673      –1,779             –6%
Total by operating area                                   31,282      25,085             25%


46 T E L E 2 A N N U A L R E P O R T   2002
Note 2         Depreciation/amortization for the year and operating profit
Operating area by market:
                                                                                               Group
                                                                  EBITDA*              Depreciation/amortizat.                     EBIT**
                                                                2002           2001       2002            2001    2002         2001
Nordic:
Mobile telephony                                               3,576          2,917        –791           –354   2,785         2,563
Fixed telephony and Internet                                   1,187            847        –466           –484     721           363
Cable-TV                                                          41            –11         –73            –72     –32           –83
Data processing                                                   10             15          –5             –3       5            12
Total, Nordic                                                  4,814          3,768      –1,335           –913   3,479         2,855
   of which, Tele 2 in Sweden, Mobile telephony                3,646          3,111        –388           –352   3,258         2,759
  of which, Tele 2 in Sweden, Fixed telephony                    870            675        –347           –351     523           324
   of which, Tele 2 in Sweden, Cable TV                           41            –13         –70            –70     –29           –83
   of which, Tele 2 in Sweden, Total                           4,557          3,773        –805           –773   3,752         3,000

Eastern Europe and Russia:
Mobile telephony                                                 611            320        –339           –244     272               76
Fixed telephony and Internet                                     –76            –56         –29            –23    –105              –79
Cable-TV                                                          –1             —          –12             —      –13               —
Data processing                                                    7              8         –10            –11      –3               –3
Total, Eastern Europe and Russia                                 541            272        –390           –278     151               –6

Central Europe:
Mobile telephony                                                –186            –21         –17             –3    –203              –24
Fixed telephony and Internet                                     105           –585        –116            –98     –11             –683
Total, Central Europe                                            –81           –606        –133           –101    –214             –707

Southern Europe:
Fixed telephony and Internet                                    –101          –1,331       –129            –96    –230        –1,427
Total, Southern Europe                                          –101          –1,331       –129            –96    –230        –1,427

Luxembourg:
Mobile telephony                                                 161            101         –65            –65      96               36
Fixed telephony and Internet                                       6            –61         –18            –48     –12             –109
Cable-TV                                                         –29             —           –5             —      –34               —
Data processing                                                  –12            –35          –4             –5     –16              –40
Total, Luxembourg                                                126              5         –92           –118      34             –113

Branded products & services:
Mobile telephony                                                  —             –22          —              —       —               –22
Fixed telephony and Internet                                    –172           –388         –12            –36    –184             –424
Total, Branded products & sevices                               –172           –410         –12            –36    –184             –446

Group depreciation/amortization                                                          –1,506         –1,512   –1,506       –1,512
Total by market                                                5,127          1,698      –3,597         –3,054    1,530       –1,356

                                                                                               Group
                                                                   EBITDA*             Depreciation/amortizat.            EBIT**
                                                                2002            2001       2002          2001      2002         2001
Mobile telephony                                               4,162           3,295     –1,212           –666    2,950        2,629
Fixed telephony and Internet                                     949          –1,574       –770           –785      179       –2,359
Cable-TV                                                          11             –11        –90            –72      –79          –83
Data processing                                                    5             –12        –19            –19      –14          –31
Group depreciation/amortization                                                          –1,506         –1,512   –1,506       –1,512
Total per operating area                                       5,127          1,698      –3,597         –3,054    1,530       –1,356

* EBITDA = Operating profit before depreciation/amortization
** EBIT = Operating profit after depreciation/amortization


                                                                                                                                       47
Cont. note 2
                                                                                                                    Group
                                                                                              EBITDA-margin                     EBIT-margin
                                                                                              2002            2001            2002            2001

Nordic                                                                                         35%             32%             26%             24%
  of which,    Tele   2   in   Sweden,   Mobile telephony                                      55%             54%             49%             48%
  of which,    Tele   2   in   Sweden,   Fixed telephony                                       22%             21%             13%             10%
  of which,    Tele   2   in   Sweden,   Cable-TV                                              16%             –8%            –11%            –53%
  of which,    Tele   2   in   Sweden,   Total                                                 42%             42%             35%             33%

Eastern Europe & Russia                                                                        23%             24%              7%             –1%
Central Europe                                                                                 –1%            –13%             –4%            –15%
Southern Europe                                                                                –1%            –26%             –3%            –28%
Luxembourg                                                                                     17%              1%              5%            –17%
Branded products & services                                                                   –20%            –29%            –22%            –32%
Total per operating area                                                                       16%              7%              5%             –5%

The profit gauges above do not include internal sales to other companies in the Tele2 Group. Profit/loss including internal sales, depreciation by seg-
ment (with the exception of goodwill for the acquisition of SEC) and additional information on segments is shown in Note 33, Market areas and Note
34, Operating areas. Sales of telephones are included in operating expenses for the year in the amount of SEK –573 million (2001: SEK –543 million).
   Optimal Telecom, which was previously reported in the Branded products * market area is included in the Nordic market area as of January, 2002.
Operating profit/loss before and after depreciation/ amortization for Optimal Telecom in 2001 amounted to SEK –20 million and SEK –43 million,
respectively.

By function:
                                                                                                         Depreciation/Amortization
                                                                                                     Group                     Parent Company
                                                                                             2002             2001            2002            2001
Cost of services sold                                                                       –3,264           –2,782             —               —
Selling expenses                                                                               –83              –75             —               —
Administration expenses                                                                       –250             –197             —               —
Total depreciation/amortization for the year by function                                    –3,597           –3,054             —               —

By type of asset:
                                                                                                         Depreciation/Amortization
                                                                                                     Group                     Parent Company
                                                                                             2002             2001            2002            2001
Licences and right of use                                                                     –339              –46             —               —
Goodwill                                                                                    –1,512           –1,506             —               —
Buildings                                                                                      –19              –19             —               —
Machinery and other technical plant                                                         –1,350           –1,276             —               —
Equipment, tools and installations                                                            –240             –207             —               —
Plant under construction                                                                      –137               —              —               —
Total depreciation/amortization for the year by type of asset                               –3,597           –3,054             —               —

                                                                                             Group                    Parent Company
Estimated utilization period:
Intangible fixed assets:
Licences and right of use                                                               2–25 years                               —
Goodwill                                                                                3–20 years                               —

Tangible fixed assets:
Buildings                                                                               5–40 years                               —
Machinery and other technical plant                                                     2–25 years                               —
Equipment, tools and installations                                                      2–10 years                               —

Depreciation/amortization according to plan is based on the acquisition value of each fixed asset and its estimated utilization period. All deprecia-
tion/amortization is applied on a straight-line basis over the utilization period.
   Goodwill arising from the original acquisition of Comviq GSM AB and Tele2 Sverige AB and other acquisitions before 1996 are amortized over ten
years. The goodwill arising in 1996 in conjunction with the acquisition of outstanding minority shareholding in Tele2 Sverige AB and outstanding
options in Comviq GSM AB, is amortized over 20 years. Goodwill arising from the acquisition of Datametrix, Ritabell, SIA Tele2, SEC, Fora and Levicom
Broadband is amortized over a period of 20 years. The amortization periods are set on the basis of the estimated long-term and strategic significance
of each acquisition on the acquisition date. In the case of corporate acquisitions in new markets, an amortization period of 20 years is applied. Other
goodwill is amortized over five years.

48 T E L E 2 A N N U A L R E P O R T     2002
Note 3       Other operating revenue
                                                                                                    Group                    Parent Company
                                                                                            2002              2001          2002          2001

Rental of capacity and antenna installations                                                  —                 64             —                —
Exchange gains in business operations                                                         24                33              1               —
Divestment of fixed assets                                                                     9                 2             —                —
Other revenue, external                                                                       17                90             —                —
Other revenue, Group                                                                          —                 —              11               4
Total other operating revenue                                                                 50               189             12               4


 Note 4       Other operating expenses
                                                                                                    Group                    Parent company
                                                                                            2002              2001          2002          2001

Exchange loss from operations                                                                 –35              –20             —                —
Sale/scrapping of other fixed assets                                                          –18              –46             —                —
Other costs                                                                                    –9               –9             —                —
Total other operating expenses                                                                –62              –75             —                —


 Note 5       Profit/loss on shares in associated companies
                                                                                                    Group                    Parent company
                                                                                            2002              2001          2002          2001

Participation in profit/loss of associated companies                                          –41              –58             —                —
Total profit/loss in associated companies                                                     –41              –58             —                —


                                                                  Holding                           Group                    Parent Company
                                                        Dec. 31, 2002 Dec. 31, 2001         2002              2001          2002          2001

Svenska UMTS-nät AB                                            50%           50%               –1               –1             —                —
Other associated companies                                  Note 16         Not 16            –40              –57             —                —
Total net profit/loss from associated companies                                               –41              –58             —                —

Profit/loss in associated companies:
                                                                                                    2002                         2001
                                                                                      Sv UMTS-nät             Other   Sv UMTS-nät             Other
                                                                                                                           (9 mth)

Profit/loss in each associated company                                                         –2              –108            –2          –113
Holding                                                                                      50%            20–50%           50%        20–50%
Share of profit/loss                                                                           –1               –39            –1           –57
Change in share of profit/loss from preceding year                                             —                 –1            —             —
Total net profit/loss from associated companies                                                –1               –40            –1           –57

In the fourth quarter of 2002, Tele2 sold its 20% shareholding in Moscow Cellular Communication, an associated company in Tele2 Russia Telecom
BV Group (formerly Fora BV), which was acquired in 2001.

Extracts from the balance sheets and income statements of each associated company:
                                                                                                    2002                         2001
                                                                                      Sv UMTS-nät             Other   Sv UMTS-nät             Other
                                                                                                                          (9 mån)
Income statement:
Revenue                                                                                        —                70             —                13
Operating profit/loss after depreciation/amortization                                         –20              –86            –11             –103
Profit/loss for the year                                                                       –2             –108             –2             –113


                                                                                                                                                  49
Cont. note 5
                                                                                               Dec. 31, 2002                  Dec. 31, 2001
                                                                                        Sv UMTS-nät            Other   Sv UMTS-nät            Other
Balance sheet:
Tangible assets                                                                                468               —             12              432
Intangible and financial assets                                                                 —                33            —               107
Current assets                                                                                 545               80           492              141
Total assets                                                                                 1,013              113           504              680

Shareholders’ equity                                                                           995               –8           498              130
Long-term liabilities                                                                           —                37            —               349
Current liabilities                                                                             18               84             6              201
Total shareholders’ equity and liabilities                                                   1,013              113           504              680


 Note 6          Sales of associated companies
                                                                                                  Group                      Parent Company
                                                                                              2002             2001          2002             2001

Sale of Moscow Cellular Communication                                                            5               —              —               —
Sale of Transcom Worldwide S.A                                                                   —               91             —               —
Total sales of associated companies                                                              5               91             —               —


 Note 7          Profit/loss on shares in Group companies
                                                                                                                               Parent Company
                                                                                                                             2002             2001

Liquidation loss in Société Europénne de Communication S.A.                                                                     —       –13,964
Total profit/loss from shares in Group companies                                                                                —       –13,964

 Note 8          Profit/loss on other securities and receivables constituting fixed assets
                                                                                                  Group                      Parent Company
                                                                                              2002             2001          2002             2001

Interest, Group                                                                                                               180               61
Interest, external receivables                                                                   2                5             2                3
Writedown of shares in XSource Corporation                                                     –86               —             —                —
Exchange rate difference                                                                        —                –1            —                —
Total profit/loss on other securities and receivables constituting fixed assets                –84                4           182               64

 Note 9          Other interest income
                                                                                                  Group                      Parent Company
                                                                                              2002             2001          2002             2001

Interest, Group                                                                                                                 —               14
Interest, bank balances, etc.                                                                  111               66             —               —
Interest, penalty interest etc.                                                                 47               —              —               —
Exchange rate difference on financial fixed assets                                               7               –1             —               —
Total other interest income                                                                    165               65             —               14


 Note 10           Interest expense and similar profit/loss items
                                                                                                  Group                      Parent Company
                                                                                              2002             2001          2002             2001

Interest, loans                                                                               –679             –557            —               –14
Interest, financial leasing                                                                    –13              –11            —                —
Interest, penalty interest rate and other liabilities                                          –30              –53            —                —
Interest, Group                                                                                                                –5               —
Exchange rate difference on financial liabilities                                               57                2            —                —
Other financial expense                                                                       –114              –71            —                –1
Total interest expense and similar profit/loss items                                          –779             –690            –5              –15


50 T E L E 2 A N N U A L R E P O R T   2002
Note 11         Tax on profit/loss for the year and deferred tax liability/receivable
                                                                                                          Tax on profit/loss for the year
                                                                                                     Group                         Parent Company
                                                                                                2002            2001               2002         2001
Current tax expense:
Eastern Europe and Russia                                                                        –45                 –2               —             —
Central Europa                                                                                    –4                 —                —             —
Southern Europe                                                                                   —                  –1               —             —
Luxembourg                                                                                        —                   4               —             —
                                                                                                 –49                  1               —             —

Deferred tax expense, as a result of temporary differences:
Nordic                                                                                          –835            2,334               –35         3,076
Eastern Europe and Russia                                                                         22               —                 —             —
Central Europa                                                                                   116               —                 —             —
Southern Europe                                                                                  127               —                 —             —
Luxembourg                                                                                        30               —                 —             —
Branded products & services                                                                       15               —                 —             —
                                                                                                –525            2,334               –35         3,076
Total tax expense (–)/tax income (+) on profit for the year                                     –574            2,335               –35         3,076

                                                                                                    Group
                                                                                             Profit before tax and
                                                                                             and minority share,
                                                                                            geographic breakdown
                                                                                               2002             2001
Sweden                                                                                         2,532            2,072
Other countries                                                                               –1,736           –4,016
Total profit/loss and minority share                                                             796           –1,944

The difference between the booked tax expense for the Group and the tax expense based on prevailing tax rates in each country consists of the
following components:
                                                                                                                          Group
                                                                                                          Calculation of effective tax rate
                                                                                                2002                               2001
Profit/loss before tax and minority share                                                        796                              –1 944

Tax according to prevailing tax rate in:
Tax effect according to tax rates in Sweden                                                     –223           28,0%                544        28,0%
Difference between tax rate in Sweden for foreign subsidiaries                                   135                                326
                                                                                                –88                                 870
Tax effect of:
Non-tax affecting items, Group adjustments                                                      –418           52.5%               –422       –21.7%
Non-tax affecting items, other adjustments                                                        18           –2.3%                 40         2.1%
Liquidation of SEC and taxation of deferral                                                       —                —              3 082       158.5%
Non-deductible expenses etc                                                                      –81           10.2%                –35        –1.8%
Loss carry-forwards:
  – Valuation of loss carry-forwards in previous years                                           576           –72.4%                 —            —
  – Non-assessed additional loss carry-forward for the year                                     –581            73.0%             –1 200      –61.7%
 Tax expense/income and effective tax rate                                                      –574            72.1%              2 335      120.1%

                                                                                                       Group
                                                                                             Deferred tax receivable,
                                                                                                 attributable to
                                                                                         Dec. 31, 2002 Dec. 31, 2001
Long-term receivables                                                                               –3            –5
Machinery and technical plant                                                                  –1,019           –928
Value of unutilized loss carry-forwards                                                         2,268         2,697
Total deferred tax receivable (+)/tax liability (–)                                             1,246         1,764


                                                                                                                                                    51
Cont. note 11
                                                                                                         Group
                                                                                                Deferred tax receivable
                                                                                            Dec. 31, 2002 Dec. 31, 2001
Deferred tax receivable:
Nordic                                                                                              1,937            2,697
Eastern Europe and Russia                                                                              35               —
Central Europa                                                                                        117               —
Southern Europe                                                                                       128               —
Luxembourg                                                                                             36               —
Branded products & services                                                                            15               —
                                                                                                    2,268            2,697
Deferred tax liability:
Nordic                                                                                            –1,022              –933
Total deferred tax receivable (+)/tax liability (–)                                                1,246             1,764


Loss carry-forwards:
At December 31, 2002, the Tele2 Group had loss carry-forwards totaling SEK 19,173 million (2001: SEK 19,871million), of which SEK 1,744 mil-
lion (2001: SEK 3,300 million) expires within five years and the remaining amount, SEK 17,429 million (2001: SEK 16,571 million), expires after
five years or they continue to apply in perpetuity.
   A deferred tax receivable in the case of loss carry-forwards is reported only to the extent that it is estimated that they can be utilized in the near future.
Due to the improved results in Continental Europe deferred tax receivables of a total amount of SEK 576 million has been recognized in the profit
and loss statement in 2002. Total losses carried forward for the Group at December 31 2002 amounted to SEK 19,173 million, of which SEK 7,881
million has been utilized for deferred tax accounting and the remaining part, SEK 11,292 million, is valued to zero.
   The Swedish tax authorities have queried a loss carry-forward in Tele2 AB corresponding to a tax effect of SEK 176 million (2001: SEK 176 mil-
lion). These have been valued to SEK 169 million.


 Note 12           Intangible assets


                                                                                                                      Dec. 31, 2002
                                                                                                          Group                        Parent Company
                                                                                              Licences &          Goodwill             Total      Licenses &
                                                                                              right of use                                        right of use
Acquisition value:
Acquisition value at Jan. 1                                                                           996          29,755           30,751                 1
Acquisition value in acquired companies                                                                 1              —                 1                 —
Investments for the year                                                                              147             460              607                 —
Sales and scrapping                                                                                  –272              –9             –281                 —
Reclassification                                                                                      –13            –498             –511                 —
Translation differences for the year                                                                  –37            –962             –999                 —
Total acqusition value                                                                               822           28,746           29,568                 1
Accumulated depreciation/amortization:
Accumulated depreciation/amortization at Jan 1                                                       –260          –2,722           –2,982                 –1
Accumulated depreciation/amortization in acquired companies                                            —               —                —                  —
Depreciation/amortization for the year                                                               –339          –1,512           –1,851                 —
Sales and scrapping                                                                                   271               9              280                 —
Reclassification                                                                                        2              —                 2                 —
Translation differences for the year                                                                   13              66               79                 —
Total accumulated depreciation/amortization                                                          –313          –4,159           –4,472                 –1

Total intangible assets                                                                               509          24,587           25,096                 —

Investments for the year in goodwill relate essentially to the supplementary purchase price paid for Tele2 Russia (SEK 407 million).
   Sales and scrapping relate essentially to the phase-out of Tele2 Norway’s UMTS license, in which the net book value of capitalized license costs
was dissolved in its entirety and charged to depreciation in the amount of SEK –263 million.
   When Tele2 acquired Société Europénne de Communication SA, through an offer to SEC’s shareholders, there were outstanding stock options in
SEC. Tele2’s offer did no encompass the stock options, thus in order to calculate net assets, these have been given a theoretical value as if they had
been encompassed by the offer and booked as a liability in the consolidated balance sheet. During 2002, this liability was adjusted vis-à-vis good-
will, shown above as a reclassification, in the amount of SEK 498 million, with no effect on cash and profit.


52 T E L E 2 A N N U A L R E P O R T   2002
Note 13         Tangible assets
                                                                                                      Dec. 31, 2002
                                                                                              Group                                          Parent Company
                                                            Buildings        Machinery,        Equipment         Plant under         Total       Inventarier
                                                             & land          tech. plant                         construction
Acquisition value:
Acquisition value at Jan. 1                                       177          14,069            1,320               350            15,916                1
Acquisition value in acquired companies                             1              14               13                —                 28                —
Investments for the year                                           18           1,244              203               300             1,765                —
Sales and scrapping                                                –1            –146              –54              –147              –348                —
Reclassification                                                   —              331              –55              –263                13                —
Translation differences for the year                              –13            –268              –49                –7              –337                —
Total acqusition value                                            182          15,244            1,378               233            17,037                1

Accumulated depreciation:
Accumulated depreciation at Jan. 1                                –53          –5,799             –633                —             –6,485                –1
Accumulated depreciation in acquired companies                     —               –9              –11                —                –20                —
Depreciation for the year                                         –19          –1,350             –240              –137            –1,746                —
Sales and scrapping                                                —              130               44               144               318                —
Reclassification                                                   —              –11                9                —                 –2                —
Translation differences for the year                                5             129               28                –7               155                —
Total accumulated depreciation                                    –67          –6,910             –803                —             –7,780                –1

Total tangible assets                                             115            8,334             575                233            9,257                —

Sales and scrapping relate essentially to the phase-out of Tele2 Norway’s UMTS license, in which the net book value of capitalized license costs was
dissolved in its entirety and charged to depreciation for the year in the amount of SEK –137 million.

                                                                                                         Group                        Parent Company
                                                                                           Dec. 31, 2002 Dec. 31, 2001 Dec. 31, 2002 Dec. 31, 2001

Total capitalized interest expenses in fixed assets                                                205                193               —                 —


Financial leases:
All fixed assets utilized through financial leasing have been included in the consolidated accounts as fixed assets and loan liabilities, with the exception,
however, of contracts signed before 1997. The effects of these being included in the consolidated balance sheet are shown below and in Note 26.

                                                                                                                            Group
                                                                                                   Booked assets                      Assets not booked
                                                                                           Dec. 31, 2002 Dec. 31, 2001 Dec. 31, 2002 Dec. 31, 2001
Machinery and other technical plant:
Acquisition value                                                                                  298                306             155              155
Accumulated depreciation                                                                           –57                –87             –49              –42
Book value                                                                                         241                219             106              113

Financial leasing pertains primarily to the extension for transmission capacity in Sweden through Svenska Kraftnät, Vattenfall and agreements signed
in Denmark. Also, financial leasing occurs in Estonia, Russia and Luxembourg. During 2002, investments amounted to SEK 83 million, primarily in
Sweden in the amount of SEK 66 million and in Luxembourg in the amount of SEK 11 million. During the year, termination of financial leasing
occurred in Estonia and Latvia.


Tax-assessed value:
The tax-assessed value of the Group’s land in Sweden is SEK 1 million (2001: SEK 1 million).


                                                                                                                                                           53
Note 14           Shares in Group companies
                                                                                                                           Parent Company
                                                                                                                    Dec. 31, 2002 Dec. 31, 2001
Acquisition value:
Acquisition value at Jan. 1                                                                                                1,987           24,488
Investments                                                                                                                  699              885
Liquidation of Société Europénne de Communication S.A.                                                                        —           –23,386
Total shares in Group companies                                                                                            2,686            1,987

During 2002, the Parent Company paid a supplementary purchase price for Tele2 Russia Telecom BV (formerly Fora) of SEK 299 million and pro-
vided a shareholder contribution to NetCom Luxembourg SA of SEK 400 million.

Effect on cash of corporate acquisitions and divestments during the year:
The Group’s book value of acquired/divested assets and liabilities in acquired/divested companies was:
                                                                                                                   Group
                                                                                               Acquired                        Divested
                                                                                           2002            2001            2002             2001
Intangible fixed assets                                                                    –351             –394             —                —
Tangible fixed assets                                                                        –2             –614             —                —
Financial fixed assets                                                                       –1             –469             —                —
Inventories                                                                                  —               –21             —                —
Current receivables                                                                          –9             –238             —                —
Current investments and liquid funds                                                         –4             –890             —                —
Long-term liabilities                                                                         5            1,166             —                —
Current liabilities                                                                          12              428             —                —
Exchange rate difference                                                                     —               –11             —                —
Purchase sum                                                                               –350           –1,043             —                —

Paid with own shares                                                                          —             849               —                —
Paid through loans from the seller                                                            —             135               —                —
Paid/Received purchase sums                                                                 –350            –59               —                —
Cash in acquired/divested companies                                                            4            890               —                —
Effect on Group cash                                                                        –346            831               —                —


54 T E L E 2 A N N U A L R E P O R T   2002
Cont. note 14
Legal structure of the Tele2 Group*:
* including associated companies and other investments
                                                                                                                       Parent Company
                                                                    Number of      Total par      Holding              Book value
Company, reg. No, reg’d. Office                                        shares         value (capital/votes) Dec. 31, 2002 Dec. 31, 2001
Tele2 Russia Telecom BV, 33287334, Rotterdam, Netherlands             400 pcs   NLG 40 000          100%           1,150            851
 Tele2 Russia Telecom Services BV, 33.287.334, Amsterdam, Netherlands                               100%
 PSNR Personal System Networks in region,
 1025202610157, Niznhy Novgorod, Russia                                                             100%
 Tele2 Russia EKA Holding GmbH, FN 131600 f, Wien, Austria                                           100%
   Fora Telecom M, no P-12721.17, Moscow, Russia                                                    100%
 Tele2 Russia VOL Holding GmbH, FN 131602 h, Wien, Austria                                          100%
   Kursk Cellular Communications, no P-16792.17, Kursk, Russia                                      100%
   Smolensk Cellular Communications, no P-2581.16, Smolensk, Russia                                   60%
   Belgorod Cellular Communications, no P-2586.16, Belgorod, Russia                                   65%
   Kemerovo Mobile Communications, no P-13742.17, Kemerovo, Russia                                  100%
   Rostov Cellular Communications, no P-1790.16, Rostov, Russia                                       75%
   Udmurtiya Cellular Communications, no P-5818.16, Izhevsk, Russia                                   55%
   Siberian Cellular Communications, no P-4458.16, Omsk, Russia                                       60%
   Chelyabinsk Cellular Network, no P-3656.15, Chelyabinsk, Russia                                    51%
 Tele2 Russia MAC Holding GmbH, FN 132666 y, Vienna, Austria                                        100%
   CISC Cellular, no P-8068.17, Moscow, Russia                                                      100%
   Millicom New Tech. in Communications, no P-9894.17, Moscow, Russia                               100%
 Tele2 Russia International Holding BV, Nr 33221654, Amsterdam, Netherlands                         100%
 Tele2 Russia International Cellular BV, Nr 33227655, Amsterdam, Netherlands                        100%
Suomen Kolmegee, Helsinki, Finland                                                  Note 18   27.44%/15%
SCD Invest AB, 556353-6753, Sweden                                                  Note 18    9.1%/49.9%
NetCom Luxembourg SA, RC B73.796 Luxembourg                         1 000 pcs     tEURO 35          100%          1,536          1,136
 Tele2 Holding AB, 556579-7700, Stockholm, Sweden                                                   100%
   Tele2 Sweden AB, 556267-5164, Stockholm, Sweden                                                  100%
    Tele2 Sweden SA, RC B73.802, Luxembourg                                                         100%
      4 T Solutions Holding AB, 556580-2690, Stockholm, Sweden                                      100%
        XSource Corporation, USA                                                    Note 18        11,88%
      X-Source Holding AB, 556580-2682, Stockholm, Sweden                                           100%
        X-Source AB, 556290-2238, Stockholm, Sweden                                                 100%
        X-Source SA, RC B 87235, Luxembourg                                                         100%
      Optimal Telecom Holding AB, 556580-7855, Stockholm, Sweden                                    100%
        Optimal Telecom Sweden AB, 556440-1924, Stockholm, Sweden                                   100%
      Datametrix Sweden Holding AB, 556580-7871, Stockholm, Sweden                                  100%
        Datametrix AB, 556539-4870, Stockholm, Sweden                                               100%
      Everyday Holding AB, 556579-7718, Stockholm, Sweden                                           100%
        Stenblocket i Fruängen AB, 556058-8500, Stockholm, Sweden                                   100%
         Everyday Webguide AB, 556182-6016, Stockholm, Sweden                       Note 16           50%
      Svenska UMTS-nät Holding AB, 556606-7988, Stockholm, Sweden                                   100%
        Svenska UMTS-nät AB, 556606-7996, Stockholm, Sweden                         Note 16           50%
      Svenska UMTS-licens Holding AB, 556606-7764, Stockholm, Sweden, dormant                       100%
      Tele2 Norway Holding AB, 556580-8143, Stockholm, Sweden                                       100%
        Tele2 AS, 974534703, Oslo, Norway                                                           100%
         Tele2 Norge UMTS AS, 982795761, Oslo, Norway                                               100%
           Tele3 Norge AS, 932100975, Norway, dormant                                               100%
      Tele2 Danmark Holding AB, 556580-8028, Stockholm, Sweden                                      100%
        Tele2 Denmark A/S, 221234, Köpenhamn, Denmark                                               100%
         In2Loop A/S, 25 48 43 47, Köpenhamn, Denmark                                               100%
    In2loop Polska Sp. So.o, 54380, Warsawa, Poland                                                   90%
    Web Communication BV, 34112460, Amsterdam, Netherlands                                          100%
      Tele2 Polska Sp, 57496, Warsawa, Poland                                                       100%
    Tele2 Holding AS, 10262238, Tallinn, Estonia                                                      90%
      Tele2 Eesti AS, 10069046, Tallinn, Estonia                                                      52%
      UAB Tele2, 1147164, Vilnius, Lithuania                                                        100%
      UAB Levi & Kuto Kaunas, 1149679, Kaunas, Lithuania, dormant                                   100%
      UAB Levi & Kuto Klaipeda, 1150061, Klaipeda, Lithuania, dormant                               100%
                                                                                                                  2,686          1,987

                                                                                                                                        55
Cont. note 14
                                                                                                                      Parent Company
                                                                  Number of        Total par      Holding              Book value
Company, reg. No, reg’d. Office                                      shares           value (capital/votes) Dec. 31, 2002 Dec. 31, 2001
                                                                                        trsp                       2,686          1,987
   Belmus BV, 33261289, Amsterdam, Netherlands                                                      100%
     Tele2 Eesti AS, 10069046, Tallinn, Estonia                                                       48%
   Tele2 Holding SIA, 000351206, Latvia                                                             100%
     SIA Tele2, 000327285, Latvia                                                                   100%
   OU Levicom BroadBand, 10309744, Tallinn, Estonia                                                 100%
     UAB KRT, 2304688, Vilnius, Lithuania                                                           100%
      UAB C-Gates, 2424016, Vilnius, Lithuania                                                      100%
      UAB Trigeris, 2123967, Vilnius, Lithuania                                                     100%
     AS Levi Kaabel, 10417072, Tallinn, Estonia                                                     100%
      AS Telset Telecommunications Group, 10673906,Tallinn, Estonia                                 100%
     Tallinna Kaabeltelevisiooni AS, 10375439,Tallinn, Estonia                                        65%
     OU Trigger Software, 10687966, Tallinn, Estonia                                                100%
     AS Eesti Telag AS, 10310799, Tallinn, Estonia, dormant                                         100%
     SIA Levicom Broadband, 000353597, Riga, Latvia, dormant                                        100%
     Montalto Investments BV, 33135957,Amsterdam, Netherlands, dormant                              100%
   Corporation Severnaya Korona, no P-6117.16, Irkutsk, Russia                                      100%
   St Petersburg Telecom, no AO-3177, St Petersburg, Russia                                        60.6%
   Oblcom, no P-7180.16, St Petersburg, Russia                                                     60.6%
   ProcureITright AB, 556600-9436, Stockholm, Sweden                                                100%
     Proceedo Solution AB, 556599-5049, Stockholm, Sweden                                           100%
   Datametrix Norway AS, 975993108, Oslo, Norway                                                    100%
   Datametrix Danmark A/S, 39419, Köpenhamn, Denmark                                                100%
   Datametrix OY AS, 378548, Helsingfors, Finland                                                   100%
   OY Finland Tele2 AB, 1482343-8, Helsingfors, Finland                                             100%
   Interloop AB, 556284-7565, Stockholm, Sweden                                                     100%
   NetCom GSM Sweden AB, 556304-7025, Stockholm, Sweden                                             100%
   Åkersberga KV AB, 556326-3192, Österåker, Sweden                                                 100%
   Halmstads KV AB, 556380-6115, Halmstad, Sweden                                                   100%
   Skaraborgs Kabel-TV AB, 556483-6467, Mariestad, Sweden                                             60%
   Hallstahammar KV KB, 916580-7912, Västerås, Sweden                                                 90%
   Kopparstaden KV KB, 916583-0564, Västerås, Sweden                                                  80%
   Nelab KV KB, 916597-8983, Västerås, Sweden                                                         80%
   Kabelvision KB, 916836-8828, Sweden, dormant                                                     100%
   KB Haninge Kabelvision, 916633-3485, Sweden, dormant                                               80%
   Härnösand Kabelvision KB, 916589-2481, Sweden, dormant                                             80%
   KB June Kabelvision, 916702-4836, Sweden, dormant                                                  65%
   KB Lidingö Kabelvision, 916631-3289, Sweden, dormant                                               80%
   Älmhults Kabelvison KB, 916525,1043, Sweden, dormant                                               80%
   Trade2 (Sweden) AB, 556469-7836, Sweden, dormant                                                 100%
   Comviq Broadband AB, 556405-6678, Sweden, dormant                                                100%
   SCD AB, 556353-6829, Sweden, dormant                                                             100%
   Call2Web AB, 556403-7983, Sweden, dormant                                                        100%
   NIU Nätteknik, Installation och Underhåll AB, 556041-1307, Sweden, dormant                       100%
   Kalmar Kabelvision AB, 556244-2466, Sweden, dormant                                              100%
   Comviq GSM AB, 556450-2606, Sweden, dormant                                                      100%
   Swipnet AB, 556411-9401, Sweden, dormant                                                         100%
   NetCom Luxembourg Holding AB, 556580-7905, Sweden, dormant                                       100%
   Tele1 A/S, 955780132, Norway, dormant                                                            100%
   SNPAC Swedish Nr Portability Adm.Centre AB, 556595-2925, Sweden                 Note 16            20%
   Travellink AB, 556596-2650, Stockholm, Sweden                                   Note 18            15%
  S.E.C. Luxembourg S.A., R.C. B-84.649, Luxembourg                                                 100%
   Managest Media SA, RCB87091, Luxembourg                                         Note 16            40%
     Managest Media Spa, Italy                                                                      100%
   Tele2 Services Luxembourg SA, RC B 70203, Luxembourg                                             100%
   Societe Europeenne de Communication (Ireland) Ltd, 316848, Dublin, Ireland, dormant              100%
   3C Communications (Ireland) Ltd, 164025, Ireland, dormant                                        100%
                                                                                                                   2,686          1,987


56 T E L E 2 A N N U A L R E P O R T   2002
Cont. note 14
                                                                                                                      Parent Company
                                                                  Number of        Total par      Holding              Book value
Company, reg. No, reg’d. Office                                      shares           value (capital/votes) Dec. 31, 2002 Dec. 31, 2001
                                                                                        trsp                       2,686          1,987
    Tele2 s.r.o., 25650009, Prag, Czech Republic                                                    100%
    Tele2 /Slovakia/ s.r.o., 35806486, Slovakia                                                     100%
    Tele2 Magyarorszag Kft., 0109695967, Hungary                                                    100%
   SEC Holding BV, 33141829, Rotterdam, Netherlands                                                 100%
    Kinnevik Telecommunications Int. SA, RC B 52976, Luxembourg                                     100%
   Tele2 Europe SA, B 56944, Luxembourg                                                             100%
    Tele2 Telecommunication Services GmbH, FN 178222t, Vienna, Austria                              100%
    Tele2 Belgium SA, 609 392, Zellik, Belgium                                                      100%
    Télé2 France SA, FR48-409914058, Velizy, France                                                 100%
    Tele2 Telecommunication Services GmbH, 36232, Düsseldorf, Germany                               100%
    Tele2 Italia Spa, Ml-1998-247322, Segrate, Italy                                                100%
    Tele2 AG, H.1045/80, Liechstenstein                                                             100%
    Tele2 Luxembourg SA, B 65774, Luxembourg                                                        100%
    Tele2 (Netherlands) BV, BV 291906, Amsterdam, Netherlands                                       100%
    Tele2 Telecommunication Services S.L, B82051913, Madrid, Spain                                  100%
    Tele2 Telecommunication Services AG, CH-020390 55 969, Zürich, Switzerland                      100%
    Tele2 Communications Serv. Ltd, 3565220, London, UK                                             100%
    Telemilenio, Telecomunicacoes, Sociedade Unipessoal, 10468, Lissabon, Portugal                  100%
    TANGO SA, RC 59560, Luxembourg                                                                  100%
    Transac SA, B49487, Luxembourg                                                                  100%
    Everyday Media SA, R.C. B 78.227, Luxembourg                                                    100%
    Everyday Prod. SA, 69802, Luxembourg                                                            100%
    Calling Card Company SA, B 424 906 618, Paris, France                                              5%
    3C Communications International SA, RC B 29697, Luxembourg                                      100%
      3C Communications GmbH, FN695021, Vienna, Austria                                             100%
      3C Communications BVBA, 514 274, Brussels, Belgium                                              99%
      3C Communications SPA Italy, 28894/7359/14, Segrate, Italy                                      91%
      3C Communications Czech s-r-s, Czech Republic, dormant                                        100%
      3C Communications A/S,184462, Ballerup, Denmark                                               100%
      3C Communications OY, 585632, Finland                                                         100%
      3C Communications SA, 345 343 396 00023 Orleans, France                                         99%
      3C Communications GmbH, HRB 24104, Germany                                                      99%
      3C Communications Luxembourg SA, B39690, Luxembourg                                           100%
      3C Kommunikacios Szolgaltato Kft, Budapest, Hungary                                             90%
      3C Communications BV, Amsterdam, 14630454, Netherlands                                          99%
      3C Communications A/S, Oslo, Norway                                                           100%
      3C Transac A/S, Norway                                                                        100%
      3C Communicacoes Ltda, Domingos de Rana, Portugal                                               95%
      3C Communications Espana SA, Madrid, Spain                                                      99%
      3C Communications AB, 556332-6346, Stockholm, Sweden                                            97%
      3C Transac AB Sweden,556057-2116, Stockhom, Sweden                                            100%
      3C Communications Ltd, 2343138, UK                                                              96%
      3C Transac Ltd, Kingston-upon-Thames, UK                                                      100%
      Comviq Holding BV, 14630454, Amsterdam, Netherlands                                           100%
      3C Communications Equipment SA, B 25465, Luxembourg                                           100%
       3C Communications BVBA, 514 274, Brussels, Belgium                                              1%
       3C Communications SPA Italy, 28894/7359/14, Segrate, Italy                                      9%
       3C Communications SA, 345 343 396 00023 Orleans, France                                         1%
       3C Communications GmbH, HRB 24104, Germany                                                      1%
       3C Kommunikacios Szolgaltato Kft, Budapest, Hungary                                            10%
       3C Communications BV, Amsterdam, 14630454, Netherlands                                          1%
       3C Communicacoes Ltda, Domingos de Rana, Portugal                                               5%
       3C Communications Espana SA, Madrid, Spain                                                      1%
       3C Communications AB, 556332-6346, Stockholm, Sweden                                            3%
       3C Communications Ltd, 2343138, UK                                                              4%
                                                                                                                   2,686          1,987


                                                                                                                                       57
Cont. note 14
                                                                                                                              Parent Company
                                                                       Number of    Total par      Holding              Book value
Company, reg. No, reg’d. Office                                           shares       value (capital/votes) Dec. 31, 2002 Dec. 31, 2001
                                                                                         trsp                       2,686          1,987
      CCC Holding BV, 33 269 398, Amsterdam, Netherlands                                             100%
       Calling Card Company Limited, 3794813, UK                                                     100%
       CCC Calling Card Company Germany GmbH, HRB 40498, Germany                                     100%
       C3 Calling Card Company (Ireland) Limited, 309745, Ireland                                    100%
       Calling Card Company SA, B 424 906 618, Paris, France                                           95%
       Calling Card Company Italy SpA, 233372, Milano, Italy                                         100%
       Tele2 International Card Company S.A., RC 64 902, Luxembourg                                  100%
       Calling Card Company Netherlands BV, BV 82334, Amsterdam, Netherlands                         100%
       Calling Card Company Spain, S.A. A-62426457, Spain                                            100%
       Calling Card Company Telecommunication Services GmbH, FN 215362i, Austria                     100%
      SEC Everyday Europe BV, 341124357, Amsterdam, Netherlands                                      100%
       Everyday.com Internet Services GmbH, Austria                                                  100%
       Everyday.com Switzerland AG, CHF-0203023164-4, Zürich, Switzerland                            100%
       Everyday.com Germany GmbH, HR B 36232, Germany                                                100%
       Everyday.com France SAS, B-430291898, Velizy, France                                          100%
       Everyday.com Italia S.R.L, R.C. 1605497, Italia Srl, Italy                                    100%
       Everyday Luxembourg SA, B 64 902, Luxembourg                                                  100%
       Everyday.com Netherlands BV, 34125168, Amsterdam, Netherlands                                 100%
      IntelliNet Holding BV, 34126307, Amsterdam, Netherlands                                        100%
       Intellinet Telecommunications GmbH, FN 190268 g, Vienna, Austria                              100%
       Intellinet Telecommunication GmbH, HRB 48344, Frankfurt, Germany                              100%
       IntelliNet S.p.A, R.C. 1615155, Segrate, Italy                                                  99%
       IntelliNet BV, 34120156, Amsterdam, Netherlands                                               100%
       IntelliNet Telecommunication Services AG, CH-020.3.021.518-8, Zürich, Switzerland             100%
      Fagersta AB, 556238-4171, Stockholm, Sweden                                                    100%
       Transcom Holding AB, 556468-0857, Sweden, dormant bolag                                       100%
       3C Holding AB, 556491-9503, Sweden, dormant bolag                                             100%
      Tele2 Marketing Dynamics AS, 932100975, Norway, dormant                                        100%
      Tele2 Telecommunications Services Ltd, 292887, Dublin, Ireland, dormant                        100%
      IntelliNet S.p.A, R.C. 1615155, Segrate, Italy                                                    1%
Total shares in Group companies                                                                                     2,686          1,987

In October 2002, Tele2 acquired 100% of the shares in ProcureITright, a supplier of procurement function services and WEB-based procurement
systems, from XSource Corporation. During 2002, the sale was made of the Swedish UMTS license to Svenska-nät AB, which is 50% owned with
Telia; as well as a 20% share of OJSC Moscow Cellular Communication.


Significant events after the end of the financial year
In February 2003 Tele2 acquired Alpha Telecom. This is the UK’s leading operator in prepaid fixed network telephony for individuals and a market
leader in cash cards for fixed telephony. Alpha Telecom, sells about 1.25 million cash cards per month from 60,000 sales outlets in the UK and has
sales of SEK 1.9 billion. The acquisition price amounted to approximately SEK 780 million, on a debt-free basis.


 Note 15           Receivables from Group companies


                                                                                                                           Parent company
                                                                                                                  Dec. 31, 2002 Dec. 31, 2001
Acquisition value at Jan. 1                                                                                             12,526         1,028
Lending                                                                                                                  3,337        11,904
Amortization and additions granted                                                                                         –510          –406
Total receivables from Group companies                                                                                  15,353        12,526

Receivables from/liabilities to Group companies are subject to commercial terms and conditions.


58 T E L E 2 A N N U A L R E P O R T   2002
Note 16        Shares in associated companies
                                                                                                                                Group
                                                                    Number of     Total par            Holding          Book value
Company, reg. No, reg’d. Office                                        shares         value                  Dec. 31, 2002 Dec. 31, 2001
Svenska UMTS-nät AB, 556606-7996, Stockholm, Sweden               502,000 pcs tSEK 50,200                50%           498           249
OJSC Moscow Cellular Com., P7696.16, Moscow, Russia             1,250,000 pcs tRUBEL 1,250                 —            —             75
Managest Media SA, RCB87091, Luxembourg                          12,000 pcs B   tEURO 120                40%            44            —
SNPAC Swedish Number Portability Administrative
   Centre AB, 556595-2925, Stockholm, Sweden                           200 pcs          tSEK 20          20%              —                2
Total shares in associated companies                                                                                     542             326

Everyday Webguide AB, 556182-6016, Stockholm, Sweden                 1,750 pcs      tSEK 175             50%             –28            –102
Total provisions to associated companies                                                                                 –28            –102

During the fourth quarter of 2002, Tele2 sold its 20% shareholding in Moscow Cellular Communication.


Contribution of each associated company to Group equity:
                                                                                              2002                          2001
                                                                                 Sv UMTS-nät             Other   Sv UMTS-nät            Other
                                                                                                                      (9 mth)
Goodwill:
Total goodwill, book value, Dec. 31                                                          —             —              —               —

Equity share:
Equity share, Jan. 1                                                                       249            –25             —              –51
Acquired companies, opening balance                                                         —              —              —               75
Share of capital contributions and new share issues                                        250            147            250               8
Share of profit/loss                                                                        –1            –40             –1             –57
Divestments during the year                                                                 —             –66             —               —
Equity share, Dec. 31                                                                      498             16            249             –25

Total shares in associated companies                                                       498             16            249             –25


 Note 17        Receivables from associated companies
                                                                                             Group                     Parent Company
                                                                                 Dec. 31, 2002 Dec. 31, 2001 Dec. 31, 2002 Dec. 31, 2001
Acquisition value at Jan, 1                                                                115           105           115            67
Shareholder contribution                                                                  –102            –7          –102            –7
Lending                                                                                      6            17             6            55
Total receivables from associated companies                                                 19           115            19           115

Receivables from associated companies are subject to commercial terms and conditions.


                                                                                                                                            59
Note 18           Other long-term holdings of securities
                                                                                                                            Group
                                                            Number of    Total par                Holding                   Book value
Company, reg. No, reg’d. Office                              shares         value         capital   voting rights Dec. 31, 2002 Dec. 31, 2001
Parent Company :
Suomen Kolmegee, Helsinki, Finland                        1,924 pcs     tFIM 1 924       27.44%            15%             28               5
SCD Invest AB, 556353-6753, Stockholm                  1,058,425 A                         9.1%           49.6%            —                —
                                                                                                                           28               5
Other, Group:
XSource Corporation, USA                             1,806,575 pcs         tUSD 18       11.88%          11.88%            36             122
Travellink AB, 556596-2650, Stockholm                   15,000 pcs      tSEK 1,500          15%             15%            75              75
Total long-term holdings of securities                                                                                    139             202

                                                                                                 Group                   Parent Company
                                                                                     Dec. 31, 2002 Dec. 31, 2001 Dec. 31, 2002 Dec. 31, 2001
Acquisition value:
Acquisition value at Jan. 1                                                                  545           489            348             366
Investments for the year                                                                      23            74             23              —
Sales for the year                                                                            —             —              —              –18
Reclassification                                                                              —            –18             —               —
Total acqusition value                                                                       568           545            371             348
Write-downs:
Accumulated write-downs at Jan, 1                                                           –343           –343          –343             –343
Write-downs during the year                                                                  –86             —             —                —
Total accummulated write-downs                                                              –429           –343          –343             –343

Total other long-term holdings of securities                                                 139           202             28               5

During 2002, additional investments were made in Suomen Kolmegee OY for SEK 23 million, as well as share write-downs in XSource Corporation by
SEK 86 million. The book value is regarded as corresponding to real value.


 Note 19           Other long-term receivables
                                                                                                 Group                   Parent Company
                                                                                     Dec. 31, 2002 Dec. 31, 2001 Dec. 31, 2002 Dec. 31, 2001
Acquisition value at Jan. 1                                                                     85           106            —             46
Lending                                                                                          8            23            —             12
Amortization                                                                                   –11            –5            —             —
Reclassification                                                                                –7           –41            —            –58
Translation difference                                                                          –1             2            —             —
Total other long-term receivables                                                               74            85            —             —

                                                                                                 Group                   Parent Company
                                                                                     Dec. 31, 2002 Dec. 31, 2001 Dec. 31, 2002 Dec. 31, 2001
Receivable from Finvision                                                                       39            47            —             —
Receivable from XSource Corporation                                                             20            17            —             —
Receivable from Alecta                                                                           6             6            —             —
Other                                                                                            9            15            —             —
Total other long-term receivables                                                               74            85            —             —


60 T E L E 2 A N N U A L R E P O R T   2002
Note 20         Accounts receivable, trade
                                                                                                    Group
                                                                                          Accounts receivable, trade
                                                                                       Dec. 31, 2002 Dec. 31, 2001
Accounts receivable, trade                                                                    5,656         4,542
Reserve for doubtful receivables                                                             –1,283           –918
Total accounts receivable, trade                                                              4,373         3,624

                                                                                                    Group
                                                                                       Reserve for doubtful receivables
                                                                                       Dec. 31, 2002 Dec. 31, 2001
Reserve for doubtful receivables at Jan. 1                                                       918           558
Reserves in companies acquired during the year                                                    —             15
Netincrease of reserve                                                                           415           349
Recovery of previous write-downs                                                                 –30           –36
Translation difference in opening balance                                                        –20            32
Total reserve for doubtful receivables                                                        1,283            918

Credit risk entails the book losses that should be reported as of the closing date if the counter-parties have completely neglected to fulfill their pay-
ment liability in accordance with agreements. The Group has limited its credit risk in respect of receivables by continually conducting credit assess-
ments of the customer stock. Since the Group has a highly varied customer stock that covers individuals as well as companies, this entails that the
credit risk is limited. The Group makes provisions for any credit losses, and these have remained within management’s expectations.


 Note 21         Other current receivables
                                                                                                     Group                      Parent Company
                                                                                       Dec. 31, 2002 Dec. 31, 2001 Dec. 31, 2002 Dec. 31, 2001
VAT receivables                                                                                  174           262            —              2
Receivable from Kinnevik                                                                          —             78            —             —
Receivable from Millicom International BV                                                         —            113            —             —
Receivable from Svenska UMTS-nät                                                                  32            11            —             —
Receivable from suppliers                                                                         13            —             —             —
Miscellaneous                                                                                     31            66            —             —
Total other current receivables                                                                  250           530            —              2


 Note 22         Prepaid expenses and accrued revenues
                                                                                                     Group                      Parent Company
                                                                                       Dec. 31, 2002 Dec. 31, 2001 Dec. 31, 2002 Dec. 31, 2001
Accrued telephony revenue, other telecom operators                                               934           544            —             —
Accrued telephony revenue, customers                                                          1,525         1,511             —             —
Finanacing fees                                                                                  170           209            —             —
Prepaid financing charges                                                                        420           505             1             1
Total prepaid expenses and accrued revenues                                                   3,049         2,769              1             1


                                                                                                                                                     61
Note 23           Liquid funds and overdraft facilities
                                                                                    Liquidity
                                                                       Group                          Parent Company
                                                           Dec. 31, 2002 Dec. 31, 2001 Dec. 31, 2002 Dec. 31, 2001
Cash and bank balances                                            2,473         2,275             10             8
Current investments                                                   —             —             —             —
Total cash                                                        2,473         2,275             10             8

Blocked accounts                                                  –870            –897                  —              —
Unutilized overdraft facilities and credit lines                   729             247                  —              —
Total liquidity                                                  2,332           1,625                  10             8

                                                                               Overdraft facilities
                                                                       Group                          Parent Company
                                                           Dec. 31, 2002 Dec. 31, 2001 Dec. 31, 2002 Dec. 31, 2001
Overdraft facilities granted                                          19            26            —             —
Overdraft facilities utilized                                         —            –14            —             —
Total unutilized overdraft facilities                                 19            12            —             —

Unutilized credit lines                                            710              235                 —              —
Unutilized overdraft facilities and credit lines                   729              247                 —              —

                                                                     Collateral pledged for overdraft facilities
                                                                       Group                          Parent Company
                                                           Dec. 31, 2002 Dec. 31, 2001 Dec. 31, 2002 Dec. 31, 2001
Receivables                                                           —             18            —             —
Other assets                                                          —              9            —             —
Total collateral pledged for own overdraft facilities                 —             27            —             —

                                                                    Exchange-rate difference in liquid funds
                                                                      Group
                                                           Dec. 31, 2002 Dec. 31, 2001
Liquid funds at Jan. 1                                              –185            83
Cash flow for the year                                               –68           –58
Total exchange-rate difference in cash                              –253            25


62 T E L E 2 A N N U A L R E P O R T   2002
Note 24          Shareholders' equity
Exchange-rate difference:
                                                                                                                                  Group
                                                                                                        Exchange-rate difference in shareholders' equity
                                                                                                          Other restricted     Unrestricted           Total
                                                                                                             reserves           reserves
Opening shareholders' equity, Jan. 1, 2002                                                                      1,049             –320             729
Change during the year                                                                                          1,844             –110           1,734
Year-end, Dec. 31, 2002                                                                                         2,893             –430           2,463

Other changes during the year                                                                                 –4,189             3,165          –1,024
Tax effect this year, net                                                                                         —                 –2              –2
Total change during the year                                                                                  –4,189             3,163          –1,026

Closing adjusted shareholders’ equity, Dec. 31, 2002                                                          –1,296             2,733           1,437

Exchange rate difference in consolidated income statement:
Exchange-rate differences that arise in operations are reported across the income statements and amount to:
                                                                                                     Group                        Parent Company
                                                                                               2002             2001              2002            2001
Other operating revenue                                                                          24               33                 1              —
Other operating expenses                                                                        –35              –20                —               —
Result from other securities and receivables treated as fixed assets                             —                –1                —               —
Other interest income and similar profit/loss items                                               7               –1                —               —
Interest expense and similar profit/loss items                                                   57                2                —               —
Exchange-rate difference in the income statement                                                 53               13                 1              —

The consolidated balance sheet and income statement are affected by fluctuations in subsidiaries' currencies via-á-vis the Swedish krona. Group
operating revenue and EBITDA are distributed among the following currencies:
                                                  Operating revenue                                                          EBITDA
                                           2002                          2001                              2002                                2001
SEK                             10,337          33%             9,289           37%               4,516          88%                   3,690        217%
EURO                            13,523          43%            10,084           40%                –355          –7%                  –2,172       –128%
Other                            7,422          24%             5,712           23%                 966          19%                     180         11%
Total                           31,282         100%            25,085          100%               5,127         100%                   1,698        100%

A 1% currency movement against the Swedish krona affects the Group's operating revenue and EBITDA on an annual basis by SEK 209 million
(2001: SEK158 million) and SEK 6 million (2001: SEK –20 million), respectively. At December 31, 2002 changes in exchange rates compared
with the preceding year affected operating revenue by SEK 57 million and EBITDA by SEK –1 million.

The change rates used to translate income statements and balance sheets to SEK are shown below.
                                                                                                Income statement                      Balance sheet
                                                                                               2002            2001 Dec. 31, 2002 Dec. 31, 2001
GBP                                                                                         14.6394         14.8725     14.1475       15.4750
USD                                                                                         9.82870        10.33080        8.825      10.6675
EURO                                                                                         9.1698          9.2519       9.1925        9.4190
CHF                                                                                          6.2494          6.1280       6.3235        6.3600
DKK                                                                                          1.2340          1.2415       1.2375        1.2665
NOK                                                                                          1.2150          1.1499       1.2595        1.1835
EEK                                                                                          0.5860          0.5913       0.5875        0.6020
LVL                                                                                         15.8860         16.5171     15.0200       16.9000
LTL                                                                                          2.6490          2.5819       2.6600        2.6700
PLN                                                                                          2.4076          2.5239       2.3000        2.6900
CZK                                                                                          0.2971          0.2718       0.2933        0.2936
HUF                                                                                          0.0377          0.0361       0.0390        0.0382

Currency risks:
In telephony operations a currency risk arises in connection with international call traffic, which means that a liability or a receivable arises between
Tele2 companies and foreign operators. In mobile telephony through December 2002, these transactions were calculated in SDRs (Special Drawing
Rights) but were invoiced and paid in USD. As of 2003, these are calculated and paid in EURO.
   Currency risks in our international operations are limited by denominating loans to group companies in the subsidiary’s local currency.
   The five-year loan facility is denominated partly in EURO. The exchange-rate difference that continually arises in translating the loan liability is
offset against the exchange-rate differences that arise on the corresponding net investment in subsidiaries. No hedging is undertaken against other
types of currency risk.
                                                                                                                                                          63
Not 25           Number of shares
The share capital in Tele2 AB is divided into two share classes, namely, Series A and B shares. Both types of shares have a par value of SEK 5 per
share and offer equal participation in the company’s net assets and earnings. Series A shares, however, entitle the holder to 10 voting rights and
Series B shares to one voting right.

                                                                                           Parent Company
                                                       A-shares                        B-shares
                                              Change              Total       Change              Total         Total     Par value per      Share capital
                                                                                                              Number       share (SEK)            (MSEK)
Number of shares:
December 31, 1999                                         18,095,632                      85,754,614      103,850,246             SEK   5               519
New share issue, acq. of SEC           11,911,315         30,006,947      28,837,165     114,591,779      144,598,726             SEK   5               723
New share issue, options                                  30,006,947         200,000     114,791,779      144,798,726             SEK   5               724
December 31, 2000                                         30,006,947                     114,791,779      144,798,726             SEK   5               724

New share issue, acq.
  of Tele2 Russia                                         30,006,947       2,461,449     117,253,228      147,260,175             SEK 5                 736
New share issue, convertibles                             30,006,947         100,000     117,353,228      147,360,175             SEK 5                 737
December 31, 2001                                         30,006,947                     117,353,228      147,360,175             SEK 5                 737

Reclassification, A-
  to B-shares                   –8,317,143                21,689,804       8,317,143     125,670,371      147,360,175             SEK 5                 737
New share issue, convertibles*)                           21,689,804         100,000     125,770,371      147,460,175             SEK 5                 737
December 31, 2002                                         21,689,804                     125,770,371      147,460,175             SEK 5                 737

Outstandng convertibles and warrants:
Convertibles, 2000–2003                                           —                          100,000          100,000
Warrants, 2002–2005                                               —                          663,000          663,000
Total number of shares after full dilution                21,689,804                     126,533,371      148,223,175

*) At December 31, 2002 the shares converted during 2002, 100 000 B-shares, were being registered at the Swedish Patent and Registration Office.


Convertibles and warrants:
In October 2000, three convertible debenture loans were issued at a par value of SEK 1, each with preference rights to subscribe for 100,000
B shares in Tele2 AB at a subscription price of SEK 150 per share, and maturing in 2001, 2002 and 2003. See Note 38 for further information.
   The outstanding warrants at Dec. 31, 2002 correspond to 663,000 B shares, at a subscription price of SEK 191 per share and a subscription
period from 2005 to 2006. See Note 38 for further information.


Earnings per share:
                                                                                                                         Group
                                                                                                  Earnings per share             Earnings per share,
                                                                                                                                  after full dilution
                                                                                                   2002           2001            2002            2001
Net profit/loss for the year                                                                        223            392             223             392
Reversal: interest for the year after tax on outstanding convertibles                                                               —               —
Adjusted profit/loss for the year after full dilution                                                                              223             392

Weighted average number of shares                                                           147,360,175 145,003,847
Weighted average number of outstanding shares after full dilution                                                        147,634,293 145,223,466
Earnings per share                                                                            SEK 1.51       SEK 2.70       SEK 1.51    SEK 2.70


Dividend per share:
Tele2 AB did not pay a dividend during the year and does not foresee paying a dividend during the current fiscal year.


64 T E L E 2 A N N U A L R E P O R T   2002
Note 26         Liabilities to financial institutions
                                                                                                   Short-term liabilities to financial institutions
                                                                                                        Group                        Parent Company
                                                                                          Dec. 31, 2002 Dec. 31, 2001 Dec. 31, 2002 Dec. 31, 2001
Five-year loan facility                                                                          2,344            707            —             —
Alfa Bank /Omskpromstoy Bank                                                                          3            —             —             —
   (collateralt: chattel mortgages in Seberian Cellular Comm., Omsk Russia)
Financial leases                                                                                     30               24                —               —
Total short-term interest-bearing loans                                                           2,377              731                —               —

                                                                                                    Long-term liabilities to financial institutions
Creditors                                                                                                                                 Group
 (collateral provided)                                                          Interest-rate terms Maturity date Dec. 31, 2002 Dec. 31, 2001
Parent Company:                                                                                                              —             —
Other Group companies:
Five-year loan facility                                             EURIBOR/LIBOR + 0.75–2.25% 2003–2006                 6,954         9,834
   (collateral: shares in Tele2 Sverige and SEC SA as well as
   certain shares in Group companies which in turn are subject to guarantees
   Tele2 AB and cross-guarantees among certain Group companies, and
   collateral provided in the form of receivables from certain Group companies
   and limitations in repayment potential of internal loans from Tele2 AB)
Banque Invik                                                                   marginal 0.5%–1% 2004–2005                   755           881
   (collateral: Blocked bank accounts in Tele2 Russia Telecom BV)
Merita-Nordbanken                                                                   variable rate          2004               1             3
     (collateral: guarantees by Tele2)
Financial leasing, for machinery & technical plant                                                                          166           125
Total long-term interest-bearing loans                                                                                   7,876        10,843

                                                                                             Collateral provided for liabilities to financial institutions
                                                                                                        Group                        Parent Company
                                                                                          Dec. 31, 2002 Dec. 31, 2001 Dec. 31, 2002 Dec. 31, 2001
Chattel mortgages                                                                                    11            —             —             —
Net assets in subsidiaries                                                                      22,778        23,197
Bank deposits                                                                                       841           897            —             —
Total collateral provided for liabilities to financial institutions                             23,630        24,094             —             —

During 2001, Tele2 Sverige AB signed a new five-year bank finance facility for SEK 10.8 billion, guaranteed by ABN Amro, CIBC World Markets, ING
Bank, Nordea, The Royal Bank of Scotland and West LB. The loan is partly denominated in SEK and partly in EUR. The five-year bank financing facil-
ity with amortization is divided up into three tranches, in which the agreed SEK 9.4 billion in Tranche A is to be repaid in seven repayments, and in
which each amortization amounts to between 5% an 15% of the original loan amount and the remaining 17.5% of the loan is to be repaid by June
30, 2006. During 2002, repayment of Tranche A was made in the amount of SEK 467 million. The potential to borrow under Tranche B is limited
to SEK 1.1 billion and is to be repaid by June 30, 2006. Tranche C, amounting to SEK 250 million, was repaid in its entirety in January 2002.
    The five-year loan facility is based on requirements involving the fulfillment of certain financial key ratios. Tele2 expects to fulfill the requirements.
The loan liability carries a rate of interest corresponding to Euribor and Libor, respectively, plus an interest margin. The interest margin, which is
based on indebtedness in relation to EBITDA, starts at 2.25% and is reduced in line with the improvement in EBITDA. At December 31, 2002 Tele2
attained the minimum interest differential of 0.75% with effect from February 2003. The five-year facility entails a certain curtailment of Tele2
Group’s potential to raise other external loans and the potential to provide assets as collateral.
    The loan in Banque Invik pertains to loan to the Russian operations. Tele2 has deposited the corresponding amount with Banque Invik. The inter-
est margin is 0.5%–1%.
    Pledged shares are reported in the Group at an amount that corresponds to the book value of the net assets that each subsidiary represents in the
consolidated balance sheet.
    The average rate of interest on loan liabilities during the year was 6.4% (2001: 6.3%).
                                                                                                               Loan liability matures
                                                                                                        Group                        Parent Company
                                                                                          Dec. 31, 2002 Dec. 31, 2001 Dec. 31, 2002 Dec. 31, 2001
Within1 year                                                                                     2,377            731            —             —
1–2 years                                                                                        3,070         2,375             —             —
2–3 years                                                                                        2,646         3,254             —             —
3–4 years                                                                                        2,049         2,601             —             —
4–5 years                                                                                            16        2,553             —             —
5–10 years                                                                                           75            60            —             —
10–15 years                                                                                          20            —             —             —
Total loans to financial institutions                                                           10,253        11,574             —             —

                                                                                                                                                             65
Cont. note 26
Interest rate risk:
Of the total loan liability at December 31, 2002, SEK 9,330 million, corresponding to 91% (2001: SEK 10,824 million, 91%) carried a variable
rate of interest. An increase in interest rates of 100 basic points would entail an additional interest expense of SEK 93 million, calculated on the
basis of variable interest-bearing liabilities at December 31, 2002.
   The Group’s interest-rate on borrowing is currently variable with fixed-interest periods of up to 12 months. However, Tele2 is monitoring trends on
interest-rate markets and decisions regarding the interest-rate fixing strategy are assessed continually.

Interest-bearing liabilities with variable interest rates mature for payment as follows:


                                              Within 1 year   1–2 years      2–3 years         3–4 years         4–5 years        5–10 years           Total
Interest-bearing liabilities
   with variable interest rates                   2,352         2,368            2,578             2,032                  —                 —        9,330

Financial leasing:
All fixed assets utilized through financial leasing have been included in the consolidated accounts as fixed assets and loan liabilities, with the exception,
however, of contracts signed before 1997. The effects of these being included in the consolidated balance sheet are shown below and In Note 13.

                                                                                                                        Group
                                                                                                                Financial leasing
                                                                                                       Booked                         Not booked
                                                                                           Dec. 31, 2002 Dec. 31, 2001 Dec. 31, 2002 Dec. 31, 2001
Short-term portion                                                                                    30            24             8             9
Long-term portion                                                                                    166           125            84            91
Total loans for financial leasing objects                                                            196           149            92           100

                                                                                                   Dec. 31, 2002
                                                                                                       Group
                                                                                               Loan liability matures
                                                                                                Booked      Not booked
Within 1 year                                                                                       43              12
1–2 years                                                                                           30              12
2–3 years                                                                                           28              12
3–4 years                                                                                           25              12
4–5 years                                                                                           23              11
5–10 years                                                                                          79              42
10–15 years                                                                                         22              13
Total loan liability and interest                                                                 250             114
Less interest portion:                                                                             –54             –22
Total loans for financial leasing objects                                                         196               92

Financial leasing pertains primarily to the extension of transmission capacity in Sweden through Svenska Kraftnät Vattenfall and agreements signed
in Denmark. Also, financial leasing occurs in Estonia, Russia and Luxembourg. During 2002, investments amounted to SEK 83 million, primarily
in Sweden in the amount of SEK 66 million and in Luxembourg in the amount of SEK 11 million. During the year, termination of financial leasing
occurred in Estonia and Latvia.

 Note 27           Other interest-bearing liabilities

                                                                                                    Other short-term interest-bearing liabilities
                                                                                                        Group                       Parent Company
                                                                                           Dec. 31, 2002 Dec. 31, 2001 Dec. 31, 2002 Dec. 31, 2001
XSource Corporation                                                                                    5            —             —             —
Levicom International                                                                                 —            134            —             —
Ericsson                                                                                              —             17            —             —
Total other short-term interest-bearing liabilities                                                    5           151            —             —

                                                                                                    Other long-term interest-bearing liabilities
                                                                                                        Group                       Parent Company
                                                                                           Dec. 31, 2002 Dec. 31, 2001 Dec. 31, 2002 Dec. 31, 2001
SCD Finans AB                                                                                         23            —             —             —
Ericsson                                                                                              —              2            —             —
Motorola                                                                                              —             55            —             —
Kinnevik S.A.                                                                                         —             14            —             —
Millicom International BV                                                                             —             44            —             —
Total other long-term interest-bearing liabilities                                                    23           115            —             —


66 T E L E 2 A N N U A L R E P O R T   2002
Cont. note 27
                                                                                                         Loan maturity schedule
                                                                                                    Group                      Parent Company
                                                                                      Dec. 31, 2002 Dec. 31, 2001 Dec. 31, 2002 Dec. 31, 2001
Within 1 year                                                                                     5           151            —             —
1–2 years                                                                                        23           115            —             —
Total other interest-bearing liabilities                                                         28           266            —             —


 Note 28         Other short-term liabilities
                                                                                                    Group                      Parent Company
                                                                                      Dec. 31, 2002 Dec. 31, 2001 Dec. 31, 2002 Dec. 31, 2001
VAT liability                                                                                   276           218            —             —
Tax-at-source, personnel                                                                         27            37            —             —
Other taxes                                                                                      59            34            —             —
Liability to SCD Finans AB                                                                       —             30            —             —
Liability to Motorola                                                                            —             26            —             —
Customer deposits                                                                                26            17            —             —
Other                                                                                            53            13             5            —
Total other short-term liabilities                                                              441           375             5            —


 Note 29         Accrued expenses and prepaid revenues
                                                                                                    Group                      Parent Company
                                                                                      Dec. 31, 2002 Dec. 31, 2001 Dec. 31, 2002 Dec. 31, 2001
Personnel-related costs                                                                         168           734             4             3
Interest expenses                                                                               212           150            —             —
Telephony expenses to other telecom operators                                                1,701         1,664             —             —
Expenses for vendors                                                                             14            12            —             —
Leasing and rental expenses                                                                      24            29            —             —
Program costs                                                                                    33            33            —             —
External services expenses                                                                      715           602             4             4
Prepaid income                                                                                  702           541            —             —
Other                                                                                           204           249            —             —
Total accrued expenses and prepaid revenues                                                  3,773         4,014              8             7

When Tele2 acquired Société Europénne de Communication SA, through an offer to SEC’s shareholders, there were outstanding stock options in SEC.
Tele2’s offer did not encompass the stock options, thus in order to calculate net assets, these have been given a theoretical value as if they had been
encompassed by the offer and booked as a liability in the consolidated balance sheet. During 2002, this liability was adjusted vis-à-vis goodwill,
shown above as a personnel-related cost, and adjusted against goodwill the amount of SEK 498 million, with no effect on cash and profit.


 Note 30         Pledged assets
                                                                                                    Group                      Parent Company
                                                                                      Dec. 31, 2002 Dec. 31, 2001 Dec. 31, 2002 Dec. 31, 2001
Chattel mortgages                                                                                11            —             —             —
Net assets in Group companies                                                               22,778        23,197
Inventories                                                                                      19            18            —             —
Receivables                                                                                      —             18            —             —
Bank bills                                                                                      870           897            —             —
Other assets                                                                                     —              9            —             —
Total assets pledged for own liabilities                                                    23,678        24,139             —             —

The above information shows the book value of assets pledged as collateral for external loans (as in Note 26), overdraft facilities and blocked bank
funds (as in Note 23) and other liabilities (as in Note 27). In the Group, pledged shares are reported in an amount corresponding to the book value
of the net assets that each subsidiary represents in the consolidated balance sheet.


                                                                                                                                                   67
Note 31           Contingent liabilities and other commitments
                                                                                                       Group                       Parent Company
                                                                                         Dec. 31, 2002 Dec. 31, 2001 Dec. 31, 2002 Dec. 31, 2001
Surety bonds benefiting Group companies                                                             —             —        12,825        15,133
Total contingent liabiities                                                                         —             —        12,825        15,133

SEK 9,298 million (SEK 10,541 million) of the contingent liabilities in the Parent Company relates to a guarantee for the five-year loan facility (see
Note 26).

Operational leasing:
                                                                                                            Operational leasing fees
                                                                                                       Group                       Parent Company
                                                                                                 2002             2001            2002             2001
Annual fees for operating leases                                                                  752              782              —                —

                                                                                                         Payment schedule for future fees
                                                                                                       Group                       Parent Company
                                                                                         Dec. 31, 2002 Dec. 31, 2001 Dec. 31, 2002 Dec. 31, 2001
Within 1 year                                                                                      621           471            —             —
1–2 years                                                                                          279           238            —             —
2–3 years                                                                                          197           189            —             —
3–4 years                                                                                          158           123            —             —
4–5 years                                                                                          135           112            —             —
More than 5 years                                                                                  759           727            —             —
Total future fees for operating leases due for payment                                          2,149         1,860             —             —

Contractual commitments/commercial pledges:
                                                                                                                   Group
                                                                                                               Dec. 31, 2002
                                                                         Within 1 year       1–3 years         3–5 years   After 5 years           Total
Liabilities to financial institutions                                           2,377           5,716             2,065              20          10,178
Other interest-bearing liabilities                                                  5              23                 —               —              28
Financial leasing, agreements signed before 1997                                    8              16                16              52              92
Operational leasing                                                               621             476               293             759           2,149
Total contractual commitments/commercial pledges                                3,011           6,231             2,374             831          12,447


 Note 32           Supplementary cash-flow information
Transactions not affecting cash are as follows:
In addition to the reported investing and financing operations, as shown in the cash flow statement, the following transactions occurred that did not affect
cash.

In addition to reported investments and loan liabilities in cash flow, investments and the raising of loans through financial leasing amounted to SEK
66 million (2001: SEK 17 million), as well as amortization of loans through financial leasing in the amount of SEK –20 million (2001: SEK –22
million).
   During 2002, the Parent Company received a Group contribution from Tele2 Sweden amounting to SEK 3,035 million (2001: SEK 2,100 million)
and provided a shareholder contribution of SEK 400 million, which has not been reported as financial activities.
   In the Parent Company, the acquisition of shares in 2001 in Tele2 Russia Telecom BV and in OU Levicom Broadband, respectively, was conduct-
ed through a limited share issue of SEK 849 million and through loan financing at the seller amounting to SEK 134 million and is not included in
cash flow as investing or financing. On the acquisition date, the companies had cash of SEK 884 million and SEK 5 million, respectively, which is
reported in the cash flow as a reduction in investment.
   In addition to the reported sale of shares in subsidiaries in the cash flow in 2001, the Parent Company divested shares in OU Levicom Broadband
and Travellink AB for SEK 93 million to the subsidiary Tele2 Sverige AB.
   In addition to the reported sale of shares in subsidiaries, Tele2 AB’s subsidiary, Société Européenne de Communication S.A., was liquidated in
2001. This represented a net reduction of SEK 9,421 million, since the shares were booked at a value of SEK 23,385 million and the loss on
liquidation amounted to SEK 13,964 million.


68 T E L E 2 A N N U A L R E P O R T   2002
Cont. note 32

Cash flow statement based on net profit/loss:
                                                                                                     Group
                                                                                               2002             2001
Current operations
Net profit/loss for the year                                                                     223             392
Adjustment of items in profit/loss for the year that do not
  generate cash flow from current operations:
  Depreciation/Amortization                                                                    3,597           3,054
  Minority interest                                                                               –1              –1
  Profit/loss from shares in associated companies                                                 36             –33
  Deferred tax expense                                                                           525          –2,334
  Financial leasing                                                                               –9              –5
  Unpaid interest                                                                                107              88
  Write-down of shares                                                                            86              —
                                                                                               4,564           1,161
Change in working capital                                                                       –199            –748
Cash flow from current operations                                                              4,365             413

Investments according to the cash flow statement by market and operating area:
                                                                                                     Group
                                                                                                  Investments
                                                                                               2002             2001
Nordic                                                                                           902            1 029
Eastern Europe and Russia                                                                        594              328
Central Europe                                                                                   135              149
Southern Europe                                                                                  142              454
Luxembourg                                                                                        94              122
Branded products & other services                                                                 23               63
                                                                                               1,890            2,145
Change in long-term receivable                                                                     3               87
Acquisition/divestment of companies                                                              623             –765
Total investments according to cash flow statement                                             2,516            1,467

                                                                                                     Group
                                                                                                  Investments
                                                                                               2002             2001
Mobile telephony                                                                                 998              789
Fixed telephony and Internet                                                                     794            1,272
Cable-TV                                                                                          85               52
Data processing                                                                                   13               32
                                                                                               1,890            2,145
Change in long-term receivable                                                                     3               87
Acquisition/divestment of companies                                                              623             –765
Total investments according to cash flow statement                                             2,516            1,467

Additional information on segments is presented in Notes 33–34.


 Note 33         Market areas
The Group’s operations are primarily divided among six market areas: Nordic, Eastern Europe and Russia, Central Europe, Southern Europe,
Luxembourg and Branded products & services, which reflect internal reporting to the Board and executive management and the division of respon-
sibility and organization within the Group. Market control and prioritization is largely jointly undertaken for continental Europe, and thus goodwill and
depreciation/amortization attributable to the acquisition of the SEC Group is not broken down across market areas Central Europe, Southern Europe,
Luxembourg and Branded products & services.
   The Nordic market area is acting on a more mature market, while continental Europe has not pursued operations for an equally long period. The
Eastern Europe and Russia market area is yet another market with its own particular risks and possibilities. The division is based on the geographi-
cal location of operations, which also reflects where customers are located. Relations between companies within the Group are based on commercial
terms and conditions and pricing.
   The Nordic market area consists of Tele2 operations in Sweden, Norway, Denmark and Finland, Datametrix operation and ProcureITright. Optimal
Telecom are also included in the Nordic market area as of January 1, 2002, having previously been part of the Branded products & services market
area. The Eastern Europe and Russia market area encompasses Tele2 operations in the Baltic States (Estonia, Latvia and Lithuania), Poland, Czech


                                                                                                                                                     69
Cont. note 33
Republic and Russia as well as X-Source operations. The Central Europe market area comprises Tele2 operations in Germany, Netherlands, Switzerland,
Austria and a license in Ireland. The Southern Europe market area comprises Tele2 operations in France, Italy, Spain and Portugal. The Luxembourg
market area encompasses Tele2 operations in Liechtenstein and Luxembourg, plus the recently launched operations in Belgium, as well as 3C oper-
ations and Transac. The Branded products & services market area comprises Tele2 UK, C3-operations, Everyday operations and IntelliNet operations.

Operating revenue, operating profit before and after depreciation/amortization, as well as investments for the operating areas in each market area are
presented in Note 1, Note 2 and Note 32.

                                                                                             Group
                                                                                         Dec. 31, 2002
                                                         Eastern                                                Branded Non-distributed
                                                        Europe &        Central     Southern                   products and internal
                                               Nordic    Russia         Europe       Europe      Luxembourg    & services elimination        Total
Balance sheet
ASSETS
Intangible fixed assets                        1,025     3,491            46             2             177            4       20,351       25,096
Tangible fixed assets                          6,055     1,399           616           557             569           61           —         9,257
Shares in associated companies                   498        —             —             —               44           —            —           542
Other long-term securities                       103        36            —             —               —            —            —           139
Other financial fixed asets                    9,318       326           180           129           3,426           16      –12,056        1,339
                                              16,999     5,252           842           688           4,216           81        8,295       36,373

Current assets                                 5,008       813         1,591         2,074           1,806         313        –1,106       10,499
Total assets                                  22,007     6,065         2,433         2,762           6,022         394         7,189       46,872

LIABILITIES
Provisions                                        28        —             —             —               —           —             —            28
Interest-bearing liabilities                   9,931     4,140         1,523           680           5,195         976       –12,164       10,281
Long-term liabilities, other                      —          1            —            142               1          12          –156           —
Current liabilities, other                     3,274       651         2,402         2,297             637         422        –1,870        7,813
Total liabilities                             13,233     4,792         3,925         3,119           5,833       1,410       –14,190       18,122

                                                                                             Group
                                                                                             2002
                                                         Eastern                                                Branded Non-distributed
                                                        Europe &        Central     Southern                   products and internal
                                               Nordic    Russia         Europe       Europe      Luxembourg    & services elimination        Total
Income statement
Operating revenue
   external                                   13,566     2,320         5,689         8,105            754          848            —        31,282
   internal, other Group                          79        41           265           263             29           95          –772           —
   internal, market area                         585         8           113            47             87           61          –901           —
Operating revenue, total                      14,230     2,369         6,067         8,415            870        1,004        –1,673       31,282

Depreciation/amortization                     –1,435      –577          –133          –129            –92          –12        –1,219       –3,597
Operating expenses, other                     –9,410    –1,877        –6,348        –8,514           –747       –1,181         1,934      –26,143
Other operating revenue                           37        33           204             1              6            5          –236           50
Other operating expenses                         –43        16            –4            –3             –3           —            –25          –62
Operating profit/loss                          3,379       –36          –214          –230             34         –184        –1,219        1,530

Profit/loss on assoc. companies                  –31        –4             —             —             –1            —            —           –36
Profit/loss on fixed assets                                –86                                                                     2          –84
Other interest income, etc.                                                                                                      165          165
Interest expense, etc.                                                                                                          –779         –779
Profit/loss after financial items              3,348      –126          –214          –230             33         –184        –1,831          796

Tax on profit for the year                                                                                                      –574         –574
Minority interest                                                                                                                  1            1
Profit/loss for the year                       3,348      –126          –214          –230             33         –184        –2,404          223

Miscellaneous
Investments, intangible assets                   23        124            —             —              —             —                        147
Investments, tangible assets                    885        504           339           142             95            19         –219        1,765


70 T E L E 2 A N N U A L R E P O R T   2002
Cont. note 33
                                                                           Group
                                                                       Dec. 31, 2001
                                               Eastern                                        Branded Non-distributed
                                              Europe &    Central   Southern                 products and internal
                                     Nordic    Russia     Europe     Europe     Luxembourg   & services elimination      Total
Balance sheet
ASSETS
Intangible fixed assets              1,317    3,547         55         16              201        6      22,627         27,769
Tangible fixed assets                6,162    1,408        479        682              578      122          —           9,431
Shares in associated companies         251       75         —          —                —        —           —             326
Other long-term securities              80      122         —          —                —        —           —             202
Other financial fixed asets          9,935      577         —          —             4,331       —      –12,879          1,964
                                    17,745    5,729        534        698            5,110      128       9,748         39,692

Current assets                       4,459    2,554      1,367      2,027            2,643      590       –4,074         9,566
Total assets                        22,204    8,283      1,901      2,725            7,753      718        5,674        49,258

LIABILITIES
Provisions                             102       —          —          —                —        —           —             102
Interest-bearing liabilities        11,094    6,843      1,424      1,531            4,359    1,076     –14,473         11,854
Long-term liabilities, other             7        1         —          —                —        —           —               8
Current liabilities, other           3,970      659      2,243      3,045            1,393      631      –4,192          7,749
Total liabilities                   15,173    7,503      3,667      4,576            5,752    1,707     –18,665         19,713

                                                                             Group
                                                                             2001
                                               Eastern                                        Branded Non-distributed
                                              Europe &    Central   Southern                 products and internal
                                     Nordic    Russia     Europe     Europe     Luxembourg   & services elimination      Total
Income statement
Operating revenue
   external                         11,898    1,148      4,844      5,124             663     1,408           —         25,085
   internal, other Group               226       33        396        444              74        84       –1,257            —
   internal, market area               242       —         124         23              49        84         –522            —
Operating revenue, total            12,366    1,181      5,364      5,591             786     1,576       –1,779        25,085

Depreciation/amortization           –1,011     –447        –101        –96           –118       –36       –1,245     –3,054
Operating expenses, other           –8,760     –907      –5,968     –6,923           –777    –1,986        1,820    –23,501
Other operating revenue                198        9          15          2              3         4          –42        189
Other operating expenses               –36      –11         –17         –1             –7        –4            1        –75
Operating profit/loss                2,757     –175        –707     –1,427           –113      –446       –1,245     –1,356

Profit/loss on assoc. companies        –58        —          —          —              91         —           —             33
Profit/loss on fixed assets                                                                                    4             4
Other interest income, etc.                                                                                   65            65
Interest expense, etc.                                                                                      –690          –690
Profit/loss after financial items    2,699     –175       –707      –1,427            –22      –446       –1,866        –1,944

Tax on profit for the year                                                                                 2,335         2,335
Minority interest                                                                                              1             1
Profit/loss for the year             2,699     –175       –707      –1,427            –22      –446          470           392

Miscellaneous
Investments, intangible assets           1       –2          2         15               1        —                          17
Investments, tangible assets         1,094      363        151        442             125        66          –32         2,209


                                                                                                                                 71
Note 34           Operating areas
A secondary division of operations takes the form of a grouping into four operating areas: Mobile telephony, Fixed telephony & Internet, Cable-TV and
Data processing, which is based on services and products that differ from each other in terms of risks and possibilities.
   The Fixed telephony & Internet operating area includes fixed telephony as well as the Dial-up and DNS data services. The Cable-TV operating area
encompasses broadband services, Cable-TV, the radio station Tango Sunshine and Tango TV. The Data processing operating area includes IT-out-
sourcing via X-source, as well as system integration through Datametrix, Internet payments, credit card transactions and call phone services via 3C,
data processing of card transactions and invoicing through Transac, cash cards for fixed telephony through C3 and the Internet portal, Everyday.
   It is not practically possible to distribute financial fixed assets and current assets by operating area. Operating revenue, operating profit before and
after depreciation/amortization, as well as investments of the operating areas in each market area are presented in Note 1, Note 2 and Note 32.

                                                                                                       Group
                                                                                                   Dec. 31, 2002
                                                                                                                              Non-dist. and
                                                               Mobile      Fixed telephony                          Data         internal
                                                             telephony        & Internet       Cable-TV          processing    elimination       Total
Balance sheet
Intangible fixed assets                                        3,687           1,014                3                 41        20,351          25,096
Tangible fixed assets                                          4,232           4,226              736                 63            —            9,257
Financial fixed assets                                                                                                           2,020           2,020
Current assets                                                                                                                  10,499          10,499
Total assets                                                   7,919           5,240              739               104         32,870          46,872

                                                                                                         Group
                                                                                                         2002
                                                                                                                              Non-dist. and
                                                               Mobile      Fixed telephony                          Data         internal
                                                             telephony        & Internet       Cable-TV          processing    elimination       Total
Income statement
Operating revenue from external customers                      9,819          20,843              298               322               —         31,282

Miscellaneous
Investments in intangible assets                                 121               26               —                 —               —            147
Investments in tangible assets                                   901              763               88                13              —          1,765

                                                                                                       Group
                                                                                                   Dec. 31, 2001
                                                                                                                              Non-dist. and
                                                               Mobile      Fixed telephony                          Data         internal
                                                             telephony        & Internet       Cable-TV          processing    elimination       Total
Balance sheet
Intangible fixed assets                                        4,188             948                4                  2        22,627          27,769
Tangible fixed assets                                          4,345           4,285              744                 57            —            9,431
Financial fixed assets                                                                                                           2,492           2,492
Current assets                                                                                                                   9,566           9,566
Total assets                                                   8,533           5,233              748                 59        34,685          49,258

                                                                                                         Group
                                                                                                         2001
                                                                                                                              Non-dist. and
                                                               Mobile      Fixed telephony                          Data         internal
                                                             telephony        & Internet       Cable-TV          processing    elimination       Total
Income statement
Operating revenue from external customers                      7,615          16,937              172               361               —         25,085

Miscellaneous
Investments in intangible assets                                  –2              18                —                  1              —             17
Investments in tangible assets                                   841           1,280                57                31              —          2,209


72 T E L E 2 A N N U A L R E P O R T   2002
Note 35        Transactions with related parties
As a result of its substantial direct and indirect shareholdings in the Tele2 Group, Invik Group, Kinnevik Group, Transcom Worldwide Group, Millicom
Group, XSource Corporation Group, MTG Group, Metro Group and other companies, the Stenbeck family has the potential to exert considerable influ-
ence in terms of financial and operational decisions regarding operations in these companies. These companies has been regarded as related parties
to Tele2. Business relations between Tele2 and all closely related parties are subject to commercial terms and conditions.

Significant transactions in recent years:
• At year-end 1998, Tele2 acquired 48% of Tele2 Eesti (formerly Ritabell AS), with mobile operations in Estonia, from Millicom.
• In November 1999 Tele2 sold its shareholding (24.8%) in the associated company Netcom ASA, a mobile telephony company in Norway, to SEC
  in return for 17.8% in SEC. SEC gradually divested Netcom ASA during under 1999 and 2000.
• In August 2000, via a limited share issue corresponding to SEK 19,773 million, Tele2 acquired an additional 81.9% of SEC, which pursues fixed
  telephony operations in continental Europe and mobile telephony operations in Luxembourg, etc., from Millicom.
• During 2000 Tele2 divested its holding in 4T Solutions, with billing systems operations, to XSource Corporation in return for 11.88% of XSource
  Corporation.
• In January 2001, Tele2 Group divested its 37.45% holding in the associated company Transcom Worldwide to Industriförvaltings AB Kinnevik.
  Transcom Worldwide is one of Europe’s largest customer service companies. The purchase price was based on the market share price 60 trading
  days after Transcom Worldwide was listed on the Stockholm Stock Exchange.
• In December 2001, Tele2 Group acquired shares in Tele2 Russia Telecom BV from Millicom through a limited shares issue corresponding to a
  value of SEK 849 million. Tele2 Russia Group conducts mobile operations in Russia.

Transactions in 2002:
• In October 2002, the Tele2 Group acquired all shares in the ProcureITright Group, a supplier of procurement function services and WEB-based
   procurement systems, from XSource Corporation Group for SEK 42 million.

Operational agreements between Tele2 and related parties:
Tele2 supplies telephony and data services on commercial terms to closely related corporate groups.

Invik Group:
• Tele2 Group’s telephony operates are, with the exception of Russian operations, insured by Moderna Försäkringar AB.
• Banque Invik conducts certain financial services for the Tele2 Group. Bankque Invik is also a credit supplier and conducts credit transactions that
  arise using the equipment of 3C-operations.

Kinnevik Group:
• CIS Credit International Service AB provides Tele2 with debt collection services.
• Collect Sweden AB is a company that managed a fidelity program and provided multi-bonus cards and was also in charge of marketing and man-
  agement of benefit and offers within the framework of the Collect multi-bonus program. Collect is now being phased out.

Transcom Worldwide Group:
• Transcom provides customer services and telemarketing for Tele2.

Millicom Group:
• Millicom Group purchases certain consulting services from the Tele2 company ProcureITright.

XSource Corporation Group:
• Savera Systems Incorporated and its sister company Basset AB supplies Tele2 with operator billing systems. Savera also supplies Tango with an
  invoicing system for cash cards.
• NetCom Consultants AB supplies Tele2 with consulting services in tele and data communications.

MTG Group:
• Tele2 buys advertising time on radio and TV channels owned by MTG.
• Tele2 Sverige AB purchases cable TV programs from TV1000 Sverige AB.

Other related companies:
• Viking Telecom provides Tele2 with most of the line routers that Tele2 supplies to its end customers.


                                                                                                                                                 73
Cont. note 35
Transactions between Tele2 and related parties:
                                                                                     Group
                                                           Operating revenues                  Operating costs
                                                         2002              2001              2002           2001
Invik Group                                                —                 10                124             10
Kinnevik Group                                             11                 1                132            387
Transcom Worldwide Group                                   23                20              1,860          2,031
Millicom Group                                             17                16                 14              7
XSource Corporation Group                                   7                 9                266            236
MTG, Modern Times Group                                    28                32                108            163
Metro International Group                                   3                 2                  4              5
Other related companies                                     5                 1                102            140
Total                                                      94                91              2,610          2,979

                                                                                     Group
                                                          Interest revenue                    Interest costs
                                                         2002              2001              2002              2001
Invik Group                                                97                —                131                —
Total                                                      97                —                131                —

                                                                                Group
                                                       Materials & supplies                  Restricted cash
                                                  Dec. 31, 2002 Dec. 31, 2001 Dec. 31, 2002 Dec. 31, 2001
Invik Group                                                  —             —            841           897
Kinnevik Group                                                1            —             —             —
XSource Corporation Group                                    —              2            —             —
MTG, Modern Times Group                                       7            —             —             —
Other related companies                                       5            39            —             —
Total                                                        13            41           841           897

                                                                                Group
                                                       Acc. receivable, etc.                 Other liabilities
                                                  Dec. 31, 2002 Dec. 31, 2001 Dec. 31, 2002 Dec. 31, 2001
Invik Group                                                  —              1            —             —
Kinnevik Group                                                9            —             —             78
Transcom Worldwide Group                                      2             6            —             —
Millicom Group                                                8            20            —            113
XSource Corporation Group                                     2            69            20            17
MTG, Modern Times Group                                      53            45            —             —
Other related companies                                       8             1            39            47
Total                                                        82           142            59           255

                                                                                Group
                                                    Liabilities to suppliers, etc.           Other liabilities
                                                  Dec. 31, 2002 Dec. 31, 2001 Dec. 31, 2002 Dec. 31, 2001
Invik Group                                                 124            11           755           881
Kinnevik Group                                               23            43            —             —
Transcom Worldwide Group                                    188           267            —             —
Millicom Group                                               —             43            —             —
XSource Corporation Group                                    39            93             5            —
MTG, Modern Times Group                                      17            27            —             —
Metro International Group                                     2            —             —             —
Other related companies                                      63            98            23            30
Total                                                       456           582           783           911


74 T E L E 2 A N N U A L R E P O R T   2002
Note 36         Customers
Operating area by market area:                                                                          Group
                                                                        Number of customers                            Net customer intake
(thousands)                                                         Dec. 31, 2002 Dec. 31, 2001          change           2002           2001

Nordic:
Mobile telephony                                                           3,221         2,642             22%             579             517
Fixed telephony and Internet                                               2,822         3,632            –22%            –810             285
Cable-TV                                                                     209            —                —             209              —
Total, Nordic                                                              6,252         6,274              0%             –22             802

Eastern Europe and Russia:
Mobile telephony                                                           1,366            853               60%          513             576
Fixed telephony and Internet                                                 144             77               87%           67              76
Cable-TV                                                                      64             66               –3%           –2              66
Total, Eastern Europe and Russia                                           1,574            996               58%          578             718

Central Europe:
Mobile telephony                                                             271            48            465%             223              16
Fixed telephony and Internet                                               3,316         3,143              6%             173             473
Total, Central Europe                                                      3,587         3,191             12%             396             489

Southern Europe:
Fixed telephony and Internet                                               5,129         4,286                20%          843           1,344
Total, Southern Europe                                                     5,129         4,286                20%          843           1,344

Luxembourg:
Mobile telephony                                                             181            167                8%            14               42
Fixed telephony and Internet                                                  41             44               –7%            –3                9
Total, Luxembourg                                                            222            211                5%            11               51

Total, by market area                                                    16,764         14,958                12%        1,806           3,404

                                                                                                      Group
                                                                        Number of customers                             Net customer intake
(thousands)                                                         Dec. 31, 2002 Dec. 31, 2001          change           2002            2001
Mobile telephony                                                           5,039         3,710             36%           1,329           1,151
   of which, cash cards                                                    3,363         2,179             54%           1,184              —
Fixed telephony and Internet                                              11,452        11,182              2%             270           2,187
Cable-TV                                                                      273            66           314%             207              66
Total, by business area                                                   16,764        14,958             12%           1,806           3,404

Effective 2002, the number of active customers in Sweden and Denmark complies fully with the Group’s definition of an active customer. As a result
of this adjustment and the effect of the merger with Optimal Telecom, the number of customers in Sweden for fixed telephony and Internet has been
aligned by a one-off adjustment of –197,000 and the number of mobile telephony customers has been adjusted by +80,000. In addition, the num-
ber of Cable-TV customers was reported for the first time in 2002, which has resulted in an adjustment of +189,000. In the case of Denmark, a one-
off adjustment has been applied to fixed telephony and Internet during 2002 in an amount of –461,000. During 2001, the acquisition of Tele2
Russia and the Levicom Group meant that the number of customers rose by a total of 296,000.
   Net customer intake in 2002, before the above one-off adjustment, amounted to 15%, corresponding to 2,195,000 (2001: 3,108,000) customers.


                                                                                                                                               75
Note 37           Number of employees
                                                                                                                 Group
                                                                                                  2002                             2001
                                                                                                       Average number of employees
                                                                                             Total of whom, men           Total of whom, men
Nordic                                                                                      1,169           70%          1,126          70%
Eastern Europe and Russia                                                                   1,456           52%            602          49%
Central Europe                                                                                116           59%            122          61%
Southern Europe                                                                                95           65%             81          65%
Luxembourg                                                                                    231           68%            189          83%
Branded products & services                                                                    48           83%             52          73%
Total, by market                                                                            3,115           61%          2,172          65%

The average number of employees in the Parent Company is 3 (2001: 2), all of whom are men. The average number of employees for each year for
acquired companies is reported in relation to the period of time they have been part of the Tele2 Group. Tele2 Russia was acquired in December 2001.


 Note 38           Personnel costs
                                                                                                    Group
                                                                            2002                                           2001
                                                      Salaries and Social security of which, pen-     Salaries and Social security of which, pen-
                                                     remuneration       expenses sion expenses       remuneration       expenses sion expenses
Board and President                                             67            20                5               52            13                3
Other employees                                               995            303              59              870            254              50
Total, personnel costs                                      1,062            323              64              922            267              53

                                                                                              Parent Company
                                                                            2002                                           2001
                                                      Salaries and Social security of which, pen-     Salaries and Social security of which, pen-
                                                     remuneration       expenses sion expenses       remuneration       expenses sion expenses
Board and President                                             13              6               1               11              4               2
Other employees                                                  4              1              1                 2              1              —
Total, personnel costs                                          17              7              2                13              5               2

Salaries and remuneration for each year for acquired companies is reported in relation to the period they have been part of the Tele2 Group. Tele2
Russia was acquired in December 2001. Note 37 shows the workforce.

                                                                                                             Pension expenses
                                                                                                  Group                      Parent Company
                                                                                            2002             2001           2002             2001
Defined-benefit pension plans                                                                 20                4             —                —
Defined-contribution pension plans                                                            44               49              2                2
Total, pension expenses                                                                       64               53              2                2

In the case of defined-benefit plans, the company assumes the risk and responsibility on the pension payout date. In the case of defined-contribu-
tion plans, the company is not exposed to risk on the pension payout date.
                                                                                                     Group
                                                                             2002                                           2001
                                                                  Salaries and remuneration                      Salaries and remuneration
                                                            Board        of which,         Other        Board            of which,        Other
                                                     and President        bonuses      employees and President            bonuses     employees
Nordic                                                         27               3           573            22                   2          539
Eastern Europe and Russia                                      21               2           150             5                   —           78
Central Europe                                                   7              1            73              6                  —           63
Southern Europe                                                  4              1            54              3                  1           50
Luxembourg                                                       1              —           112              9                  —          104
Branded products & services                                     7               1            33              7                  1           36
Total, by market                                               67               8           995            52                   4          870

In 2002, provision of SEK 16 million ( 2001: SEK 15 million) was made for bonuses to key personnel in the Group, plus social security expenses of
SEK 5 million (2001: SEK 5 million). Distribution of the amount will be decided in 2003.


76 T E L E 2 A N N U A L R E P O R T   2002
Cont. note 38
Remuneration of senior executives:
The group “Other senior executives” consists of 13 people (2001: 13). In addition to the costs below, Tele2 also incurred costs relating to social
security expenses.

                                                                                           2002
                                     Basic salary/        Variable          Options       Other           Other         Pension           Total
                                       Board fee      remuneration          program     benefits    remuneration          costs    remuneration
Chairman of the Board:
Jan Hugo Stenbeck                             0.1                                                            6.8                            6.9
Bruce Grant                                   0.2                                                             —                             0.2

Group President and CEO:
Lars-Johan Jarnheimer                        10.0              1.5              1.0          0.0               —             1.9           14.4

Other senior executives                      21.8             10.3             13.5          1.3              —              1.3           48.2
                                             32.1             11.8             14.5          1.3             6.8             3.2           69.7


                                                                                                     2002
                                                       Previous years                       Allocation for the year                       Total
                                                     Options program                     Warrant program 2002/2005
                                                                                           Market
                                                                                         value on     Acquisition
                                                           Number            Number      issuance           price        Benefit        Number
Group President and CEO                                        —         15,000 pcs           1.0              —            1.0     15,000 pcs
Other senior executives                                        —        195,000 pcs          13.5              —           13.5    195,000 pcs
                                                               —         210,000 pcs         14.5              —           14.5     210,000 pcs

                                                                                           2001
                                     Basic salary/        Variable          Warrant       Other           Other         Pension           Total
                                       Board fee      remuneration          program     benefits    remuneration          costs    remuneration
Chairman of the Board:
Jan Hugo Stenbeck                             0.3                                                              —                            0.3

Group President and CEO:
Lars-Johan Jarnheimer                         7.6              1.6               —           0.0               —             1.3           10.5

Other senior executives                      18.9             10.4               —           1.1               —             1.0           31.4
                                             26.8             12.0               —           1.1               —             2.3           42.2

Board of Directors:
Board chairman Jan Hugo Stenbeck passed away during the year and Board member Bruce Grant was appointed Chairman in August. Total Board
fees of SEK 1.9 million were paid compared with SEK 2.1 million decided of the Annual General Meeting of shareholders.
   During the year, the parent company paid SEK 6.8 million to acompany owned by Jan Hugo Stenbeck, for consultations regarding services that can-
not be regarded as Board work. In addition Tele2 Group paid SEK 8.7 million (2001: SEK 17.3 million) to a company partly owned by Bruce Grant, for
consultations regarding services that cannot be regarded as Board work.

President and CEO:
In addition to a fixed salary, Lars-Johan Jarnheimer, President and CEO of Tele2, received a bonus of SEK 1.5 million (2001: SEK 1.6 million). The
bonus is based on individualized goals. The pension premium, which is defined-contribution, is paid in the form of 20% of the fixed basic salary.
The pension age is 65. The period of notice when served by the company is a minimum 12 and maximum 18 months in the case of the President of
Tele2 AB. Salary during a period of notification of 12 months is paid to the President if he serves notice of termination of employment to the com-
pany. Salary and remuneration for the President are determined annually by the Board of Directors following proposals by the Chairman of the Board.

Other senior executives
Variable salary paid to other senior executives includes a bonus of 0% –35% based on profit benchmarks, with the remainder being based on indi-
vidualized goals. Other benefits pertain primarily to car benefits. Pensions are paid in accordance with the public pension plan, of which SEK 1.1
million (2001: SEK 0.2 million) represents a defined-contribution plan and SEK 0.2 million (2001. SEK 0, 2 million) is a defined-benefit plan. The
pension age is 65. The period of notice when served by the company is a minimum 6 and maximum 12 months. Salary during a period of notifica-
tion of six months is received if the person serves notice of termination of employment to the company. Not other remuneration is paid.


                                                                                                                                                  77
Cont. note 38
Incentive program 1997–2006
At the Annual General Meeting in 1997, it was decided to undertake an incentive program for a number of the senior executives employed at that
time and future senior executives in the Group. Through a company established for this purpose, NC Intressenter AB, these persons were provided
with the opportunity to acquire 100,000 shares per year during 1999–2003, up to a maximum total amount of 500,000 Series B shares. In October
2000, 200,000 shares were issued and three convertible-debenture notes corresponding to 300,000 shares were issued to NC Intressenter to ful-
fill the offer. At December 31, 2002, NC Intressenter held 400,000 Series B shares and a convertible debenture note corresponding to 100,000
Series B shares. The premium for the option amounted to SEK 7 million in 1997. This was based on a Black-Schole evaluation and an exercise price
of SEK 150 per share. In their turn, all partners in NC Intressenter made payments to NC Intressenter based on the Black-Schole evaluations.
    On December 31, 2002, Invik & Co AB owned 42% of the shares in NC Intressenter. Invik & Co AB is not entitled to sell or transfer these shares
without the permission of Tele2 AB.

Incentive Program 2002–2007
At the Annual General Meeting in 2002, it was decided to undertake an incentive program corresponding to a maximum of 1,055,000 for current
and future key employees of the Group. These persons are to be offered the opportunity, via warrants, to subscribe for Series B shares during a period
of three to five years after allotment, at a price totaling the market value of the Series B share plus 10% at the time of allotment, on condition that
they remain employed by the Group. No premium is to be paid. At December 31, 2002, allotments corresponding to 663,000 shares had been imple-
mented. All of these had a redemption price of SEK 191. In addition, allotments corresponding to 153,700 shares had been made to a wholly owned
Group company to secure the future cash flow for social insurance costs.


 Note 39           Auditors
                                                                     Group                                                 Parent Company
                                                         2002                       2001                        2002                        2001
                                                              Other                       Other                       Other                       Other
                                                  PWC       auditors          PWC       auditors         PWC        auditors          PWC       auditors
Audit assignments*                                 17              4           18              1           1              —             1             —
Other assignments                                  13              4           13              3           6              —             8              2
                                                   30             8            31              4           7              —             9              2
Total                                                            38                          35                            7                         11
* Auditing assignments = examination of the annual report and the accounts as well as the administration by the Board and the President. All other is other
  assignments.


78 T E L E 2 A N N U A L R E P O R T   2002
Note 40         The United States generally accepted accounting principles (US GAAP)

The consolidated balance sheets and income statements are drawn up in accordance with Swedish accounting principles. These differ in certain
respects from generally accepted accounting principles in the United States (US GAAP).
   The following adjustments are required for reporting profit/loss for the year and shareholders' equity in line with US GAAP.

Profit/loss for the year:
                                                                                                                                     Group
                                                                                                                     2002            2001             2000
Profit/loss for the year according to Swedish accounting principles:                                                  223             392             –396

Adjustments required for compliance with US GAAP.
a) Transactions between companies under common control                                                                  9               21               24
b) Amortization of goodwill                                                                                         1,512               —                —
c) Lease agreements                                                                                                     1                2                3
d) Tangible fixed assets                                                                                              –81                9               31
e) Stock options                                                                                                        9                5             –196
f) Software development cost                                                                                           —                —                80
g) Accounting for step acquisitions                                                                                    —                –8             –317
h) Accounting for acquisitions                                                                                         25             –367             –104
i) Deferred tax liability                                                                                              —               828               —
j) Alecta refund                                                                                                       —                —                –8
k) Changes in accounting principles                                                                                    —              –156               21
l) Hedge accounting                                                                                                     1               –2               —
Net adjustment                                                                                                      1,476              332             –466

Deferred tax effect on above, US GAAP adjustments                                                                      –7               39              –38
Profit/loss for the year according to US GAAP                                                                       1,692              763             –900

Earnings per share:
                                                                                                                                      Group
                                                                                                                 2002        2001        2000
Profit/loss or the year according to US GAAP                                                                     1,692         763        –900
Number of shares, weighted average                                                                         147,360,175 145,003,847 114,087,366
Earnings per share                                                                                           SEK 11.48    SEK 5.26   SEK –7.89

Profit/loss or the year according to US GAAP                                                                        1,692              763             –900
Reversal: interest after tax on convertibles during the year                                                           —                —                —
Adjusted earnings for the year after full dilution                                                                  1,692              763             –900

Number of outstanding shares after full dilution, weighted average*                                        147,596,866 145,215,999 114,087,366
Earnings per share after full dilution                                                                       SEK 11.46    SEK 5.25   SEK –7.89
* In contrast to Swedish accounting principles, US GAAP does not calculate earnings per share after dilution at the present value of the exercise price for the
  options.


Adjusted profit/loss for the year:
                                                                                                                                      Group
                                                                                                                    2002             2001             2000
Profit/loss for the year according to US GAAP                                                                       1,692              763            –900
Reversal: amortization of goodwill                                                                                     —             1,845             610
Adjusted profit/loss for the year according to US GAAP                                                              1,692            2,608            –290


                                                                                                                                                            79
Cont. note 40
Adjusted earnings per share:
                                                                                                                                     Group
                                                                                                                 2002        2001        2000
Profit/loss or the year according to US GAAP                                                                     1,692         763        –900
Reversal: amortization of goodwill                                                                                  —        1,845         610
Adjusted earnings for the year                                                                                   1,692       2,608        –290
Number of shares, weighted average                                                                         147,360,175 145,003,847 114,087,366
Adjusted earnings per share                                                                                  SEK 11.48   SEK 17.99   SEK –2.54

Profit/loss or the year according to US GAAP                                                                     1,692         763        –900
Reversal: interest after tax on convertibles during the year                                                        —           —           —
Reversal: amortization of goodwill                                                                                  —        1,845         610
Adjusted earnings for the year after full dilution                                                               1,692       2,608        –290
Number of outstanding shares after full dilution, weighted average*                                        147,596,866 145,215,999 114,087,366
Adjusted earnings per share after full dilution                                                              SEK 11.46   SEK 17.96   SEK –2.54
* In contrast to Swedish accounting principles, US GAAP does not calculate earnings per share after dilution at the present value of the exercise price for the
  options.


Shareholders' equity:
                                                                                                                                    Group
                                                                                                            Dec. 31, 2002 Dec. 31, 2001 Dec. 31, 2000
Shareholders' equity according to Swedish accounting principles                                                   28,728        29,517        26,539

Adjustments required for compliance with US GAAP:
a) Transactions between companies under common control                                                                –18              –27              –47
b) Amortization of goodwill                                                                                         1,512               —                —
c) Lease agreements                                                                                                    14               13               11
d) Tangible fixed assets                                                                                              –21               60               51
e) Stock options                                                                                                       –4              –25              –30
g) Accounting for step acquisitions                                                                                  –103             –102              –94
h) Accounting for acquisitions                                                                                      6,500            6,630            6,592
i) Deferred tax liability                                                                                              —                —              –828
j) Alecta refund                                                                                                        2               –7               –7
k) Changes in accounting principles                                                                                    —                —               156
l) Hedge accounting                                                                                                    —                –2               —
Net adjustment                                                                                                      7,882            6,540            5,804
Deferred tax effect on above US GAAP adjustments                                                                      –32              –16              –54
Shareholders' equity according to US GAAP                                                                          36,578           36,041           32,289


Change in shareholders' equity:
                                                                                                                                    Group
                                                                                                            Dec. 31, 2002 Dec. 31, 2001 Dec. 31, 2000
Opening shareholders' equity, Jan. 1, according to US GAAP                                                        36,041        32,289         5,772

Items reported directly against shareholders' equity
Gradual acquisitions                                                                                                   —                –8              –33
Exchange-rate difference, according to US GAAP                                                                     –1,181            2,144              785
Total items reported directly against shareholders' equity                                                         –1,181            2,136              752

Other changes in shareholders' equity
New share issue, acquisition of SEC according to US GAAP                                                               —                —           26,628
New share issue, acquisition of Tele2 Russia, according to US GAAP                                                     —              838               —
New share issue, convertibles, according to US GAAP                                                                    26               15              37
Profit/loss for the year, according to US GAAP                                                                      1,692             763             –900
Closing shareholders' equity, Dec. 31, according to US GAAP                                                        36,578           36,041          32,289


80 T E L E 2 A N N U A L R E P O R T   2002
Cont. note 40
Deferred tax liability/asset:
                                                                                                                      Group
                                                                                                                2002             2001
Deferred tax liability/asset, according to Swedish acc. principles                                              1,246            1,764
Deferred tax, adjustment according to US GAAP                                                                     –32              –16
Total deferred tax liability (–)/asset (+) according to US GAAP                                                 1,214            1,748


Extract from consolidated balance sheet:
                                                                                                     Group
                                                                  Swedish
                                                            accounting principles             Adjustment items                     US GAAP
                                                       Dec. 31, 2002 Dec. 31, 2001 Dec. 31, 2002 Dec. 31, 2001 Dec. 31, 2002 Dec. 31, 2001
Fixed assets                                                 36,373        39,692         7,952         6,612        44,325        46,304
Current assets                                               10,499         9,566             —             —        10,499         9,566
Total assets                                                 46,872        49,258         7,952         6,612        54,824        55,870

Shareholders' equity                                          28,728          29,517            7,850           6,524          36,578           36,041
Minority interest                                                 22              28               —               —               22               28
Long-term liabilities                                          7,927          11,082               97              80           8,024           11,162
Current liabilities                                           10,195           8,631                5               8          10,200            8,639
Total shareholders' equity and liabilities                    46,872          49,258            7,952           6,612          54,824           55,870

Explanation of current differences between Swedish accounting principles and US GAAP:
The account below presents a description of the adjustments that must be made to report Tele2 Group’s profit/loss for 2000, 2001 and 2002 and
shareholders’ equity as of December 31, 2000, 2001 and 2002 in accordance with US GAAP.

a) Transactions between companies under common control
   In 1993 and 1994, the company acquired Tele2 and Comviq from the Industriförvaltnings AB Kinnevik Group. The acquisition method was used
   to report the transactions. Accordingly, the difference between the acquisition value and market value of net assets was reported as goodwill.
   According to US GAAP, acquisitions of operations from “jointly owned companies” should be conducted at historical values. Thus, as a US GAAP
   adjustment, all re-evaluations of plants, materials and supplies, goodwill, etc. that arise on the transaction date are eliminated and the resulting
   depreciation/amortization is reversed.

b) Amortization of goodwill
   According to Swedish accounting principles, all intangible fixed assets, including goodwill, must be amortized. Amortization rates are based on
   the acquisition value of the fixed assets and the estimated utilization period. According to US GAAP, effective 2002, goodwill and certain other
   intangible assets need not be amortized but may instead be tested, at least annually, to identify any impairment loss. Accordingly, this year’s amort-
   ization of these assets under Swedish GAAP is reversed and instead a potential write-down based on the completed impairment test is recognized.

c) Lease agreements
   The Group has certain leasing transactions which, according to generally accepted accounting principles in Sweden, have been treated as operat-
   ing leases, but which, according to US GAAP, are viewed as finance leases.

d) Tangible fixed assets
   Certain costs have been capitalized in accordance with Swedish accounting principles should be expensed according to US GAAP. According to
   US GAAP, certain costs attributable to installations of networks are capitalized and not expensed.

e) Stock options
   According to US GAAP, as a result of the terms and conditions of the options programs in 1997, a liability is calculated based on the market value
   of the underlying shares. According to US GAAP, the commitments to employees should not be dissolved. Commitments to others should be val-
   ued at the value of the option on the date on which the decision was made to settle it through a new share issue and report it directly against
   shareholders’ equity.

f) Software development cost
   Through 1999, Tele2 has capitalized development costs for software for external sales. According to US GAAP, this should be expensed and depre-
   ciation attributable to capitalization be reversed until the product is technically finalized. As a result of the sale of 4T Solutions AB in 2000, there
   is currently no difference vis-a-vis US GAAP.


                                                                                                                                                       81
Cont. note 40
g) Accounting for step acquisitions
   The gradual acquisitions of OU Levicom and Société Européene de Communications S.A. during 1999–2001 has, according to Swedish account-
   ing principles, resulted in a restatement of adjustment of shareholders’ equity corresponding to shares in profit of the holdings from the original
   acquisition date based on the equity method rather than historical acquisition values. According to US GAAP, not only should shareholders’ equity
   be adjusted against the share in profit/loss but also goodwill and depreciation should be taken into account from the original acquisition date.

h) Accounting for acquisitions
   The acquisition of Société Européene de Communications S.A. in 2000 was conducted via a non-cash share issue, in which newly issued shares
   in Tele2 were offered in exchange for the outstanding shares in Société Européene de Communications S.A. According to Swedish accounting prin-
   ciples, the acquisition price is calculated at a value corresponding to the share price of Tele2 on the transaction date. According to US GAAP, the
   acquisition price should be set at the share price on the date at which the offer was announced. There are also certain differences between acquired
   net assets according to US GAAP and Swedish accounting principles.

i) Deferred tax liability
   According to US GAAP, deferred taxes should be reported for all temporary differences apart from certain exceptions. The reversal of deferred tax
   liabilities as a result of changes in circumstances is done restrictively. According to Swedish accounting principles, changes in circumstances can
   be taken into account in the assessment. In conjunction with the liquidation of Société Européene de Communications S.A. in 2001, there was
   no longer any differences vis-a-vis US GAAP.

j) Alecta refund
   According to Swedish accounting principles, the value of the refund received by Tele2 from Alecta should be reported via the income statement
   in 2000. According to US GAAP, only the cash portion received should be reported as income.

k) Changes in accounting principles
   According to Swedish accounting principles, changes in accounting principles are reported through a recalculation of the opening shareholders’
   equity as if the new principles had been applied already when the transaction arose. According to US GAAP, the change is reported across the
   income statement when changes in principles are made.

l) Hedge accounting
   According to US GAAP, to qualify a hedge for accounting purposes, the hedge has to comply with very strict criteria in terms of the documenta-
   tion of hedge relationship with hedged item and proof of its effectiveness. Swedish accounting principles does not require compliance with this
   strict criteria. Effective 2002, these requirements are fulfilled and thus there is no difference vis-à-vis US GAAP.

Stock options:
In accordance with Swedish accounting principles, the option liability for the 1997 incentive program was dissolved in its entirety in 2000 as a result
of the decision to settle the option through an issue of convertibles. According to US GAAP, depending on the conditions of the option program, a
liability should be calculated based on the difference between the market value of the underlying shares and the exercise price. During 2002, stock
options were issued as part of a new incentive program. This program is not reported as an expense in the income statement. A valuation in accor-
dance with the Black-Scholes option model would have the following effect on profit/loss according to US GAAP. The calculation is based on a risk-
free rate of interest of 4.7% (2001: 5.0%), no dividend (due to the uncertainty as to whether or not the Board will propose a dividend), volatility of
57.9% (2001: 45.5%) and the fact that the options expire on April 20, 2003 and September 1, 2005.

                                                                                                                              Group
                                                                                                            2002             2001           2000
Profit/loss for the year, reported as above                                                                 1,692             763            –900
Adjusted earnings per share after full dilution                                                         SEK 11.46         SEK 5.25      SEK –7.89

Profit/loss for the year, pro forma                                                                         1,687             760            –904
Adjusted earnings per share after full dilution                                                         SEK 11.43         SEK 5.23      SEK –7.92

Advertising expenses:
Total advertising expenses for the year amount to SEK 979 million (2001: 1,031 million and 2000: 630 million).

Critical accounting principles according to US GAAP:
The presentation below shows the accounting principles that are based on the most cricital assessments and estimates used in drawing up the accounts
in line with US GAAP, and which differ from the preparation of financial reports in accordance with Swedish accounting principles:
• When assessing the need for future write-down requirements for intangible and tangible fixed assets, Swedish accounting principles indicate that
  a future discounted cash flow be calculated and compared with the book value. Swedish accounting principles stipulate the application of sched-
  ule amortization of goodwill. In contrast, according to US GAAP, a non-discounted cash flow is to be calculated. No further amortization of good-
  will should be applied according to US GAAP as of 2002.


82 T E L E 2 A N N U A L R E P O R T   2002
Effects of new US GAAP accounting pronouncements:
In June 2001, the Financial Accounting Standards Board (FASB) issued a Statement of Financial Accounting Standards No. 143 (SFAS 143), enti-
tled ”Accounting for Asset Retirement Obligations”. SFAS 143 states when and how accounting for liabilities and expenses attributable to the retire-
ment o fixed assets should be done. Tele2 will apply SFAS 143 as of January 1 2003. The application of this statement is not expected to have any
significant effect on Tele2's earnings and financial position.
   In November 2002 FASB issued FASB Interpretation No. 45 (FIN 45), “Guarantor’s Accounting and Disclosure Requirements for Guarantees,
Including Indirect Guarantees of Indebtedness of Others.” FIN 45 requires that a liability should be reported at the fair value of assumed commit-
ments in accordance with certain guarantee agreements on the date on which a company issued a guarantee. The provisions shall be applied with
effect for guarantees that were issued or changed after December 31, 2002.


                                                          Stockholm, February 24, 2003


                                                                   Bruce Grant
                                                                     Chairman


                      Lars-Johan Jarnheimer                                                                Marc Beuls
                          President and CEO


                            Vigo Carlund                         Sven Hagströmer                          Håkan Ledin


                           Pelle Törnberg                                                                 Lars Wohlin


                                                Our auditors’ report was submitted on March 3, 2003


                            Pål Wingren                                                                   Carl Lindgren
                     Authorized Public Accountant                                                  Authorized Public Accountant


                                                                                                                                                83
Audit report

To the Annual General Meeting of the shareholders in Tele2 AB (publ)
Corporate registration number 556410-8917


We have audited the annual accounts, the consolidated financial statements, accounting records and the adminis-
tration of the Board of Directors and the President of Tele2 AB (publ) for the 2002 financial year. These accounts
and the administration of the Company are the responsibility of the Board of Directors and the President. Our respon-
sibility is to express an opinion on the annual accounts, consolidated financial statements and the administration
based on our audit.
   We conducted our audit in accordance with generally accepted auditing standards in Sweden. Those standards
require that we plan and perform the audit to obtain reasonable assurance that the annual accounts and the con-
solidated financial statements are free of material misstatement. An audit includes examining, on a test basis, evi-
dence supporting the amounts and disclosures in the accounts. An audit also includes assessing the accounting
principles used and their application by the Board of Directors and the President, as well as evaluating the overall
presentation of information in the annual accounts and consolidated financial statements. To support our opinion
in regard to freedom from liability, we have examined significant decisions, actions taken and circumstances of the
Company in order to determine the liability, if any, to the Company of any Board member, or the President. We have
also conducted examinations to establish whether any Board member or the President has in any other way acted
in contravention of the Swedish Companies Act, the Annual Accounts Act, or the Company’s Articles of Association.
We believe that our audit provides a reasonable basis for our opinion set out below.
   The annual accounts and consolidated financial statements have been prepared in accordance with the Annual
Accounts Act and thus provide a true and fair picture of both the Company’s and the Group’s earnings and position
in accordance with generally accepted auditing standards in Sweden.
   We recommend that the Annual General Meeting adopt the Income Statements and Balance Sheets of the Parent
Company and the Group, that the profit in the Parent Company be dealt with in accordance with the proposal in the
Board of Directors’ Report, and that the members of the Board and the President be discharged from liability for
the financial year.


                                              Stockholm, March 3, 2003


             Pål Wingren                                                                Carl Lindgren
 Authorized Public Accountant                                                  Authorized Public Accountant


84 T E L E 2 A N N U A L R E P O R T   2002
Personnel and environment
Strict environmental requirements
Tele2’s operations have only a limited         mentally sound manner and purchasing           standards, but that it keeps abreast of
impact on the environment. The company         decisions must take the environment into       research in Sweden and abroad. The Group
has drawn up an environmental policy that      consideration. Tele2 is particularly con-      is an active participant in public discus-
permeates all operations. The policy insists   scious of environmental safety issues when     sions about health, safety and the envir-
that environmentally approved products be      it comes to mobile telephony. It is of the     onment.
used. Office waste and other scrapped          utmost importance that Tele2 does not
materials should be treated in an environ-     only comply with prevailing environmental


Personnel and skills development
Tele2 pursues an ongoing skills develop-       A number of new college graduates are            The Group had an average of 3,115
ment effort to ensure that its employees       chosen for a trainee program each year.        employees in 2002, compared with 2,172
possess the kind of know-how that will         The program is primarily devoted to on-the-    in 2001. Tele2 is active in 22 European
enable us to keep pace with the evolution      job training in various parts of the organi-   countries.
of the market and the needs of customers.      zation and abroad. There is also a 12-
All new employees complete a basic course      month, multi-phase leadership project for
that covers Tele2’s operations, goals, prin-   the Group’s managers.
ciples, and quality assurance objectives.


                                                                                                                                     85
Board of Directors


From left: Marc J. A. Beuls, Vigo Carlund, Lars-Johan Jarnheimer, Pelle Törnberg, Håkan Ledin, Lars Wohlin and Bruce Grant.


Marc J. A. Beuls                                          Pelle Törnberg                                            Bruce Grant
(Born 1956) holds a B.Sc. in Economics. He has            (Born 1956) President of Metro International since        Chairman of the Board
been with Millicom International Cellular S.A. since      2000. In 1987, he started the TV production com-          (Born 1959) Chairman and Managing Partner of
1992 and has been President & CEO since January           pany Strix. From 1993, he was responsible for all         Applied Value LLC. Member of the Board of Industri-
1998. In 1997 he was appointed President of               media companies in what was formerly Kinnevik,            förvaltnings AB Kinnevik, Korsnäs AB, Metro and
Banque Invik S.A. in Luxembourg. Marc Beuls pre-          currently MTG. Chairman of the Board of MTG and           Transcom.
viously held executive positions at Generale Bank in      P4 Radio Hele Norge. Member of the Board of Invik,
Belgium. He has been member of the Board of Tele2         MediaCorp and Millicom. Member of the Board of            Sven Hagströmer
since 1998.                                               Tele2 since 2001.                                         (Born 1943) President and Board Chairman of
                                                          Holding: 4,100 B shares.                                  Hagströmer & Qviberg from start in 1980 to 1995.
Vigo Carlund                                                                                                        Board Chairman of Investment AB Öresund, AB
(Born 1946) has worked for Kinnevik companies             Håkan Ledin                                               Custos and since 2001 also Acando. Member of the
since 1968. He is President of Industriförvaltnings       (Born 1937) MSc Eng and MSc Econ. Worked many             Board of LGP Telecom Holding AB, Avanza AB and
AB Kinnevik. Chairman of the Board of Transcom            years at Ericcson prior to becoming President of          HQ Fonder. Member of the Board of Tele2 since
WW and Korsnäs. Member of the Board of Millicom,          Millicom in 1987, where he serves as Board                1997.
Metro and Viking Telecom. Member of the Board of          Chairman as of 2002. He served as President of            Holding: 130,000 B shares.
Tele2 since 1995.                                         NetCom Systems in 1995–1996. Member of the
Holding: 379 B shares                                     Board of Tele2 since 1994.
                                                          Holding: 30,000 B shares.
Lars-Johan Jarnheimer
President and CEO (not a member of the Board).            Lars Wohlin
(Born 1960) MBA. President and CEO of Tele2 AB            (Born 1933) PhD Econ. Head of the Industry
since March 1999. Mr. Jarnheimer has held various         Research Institute 1973–1976, Undersecretary in
positions at IKEA, Hennes & Mauritz and SARA              Finance Ministry 1976–1979 and Governor of the
Hotels, and was President of ZTV for a short time         Central Bank 1979–1982. Served as President of
before coming to Comviq as Vice President in 1992.        Stadshypotek 1983–1996. Board Chairman of the
President of Comviq during 1993–97. Member of             Drott real-estate company since 1998. Member of
Group management at Saab Automobiles with                 the Board of Tele2 since 1996.
responsibility for the Nordic countries, Russia and       Holding: 1,100 B shares.
the Baltic States, and was President of Saab Opel
Sverige AB during 1997–98. Board assignments:
MTG, Arvid Nordquist Handelsaktiebolag, Millicom
and Invik AB.
Holding: 52,000 B shares and 15,000 options.


86 T E L E 2 A N N U A L R E P O R T   2002
Senior Executives


Lars-Johan Jarnheimer                  Håkan Zadler                            Fredrik Berglund                       Johnny Svedberg
Born 1960                              Born 1960                               Born 1961                              Born 1962
President and CEO of Tele2 AB          CFO                                     Market Area Director, Nordic           Market Area Director, Eastern Europe
M.B.A                                  M.B.A                                   President, Tele2 Sverige AB            and Russia
Employed since 1992                    Employed since 2000                     BSc in market economics                BSc in market economics
Holding: 2,000 B shares                Holding: 5,000 B shares                 Employed since 1995                    Employed since 1990
and 15,000 options*.                   and 15,000 options*                     Holding: 15,000 options*               Holding: 1 A-share, 1,240 B shares
Holdings through companies**:                                                  Holdings through companies**:          and 15,000 options*
50,000 B shares                                                                30,000 B shares                        Holdings through companies**:
                                                                                                                      8,000 B shares


Roman Schwarz                          Jean-Louis Constanza                    Jean-Claude Bintz                      Jeanette Almberg
Born 1947                              Born 1961                               Born 1956                              Born 1965
Market Area Director, Central Europe   Market Area Director, Southern Europe   Market Area Director, Luxembourg       Customer Service Director
President, Tele2 Switzerland           President, Tele2 France                 Employed since 1989                    M.B.A
M.B.A                                  M.B.A                                   Holding: 15,000 options*               Employed since 1995
Employed since 1991                    Employed since 1998                                                            Holding: 15,000 options*
Holding: 15,000 options*               Holding: 15,000 options*                                                       Holdings through companies**:
                                                                                                                      1,500 B shares


Björn Lundström                        Ib Andersen                             Roger Mobrin                           Anders Olsson
Born 1965                              Born 1955                               Born 1968                              Born 1969
Network Planning and                   Network Operations Director             Billing Operations and                 Market Area Director, Branded products
Implementation Director                M.B.A                                   Coordination Director                  & services, Marketing coordinator and
MSc Engineering                        Employed since 2000                     Technical college engineer             President, Tele2 Germany
Employed since 1991                    Holding: 15,000 options*                Employed since 1995                    MBA
Holding: 15,000 options*                                                       Holding: 50 B shares and               Employed since 1997
Holdings through companies**:                                                  15,000 options*                        Holding: 1,056 B shares
1,500 B shares                                                                 Holdings through companies**:          and 15,000 options*
                                                                               1,500 B shares


Karl-Johan Nybell                      Lars-Erik Svegander
Born 1968                              Born 1941                                                        *relates to incentive program 2002/2007, see Note 38
Product Management Director            Personnel Director
                                                                                                      ** relates to incentive program 1997/2006, see Note 38
MSc Engineering                        Employed since 1991
Employed since 1995                    Holding 15,000 options*
Holding: 15,000 options*               Holdings through companies**:                                                                                     87
Holdings through companies**:          1,500 B shares
1,000 B shares
The Tele2 share

Number of shares                                            responding to 6,700,000 B shares, thus                and a convertible debenture with detach-
Tele2’s A and B series shares were listed on                increasing Tele2’s shareholders’ equity by            able warrants corresponding to 100,000 B
the O-List of Stockholmsbörsen (Stockholm                   SEK 335 M.                                            shares.
Exchange) on May 14, 1996 in conjunction                       During the second quarter of 1998, all               Series A shares carry 10 votes, while B
with the distribution of the Company to the                 outstanding debentures were converted into            shares carry one vote.
shareholders of Industriförvaltnings AB                     755,555 B shares.
Kinnevik.      Following      the      distribution,           At the Annual General Meeting in May               Ownership structure
Kinnevik owned no shares in Tele2 but held                  2000, the Board of Directors was authorized           At year-end 2002, Tele2 had about 61,000
a convertible debenture corresponding to                    to settle an option commitment through a              shareholders, compared with about 64,000
25,555,555          shares.      During       1996,         new share issue. In October 2000, 200,000             one year earlier. The proportion of institu-
Kinnevik sold portions of the debenture,                    new B series shares were issued, as well as           tional owners corresponded to about 88%
after conversion to shares, to institutions                 three convertible debentures with detach-             of the share capital and about 92% of the
and Invik & Co. AB.                                         able warrants with rights to new subscrip-            voting rights on December 31, 2002.
   To promote interest in the Company’s                     tion of a total of 300,000 B shares.
share in the US and to increase its liquid-                    At an Extraordinary General Meeting of             Analysts who followed Tele2 during 2002
ity, the Tele2 share was listed on the Nasdaq               Tele2 AB on August 25, 2000, a proposal               ABG Securities              Henrik Wikström
exchange in the US on January 22, 1997.                     was approved to issue at most 40,901,585              Alfred Berg                 Lena Glader
A few months later, a new issue of two mil-                 series A and series B shares in Tele2 to              Carnegie                    Fredrik Danielsson
lion B shares was implemented. With this                    shareholders and holders of depository                EVLI                        Matti Riikonen
issue, Tele2 sought to broaden the                          receipts   in    Société       Européenne    de       Enskilda Securities         Per Trygg
Company’s international ownership interest                  Communication S.A. (SEC) in exchange for              Hagströmer & Qviberg Johan Broström
and to support the Nasdaq listing. The pro-                 shares and depository receipts in SEC. By             Handelsbanken               Peter Warleus
ceeds for the share issue, which amounted                   the end of the issue period, a total of               HSBC Securities             Viking Kjellström
to SEK 220 M, were primarily used for ongo-                 40,784,480 shares had been issued.                    Julius Baer                 Lena Hansson
ing investment requirements, in particular                     At the end of 2001, all shares in FORA             JP Nordiska Fondk.          Håkan Persson
for the development of Tele2’s Danish and                   Telecom B.V. were acquired in exchange for            Öhman Fondkomm.             Stefan Billing
Norwegian operations.                                       2,461,449 newly issued Tele2 B shares. In             Swedbank                    Henrik Sandell
   In conjunction with the new issue,                       2001, 100,000 B shares were newly sub-                UBS Warburg                 Jeremy Taylor
Industriförvaltnings AB Kinnevik sold the                   scribed. During 2002, 100,000 shares                  Schroder Salomon
major portion of its remaining convertible                  were newly subscribed, which was submit-              Smith Barney                Christian Kern
debenture in Tele2 after conversion to                      ted to PRV, the Swedish Patent and
6,000,000 B shares.                                         Registration Office, for registration.
   By the end of the first half of 1997, Invik                 As of December 31, 2002 there were a
& Co. AB had converted its debenture, cor-                  total of 147,360,175 shares in Tele2 AB


Ownership structure, December 31, 2002                                                                                                  Current ownership structure
                                                                                                                                             Share of     Share of
                                                          A shares             B shares              A+B shares          No. of votes      capital, %     votes, %

Invik & Co AB                                           9,891,787            2,825,579           12,717,366         101,743,449                  8.6           29.7
Industriförvaltnings AB Kinnevik                        6,498,880           24,611,021           31,109,901           89,599,821                21.1           26.1
Emesco                                                  3,205,379              75,100             3,280,479           32,128,890                 2.2            9.4
Millicom International Cellular S.A.                            0           10,012,543           10,012,543           10,012,543                 6.8            2.9
Stenbeck, Jan (Estate)                                   914,157                       0              914,157            9,141,570               0.6            2.7
SEB                                                             0            9,067,781            9,067,781              9,067,781               6.1            2.6
Nordea                                                       834             6,720,828            6,721,662              6,729,168               4.6            2.0
Swedish Fourth Pension Fond                                     0            5,251,500            5,251,500              5,251,500               3.6            1.5
ROBUR                                                           0            5,037,730            5,037,730              5,037,730               3.4            1.5
AMF Pension                                                     0            4,218,000            4,218,000              4,218,000               2.9            1.2
Total, ten largest shareholders                        20,511,037           67,820,082           88,331,119         272,930,452                 59.9           79.6

Other shareholders                                      1,178,767           57,950,289           59,129,056           69,737,959                40.1           20.4


Total                                                  21,689,804        125,770,371            147,460,175         342,668,411               100.0         100.0

88 T E L E 2 A N N U A L R E P O R T   2002
Share trend of Stockholmsbörsen

            Tele2’s closing price each week     AFGX          Share turnover 000s (incl. off-floor trading)
900
800
700
600

500

400


300                                                                                                                              30,000


                                                                                                                                 25,000
200
                                                                                                                                 20,000


                                                                                                                                 15,000


100                                                                                                                              10,000


                                                                                                                                 5,000

 60
       96               97               98              99                00                  01                02         03


      Share trend on Nasdaq
        Tele2’s closing price each month, USD        Nasdaq composite index      Share turnover 000s (incl. off-floor trading)
100
 90
80
70

60

50


40
                                                                                                                                 900

                                                                                                                                 800
30
                                                                                                                                 700

                                                                                                                                 600

                                                                                                                                 500
20
                                                                                                                                 400

                                                                                                                                 300

                                                                                                                                 200

                                                                                                                                 100
10
            97                  98              99                   00                   01                   02           03


                                                                                                                                          89
Addresses

Tele2 AB                                      Norge                                  Eastern Europe
Skeppsbron 18
Box 2094
                                              Tele2 Norge AS                         and Russia
                                              Ulvenveien 75A
SE-103 13 Stockholm, Sweden
                                              NO-0581 Oslo, Norway
                                                                                     Estonia
Phone: +46 8 5620 0060                                                               Tele2 Eesti AS
                                              Phone: +47 21 31 90 00
Fax: +46 8 5620 0040                                                                 Joe 2a,
                                              Fax: +47 21 31 91 00
                                                                                     EE-10151 Tallinn, Estonia
Investor Relations                            Datametrix AS                          Phone: +372 6888 866
30 St James’ Square                           Grenseveien 95                         Fax: +372 6866 877
GB-SW1Y 4JH, London, England                  NO-0663 Oslo, Norway
Phone: +44 20 7321 5010                       Phone: +47 23 03 59 00                 Latvia
Fax: +44 20 7321 5020                         Fax: +47 23 03 59 01
                                                                                     SIA Tele2
                                                                                     Kurzemes Prospectus 13
Nordic                                        Danmark                                Riga LV-1067, Latvia
Sweden                                        Tele2 A/S                              Phone: +371 960 99 99
                                              Gammel Køge Landevej 55                Fax: +371 709 01 76
Tele2 Sverige AB
Borgarfjordsgatan 16                          DK-2500 Valby, Denmark
Box 62                                        Phone: +45 77 30 10 01                 Lithuania
SE-164 94 Kista, Sweden                       Fax: +45 77 30 10 00
                                                                                     UAB Tele2
Phone: +46 8 5626 4000                                                               Sporto g. 7a
Fax: +46 8 5626 4200                          Datametrix A/S
                                                                                     LT-20 51 Vilnius, Lithuania
Customer Service Private:                     Gammel Køge Landevej 55-57
                                                                                     Phone: +370 2 366 300
0200-25 25 25 (Internet)                      DK-2500 Valby, Denmark
                                                                                     Fax: +370 2 366 301
0200-25 25 25 (fixed telephony)               Phone: +45 77 30 10 60
0200-22 20 40 (mobile telephony)              Fax: +45 77 30 10 61
                                                                                     Poland
                                              Optimal Telecom A/S                    Tele2 Polska
Comviq
                                              Karl Jacobsen vej 20                   ul. Poste-pu 15
Box 62
                                              DK-2500 Valby, Danmark                 PL-02-676 Warszaw, Poland
SE-164 94 Kista, Sweden
                                              Phone: +45 77 30 12 90 (switchboard)   Phone: +48 (22) 549 50 60
Phone: +46 8 5626 4000 (switchboard)
                                              Fax: +45 77 30 00 56                   Fax: +48 (22) 549 50 61
Fax: +46 586 53 444
Customer Service:
0200-22 20 40 (private customers)             Finland                                Czech Republic
0200-22 40 50 (corporate customers)           Tele2 Finland                          Tele2 s. r. o.
                                              Sentnerikuja 3                         Vinohradská 184, Praha 3,
Kabelvision                                   FI-00440 Helsingfors, Finland          CZ-130 00, Czech Republic
Box 62                                        Phone: +358 9 74 22 12 45              Phone: +420 267 13 22 38
SE-164 94 Kista, Sweden                       Fax: +358 9 74 22 12 46                Fax: +420 274 77 82 40
Phone: +46 8 5626 4352 (switchboard)
Fax: +46 8 5865 4840                                                                 Russia
Customer Service:
                                                                                     Tele2 Russia Telecom
+26 2000-22 55 00
                                                                                     B. Gnezdnikovsky Per.,1str.2, 7 tr
                                                                                     RU-103 009, Moscow, Russia
Optimal Telecom AB
                                                                                     Phone: +7 095 797 21 61
Box 62
                                                                                     Fax: +7 095 797 21 62
SE-164 94 Kista, Sweden
Phone: +46 8 5626 2500 (switchboard)
Fax: +46 8 5626 2525                                                                 Sweden
                                                                                     X-source AB
Datametrix AB                                                                        Box 416
Box 20078                                                                            SE-129 44, 129 04 Hägersten, Sweden
SE-161 02 Bromma, Sweden                                                             Phone: +46 8 5222 3500
Phone: +46 8 5220 0200                                                               Fax: +46 8 5222 3552
Fax: +46 8 5220 0290


90 T E L E 2 A N N U A L R E P O R T   2002
Central Europe                           Southern Europe                  Other Branded Products
Germany                                  France                           & Services
Tele2 Telecom Services GmbH              Tele2 (France) S.A.
In der Steele 39a,                       14 Rue des Frères Caudron        Tele2 UK Communications Ltd
DE-40599 Düsseldorf, Germany             FR-78143 Vélizy cedex, France    Kingstons House 15,
Phone: +49 211 7400 4600                 Phone: +33 1 39 45 44 44         Coombe Road
Fax: +49 211 7400 4611                   Fax: +33 1 39 45 44 00           GB-London RG2 OSY, England
                                                                          Phone: +44 208 957 1900
                                                                          Fax: +44 208 957 1901
Netherlands                              Italy
Tele2 Nederland B.V.                     Tele2 Italia SpA                 Everyday.com
Ellermanstraat 19                        Via Cassanese 210                Box 17041
NL-1099BX Amsterdam,                     IT-20090 Segrate Milano, Italy   SE-104 62 Stockholm, Sweden
Netherlands                              Phone: +39 02 269 571            Phone: +46 8 5889 8400
Phone: +31 207 020 202                   Fax: +39 02 269 204 37           Fax: +46 8 5889 8401
Fax: +31 207 020 222
                                         Spain                            Alpha Telecom Communications Ltd
Switzerland                              Tele2 Telecommunication          Ryde House 391
TELE2 Telecommunication                  Services S.L.                    Richmond Road
Services AG                              Francisco de Ricci,3,            GB-Twickenhan TW1 2EF England
Postfach 49                              ES-28015 Madrid, Spain
CH-8037 Zürich, Switzerland              Phone: +34 91 540 28 00          C3 Calling Card Company
Phone: +41 1 524 24 24                   Fax: +34 91 540 28 01            1 Mill Street
Fax: +41 1 524 47 78                                                      GB-London SE1 2DE, England
                                                                          Phone: +44 207 232 4949
                                         Luxembourg
Austria
                                         Luxembourg
Tele2 Telecommunication
                                         Tango S.A.
Services GmbH
                                         177, rue de Luxembourg,
Schönbrunnerstr. 213-215, 4tr
                                         LU-8077 Bertrange, Luxembourg
AT-1120 Vienna, Austria
                                         Phone: +352 27 777 101
Phone: +43 181 101 300
                                         Fax: +352 27 777 888
Fax: +43 181 101 100

                                         Liechtenstein
Irland
                                         Tele2 AG
Tele2 Telecommunication
                                         75 route de Longwy,
Services Ltd
                                         LU-8080 Bertrange, Luxembourg
Office 4, O'Duffy Centre, Main Street,
                                         Phone: +352 27 750 101
Carrickmacross,
                                         Fax: +352 27 750 250
Co Monaghan, Irland
Phone: +353 42 969 2946
Fax: +353 42 969 2947                    Belgium
                                         Tele2 Belgium N.V.
                                         75 route de Longwy,
                                         LU-8080 Bertrange, Luxembourg
                                         Phone: +352 27 750 101
                                         Fax: +352 27 750 250


                                         3C Communications S.A.
                                         75 route de Longwy
                                         LU-8080 Bertrange, Luxembourg
                                         Phone: +352 27 750 101
                                         Fax: +352 27 750 250


                                         Transac S.A.
                                         3, rue de l'Abattoir
                                         LU-3409 Dudelange, Luxembourg
                                         Phone: +352 27 754 101
                                         Fax: +352 27 754 300


                                                                                                             91
2002
History                           2000                                       – Comviq celebrates 10th Anniversary, breaks Swedish record with more than
                               – NetCom is awarded UMTS licenses              2 million prepaid card subscribers.
                                  in Norway and Sweden.                      – Tele2 is world’s fourth fastest-growing listed telecom/IT company.
                               – Netcom acquires Latvia’s next               – MVNO launched in the Netherlands and MVNO agreements signed in Norway
                                  largest mobile operator,                    and Austria.
                                  Baltikom GSM.                              – Jan Hugo Stenbeck, Tele2’s founder and Chairman, dies at 59 years of age.


                    2000                                              2001
                  – NetCom becomes the first mobile virtual         – Acquisition of FORA Telecom.
                    network operator (MVNO) in Denmark.             – Joint UMTS company with Telia.
                  – NetCom acquires Société Européenne              – NetCom changes corporate identity to Tele2.
                    de Communication S.A.


                                1999
                              – NetCom increases its holding in Ritabell to 94.8%.
                              – Pre-selection initiated in Denmark, Norway and Sweden.                                  Year-end
                              – NetCom AB sells its holding in NetCom ASA to Société Européenne de                      1997/1998
                                Communication S.A., SEC. In exchange, receives newly issued shares in SEC.             – The Norwegian telecom market
                                After transaction, NetCom AB owns 17.8% of capital in SEC.                              is deregulated.


                                                    1998                                                                             1997
                                                  – Operations are extended to the Baltic States through                           – NetCom Systems is
                                                    the acquisition of 48% in the mobile operator Ritabell.                          listed on Nasdaq.
                                                  – NetCom Systems AB changes corporate identity to
                                                                                                                 1996
                                                    NetCom AB.
                                                                                                               – The shares in NetCom Systems are distributed
                                                                                                                 to shareholders in Kinnevik. Meanwhile,
                                                                                                                 NetCom Systems is listed on the O-List of
                                                                                                                 the Stockholm Stock Exchange.
                                                                                                               – NetCom Systems, via the subsidiary Tele2
                                1990                                  1993                                       A/S, becomes the first competitor to Tele
                              – Tele2 AB is established.           – NetCom Systems starts the                   Danmark in the Danish telecom market,
                                (Currently Tele2 Sverige AB).         predecessor to Tele2 Norge.                breaking a 100-year old monopoly.


                                                  1992                                       1993
                                                – Comviq GSM starts up its own            – Deregulation of the market for fixed telephony.
                                                  GSM-network.                            – NetCom Systems is established in order to own and develop
                                                                                             the Kinnevik Group’s telecom companies in the Nordic region.
                                                                                          – Kinnevik and Orkla form the Norwegian company, NetCom
                                                                                             ASA. NetCom Systems owns 25% of the company.


                                1989                                                                                 1980s
                              – Agreement with the Swedish Rail                   1986                              – Kinnevik complete the preparations
                                Administration (Banverket) covering             – A satellite connection for         for providing conventional
                                investment in a joint fiber-optic network.        data traffic is opened.            telecommunications in voice and data.


                                                    1988                                             1981                            Late 1970s
                                                    – Comviq received                                – Comvik AB launched its        – Industriförvaltnings AB
                                                     a GSM license.                                    own analog network for             Kinnevik decides to
                                                                                                       mobile telephony.                  undertake a venture in the
                                                                                                                                          telecommunications market.


92 T E L E 2 A N N U A L R E P O R T   2002
Definitions

Definitions    (Text in parentheses refers to financial ratios after full conversion.)

Liquidity                                                 Capital employed                                     Shareholders’ equity per share
Cash and cash equivalents, including unutilized           Total assets less provisions, minority interests     Shareholders’ equity (including convertible
credit facilities granted.                                and non-interest bearing liabilities.                debentures) less minority interests, divided by
                                                                                                               the weighted average number of shares out-
Net borrowing                                             Return on capital employed                           standing during the fiscal year (that would
Interest-bearing liabilities (less convertible            Profit/loss after financial items less items         result from full conversion of convertible
debentures) less interest-bearing assets.                 affecting comparability and financial costs (less    debentures).
                                                          interest expense for convertible debentures)
Investments                                               divided by average capital employed.                 Cash flow per share
Acquisition and divestment of fixed assets, in-                                                                Based on cash flow from operating activities
cluding investments through financial leases, and         Average interest expense                             before investment and financing activities.
investments not qualifying as cash equivalents.           Interest expense (less interest expense for con-
                                                          vertible debentures) divided by average interest-    Dividend per share
Equity/assets ratio                                       bearing liabilities (less convertible debentures).   Based on the dividend distributed or proposed
Shareholders’ equity (including convertible                                                                    each year.
debentures) divided by total assets.                      Earnings per share
                                                          Profit/loss for the period (less interest expense    ARPU
Debt/equity ratio                                         on convertible debentures, and less tax deduc-       Average monthly revenue per customer.
Interest-bearing net debt divided by share-               tions) divided by the weighted average number
holders’ equity at the end of the period.                 of shares outstanding during the fiscal year         MoU
                                                          (that would result from full conversion of con-      Minutes of monthly usage per customer.
Return on shareholders’ equity                            vertible debentures).
Profit/loss after tax less items affecting compar-
ability, minority interests after tax deductions
(and interest expense for convertible debentures
after tax deductions) divided by average equity
(including convertible debentures).


Glossary

CRM - Customer Relationship Management,                   MVNO – Mobile Virtual Network Operator.              VOIP – Voice Over Internet Protocol.
often supported by computer-based systems.                MVNO’s have greater network resources than           Telephony that uses Internet Protocol.
                                                          Service Providers with which to offer their own
DSL - Digital Subscriber Line.                            telecom services to subscribers. But they do         VPN – Virtual Private Network.
Generic name covering several different tech-             not have radio access network capacity, which        A service that links a company’s local and tele-
nologies for datatransmission over fixed phone            must be purchased from a network operator.           com networks with the computers and phones
lines.                                                                                                         of employees who work remotely, forming a
                                                          NMT – Nordic Mobile Telephone.                       telecom or data communications network that
GPRS – General Packet Radio Service.                      Ordinarily identified as the 1st-generation          looks to users like a single business network.
A technology that permits high-capacity data              mobile telephony. An analog technology
transmission using mobile phones.                         developed in the Nordic region.                      WAN – Wide Area Network.
                                                                                                               A network of computers on different locations.
GSM – Global System of Mobile.                            SMS – Short Message Service.                         Often consists of several LANs linked together.
Communications or Groupe Spécial Mobile.                  Enables the transmission of short text messages
2nd-generation mobile telephony system.                   between mobile phones or between a computer          WAP – Wireless Application Protocol.
Digital, as opposed to analog NMT.                        that is connected to the Internet and a mobile       An industrial standard for Internet-based
                                                          phone.                                               data communications over mobile networks.
IP – Internet Protocol.                                                                                        Developed by the WAP Forum, consisting of
A series of rules for communication among                 SP – Service Provider.                               big corporations like Ericsson, IBM, Motorola
computers over the Internet.                              A company that purchases capacity from net-          and Nokia.
                                                          work operators with which it can sell telecom
LAN – Local Area Network.                                 services to its subscribers.                         WLL – Wireless Local Loop.
Local network of computers, often in the same                                                                  Wireless broadband access via radio networks.
room or building.                                         UMTS – Universal Mobile Telecommunications
                                                          System.
MMS – Multimedia Messaging Services. A ser-                  A technology for 3rd-generation mobile tele-      Sources: Computer Sweden, Mobiltelebranschen,
vice that makes it possible to send text, video           phony intended to handle, text, images, and          Svenska Datatermgruppen and Tele2.
and audio messages between mobile phones or               video. UMTS has greater capacity than GSM.
between Internet-connected computers and a
mobile telephone.
                                                                                                                                                              93
TELE2 AB
Skeppsbron 18
P.O. Box 2094
SE-103 13 Stockholm
Phone +46 8 5620 0060
                                Solberg. Print: Göteborgstryckeriet.


Fax +46 8 5620 0040
E-mail info@tele2.com
www.tele2.com
Corporate identification No.:
556410-8917

Annual Report 2002

  • 1.
  • 2.
    Contents A key factor underlying Tele2’s success is that Significant events ........................................................................ 1 Jan Hugo Stenbeck ................................................................... 2 we communicate Tele2 in brief ..................................................................................... 6 with our customers President’s message ............................................................. 10 in a way that appeals Market – continuing growth ......................................... 12 Business concept and business model ........... 14 to them. Services and products ........................................................ 17 page 10 Nordic ................................................................................................... 20 Eastern Europe and Russia .......................................... 23 Central Europe ............................................................................ 26 Southern Europe ....................................................................... 28 Luxembourg .................................................................................... 30 Branded products & services ...................................... 31 Report of the Directors ...................................................... 32 A central market Income statement ................................................................... 37 driving force is that Balance sheet .............................................................................. 38 Cash-flow statement ............................................................. 40 customers are Change in shareholders’ equity ................................ 41 increasingly seeking Notes .................................................................................................... 42 Audit report .................................................................................... 84 total solutions. Personnel and environment ......................................... 85 page 12 Board of Directors ................................................................... 86 Senior executives ..................................................................... 87 Tele2 share ...................................................................................... 88 Addresses .......................................................................................... 90 History ................................................................................................ 92 Definitions ....................................................................................... 93 Annual General Meeting Tele2´s business The Annual General Meeting will be held at 1:30 pm on Thursday, May 15, 2003, at Gamla Stans Bryggeri, concept is to offer Tullhus 2 at Skeppsbron in Stockholm. simple, customer- Shareholders who wish to attend the Annual General friendly services at Meeting must be entered in the register of shareholders the lowest price. maintained by VPC AB (the Securities Register page 14 Center) for the Annual General Meeting (registration must be completed by Monday May 5, 2003). and notify the Company of their intention to attend no later than 1:00 pm on Friday, May 9, 2003. Notification can be made by phone to +46 33 724 12 67, or in writing to: Tele2 AB, Box 2094, SE-103 13 Stockholm, Sweden label the envelope “Annual General Meeting” or by The rapid growth in e-mailing to: bolagsstamma03@tele2.com Southern Europe is Financial information Quarterly report, January–March April 23 driven by the intro- Annual General Meeting May 15 duction of local pre- Quarterly report, January–June August 5 Quarterly report, January–September October 21 selection. page 28
  • 3.
    Significant events in2002 • Profit after financial items rose by SEK 2,740 million to SEK 796 million. • Cash flow after investments increased by SEK 2,903 million to SEK 1,849 million. • Operating revenue jumped 25%, by SEK 6,197 m to SEK 31,282 m. • EBITDA advanced to SEK 5,127 m, compared with SEK 1,698 m in 2001. + 25% • A positive EBITDA was reported for fixed telephony in Central and Southern Europe, SEK 4 million compared with a loss of SEK 1,916 m in 2001. • 16.8 million customers at year-end, an increase of 12%. Significant events at the beginning of 2003 + 12% • Tele2 acquires the British company Alpha Telecom. Financial summary MSEK 2002 2001 Operating revenue 31,282 25,085 Operating profit/loss before depreciation, EBITDA 5,127 1,698 Operating profit/loss after depreciation, EBIT 1,530 –1,356 Operating profit/loss after financial items, EBT 796 –1,944 Profit for the year 223 392 Earnings per share, after dilution 1.51 2.70 Average number of employees 3,115 2,172
  • 4.
    Jan Hugo Stenbeck 1942-2002 2 TELE2 ANNUAL REPORT 2002
  • 5.
    Tele2 AB Dear Shareholder, JanHugo Stenbeck was Chairman of the Board of Directors of Tele2 AB for nine years from 1993 to 2002. He was also Chairman of Industriförvaltnings AB Kinnevik, Invik & Co. AB, Modern Times Group MTG AB, Millicom International Cellular S.A., Metro International S.A. and Transcom WorldWide S.A. Jan passed away on 19 August 2002. He possessed a seldom-rivaled energy, panache, ambi- tion and sense of fun. His dynamism, curiosity and restlessness, combined with a charm, determination and healthy fear, drove him to create one of Europe’s most innovative and successful group of companies. He would not compromise on quality or efficiency and never ceased to surprise by breaking with convention. His insight – the ability to grasp the key elements of an issue and articulate his views clearly - was his greatest attribute. Loyalty was the quality that he valued most in others. Born in Stockholm in 1942, Jan graduated in Law from Uppsala University in 1968 and with an MBA from Harvard Business School in 1970. He then joined US investment bank Morgan Stanley and rose to become a Vice President in the Bank’s Corporate Finance depart- ment. He became a member of the Board of Directors of Industriförvaltnings AB Kinnevik in 1971 and became Chairman in 1993, taking over at the helm of the Group that his father, the prominent lawyer Hugo Stenbeck, and the Klingspor and von Horn families had built into one of Sweden’s largest industrial investment companies. With uncanny foresight, Jan built a multinational information empire from this industrial foundation and transformed Kinnevik into a holding company for new telecommunications, media and service businesses whose brands are now household names not just in his native Sweden but a large number of markets around the world. As one of the leading entrepreneurs and visionaries of his generation, he started hundreds of companies in his lifetime.They ranged from a college sweatshirt business established in 1963 with 10,000 customers and less than US$1 million in annual sales to Europe’s leading alternative telecommunications provider with over 16.8 million customers and US$3.7 bil- lion in annual sales. All the businesses share several common features – they all break monopolies in order to provide people with choice, grow sales aggressively, are highly com- petitive businesses with low cost structures, and they all aspire to be “best in class”. 3
  • 6.
    Jan Hugo Stenbeck From Kinnevik’s roots in the traditional steel and forestry industries, Jan created a group of companies that embraced new technologies and encouraged a competitive environment in the Nordic region and then internationally. As a pioneer of mobile telephony in the early 1980s, Jan formed a joint venture with British defense company Racal to acquire the UK’s second mobile phone license. Racal-Millicom evolved into the US$122 billion global telecommunications giant,Vodafone. Jan also acquired one of the first mobile telephony licenses in the United States and this model was repeated around the world. Millicom and Tele2 today hold fixed line or mobile telephony licenses in 37 countries – from Estonia to Sierra Leone, Bolivia to Russia, and Portugal to Laos – and have more than 20 million sub- scribers around the world. In similar fashion, Jan introduced the first commercial television channel,TV3, to Scandinavia in 1987 by broadcasting commercial television into Scandinavia from London via the Astra satellite in Luxembourg.The same approach enabled Sky Television to launch in the UK. TV3 is now the largest pan-Nordic television channel and the Viasat satellite TV platform broad- casts 36 channels to nine countries, which are watched in 45 million homes. The most recent project to achieve global scale and reflect the Group ambition is Metro International, the free newspaper group. Again challenging local market monopolies and established media in cities from Boston to Barcelona, Stockholm to Santiago, and Holland to Hong Kong, Metro now reaches over 12 million readers and is the world’s largest news- paper outside Japan.The company’s advertising revenues have grown at a compound annual rate of 47% since the launch of the first edition in Stockholm in 1995. All of these companies continue to shape and adapt successfully to new developments as third generation mobile telephony and digital multi-channel television become realities, and as exciting new markets in Eastern Europe and Asia offer significant new opportunities. Kinnevik has generated a compound annual average rate of return since 1976 of 13%, with the result that one dollar invested in Kinnevik in 1976 would be worth over US$25 today. The Stenbeck Group of publicly listed companies had a combined market capitalization of US$6 billion in February 2003 and employed more than 25,000 people in more than 50 countries around the world. In typical style, the Stenbeck group of companies, combined established tradition with ground breaking originality by welcoming in the new millennium with a spectacular fireworks and multi-media display in Stockholm’s Old Town on New Year’s eve.The scale and complexity of this event not only mesmerized the record breaking crowd of 700,000 people and won its 4 TELE2 ANNUAL REPORT 2002
  • 7.
    Jan Hugo Stenbeck placein the Guinness Book of World Records, but also offered a unique showcase for group brands such as Comviq,TV3 and Metro.The event perfectly illustrated Jan’s unusual combin- ation of creative flair and intricate planning. On the day after he passed away and only a few months before his 60th birthday, one of Jan’s greatest dreams was realized when the second Victory Challenge yacht was launched in Auckland, New Zealand. From the time that he had acquired the former committee boat of the New York Yacht Club, Jan had nurtured a dream to compete for one of the sporting world’s oldest and most coveted trophies – The America’s Cup.The Victory Challenge syndi- cate brought together leading match race sailors from the Nordic countries in the first challenge by a Nordic crew for twelve years. The challenge exemplified Jan’s approach, as he acquired one of the yachts used by Team New Zealand to win the Cup in 2000, then recruited and motivated world class boat design- ers, builders, and sailors, forged a team, and pushed each member to the limits of their potential, whilst maintaining a strict control on cost.This was an environment in which he thrived – high adrenaline competition, pitting the Nordic team against the world’s best. Every detail counted as seconds decided between success and failure. Victory Challenge won eleven races, including two victories over the New York Yacht Club, reaching the quarterfinals of the Louis Vuitton Cup and becoming the most successful Nordic entry ever.The Challenge generated unparalleled media airtime for its group sponsors, including live television cover- age in Sweden, Norway, Denmark, Switzerland, France, Italy, the United Kingdom, the United States and Canada. Despite, and perhaps because, of all the achievements above, Jan remained a very private and modest man. “Tell them that I am only a Basett hound breeder” he would reply to the end- less requests for interviews. As Jan always said, “if you can’t choose, you shouldn’t com- plain”. He led a unique life and is greatly missed. His legacy is an opportunity to build on his success and your Board is firmly committed to fulfilling this responsibility. On behalf of the shareholders, customers, employees and business partners, the Board of Directors wishes to express its gratitude for the enormous contribution of Jan Hugo Stenbeck to the development of Tele2 and the other companies, which he founded and in which he engaged. Stockholm, 27th February 2003 Tele2 AB The Board of Directors 5
  • 8.
    Tele2 in brief Mobile telephony Fixed telephony and Internet Nordic: Sweden, Norway, Denmark. Nordic: Sweden, Norway, Denmark, Finland. Geographic markets: Eastern Europe Eastern Europe and Russia: Estonia, Latvia, Lithuania, Russia. and Russia: Estonia, Poland, Czech Republic. Central Europe: Switzerland, the Netherlands, Austria. Central Europe: Germany, the Netherlands, Switzerland, Austria, UK. Southern Europe: — Southern Europe: France, Italy, Spain, Portugal. Luxembourg: Liechtenstein, Luxembourg. Luxembourg: Liechtenstein, Luxembourg, Belgium. 12 countries 19 countries Percentage of net sales: 30 % 68% Number of customers: Nordic: 3 221 000 Nordic: 2 822 000 Eastern Europe and Russia: 1 366 000 Eastern Europe and Russia: 144 000 Central Europe: 271 000 Central Europe: 3 316 000 Southern Europe: — Southern Europe: 5 129 000 Luxembourg: 181 000 Luxembourg: 41 000 6 TELE2 ANNUAL REPORT 2002 5.0 11.4 million million
  • 9.
    16.8 million customersin 22 countries Tele2 AB, formed in 1993, is the leading alter- and billing; C3, which is active native pan-European telecommunications com- in prepaid calling cards for pany offering fixed and mobile telephony, as well fixed telephony; and as data network and Internet services, under the Optimal Telecom, which brands Tele2, Tango and Comviq to more than offers households low price 16.8 million customers in 22 countries. Tele2 guarantees for telephony services. The Group operates Datametrix, which specializes in sys- also offers cable-TV services and jointly owns the tems integration; 3C Communications, which Internet portal Everyday.com with MTG. Tele2 operates Internet payments, credit card trans- AB’s share is listed on Stockholmsbörsen actions and public pay telephones; Transac, which (Stockholm Exchange) under TEL2A and TEL2B offers data processing of credit card transactions and on Nasdaq under TLTOA and TLTOB. 7
  • 10.
    MVNO iHear MVNO (Mobile Virtual Network Operator) is a concept iHear is a cordless digital that makes it possible for Tele2 to offer its customers telephone equipped with mobile telephony without needing to invest in its own a calling-router. mobile network. Tele2 buys the right to handle incom- ing and outgoing mobile traffic. As an MVNO, Tele2 has its own SIM cards, bills its customers directly and develops its own services. As a result, customers gain access to Tele2’s services and lower rates. MVNO offers major growth potential for Tele2 in countries in which it has a large customer base in fixed telephony, but lacks its own infrastructure. Transcom Flexible solutions Transcom is a pan-European partner that handles Tele2’s corporate culture is marked by flexibility and Tele2’s customer relations. Transcom serves as Tele2’s adaptability in reacting to changes in customer customer service and handles all of Tele2’s ongoing requirements and other market conditions – while customers matters. focusing constantly on customer demand for attrac- tive services and the lowest price. 8 TELE2 ANNUAL REPORT 2002
  • 11.
    Anders Igel , President of TeliaSonera Victory Challenge “I think Tele2 is good at marketing, adopts a com- Tele2 sponsored Victory Challenge – the Swedish mercial approach and has an ability to get things done. challenger for the America´s Cup in 2003. Victory We’ve got a good deal to learn from them.” Challenge went all the way to the quarterfinals outside Auckland in New Zealand. Tele2 is currently active in Affärsvärlden, No. 3, 2003 22 countries and the exposure provided by the sailing contests was a very effective way of strengthening the brand among existing and new customers. Network Management GSM licenses in Russia To provide 100% availability in the networks, they are monitored 24 hours a day, 365 days a year. This Tele2 now has GSM licenses in all eleven of its oper- ensures that our customers can communicate with as ations in Russia. Preparations for the GSM network few interruptions as possible. build-out are well advanced and general agreements for delivery of GSM infrastructure have been reached with suppliers. 9
  • 12.
    Tele2 is aunique company Tele2 is the only telecom company that has more than SEK 2.3 billion. Another key Our fixed network companies are also a pan-European market in fixed network benchmark of our solid financial base is becoming mobile companies in pace with telephony. As the leading alternative tele- that net debt fell by SEK 1.6 billion dur- deregulation. We’re focusing on the MVNO com company in Europe, we can state with ing the year and now amounts to SEK 7.7 concept, which means that we buy rights satisfaction that our subsidiaries in country billion. to handle incoming and outgoing mobile after country report positive operating profit This is a solid platform for continuing traffic from an established mobile opera- before depreciation about three years after operations. tor. As an MVNO, we issue our own SIM start-up. The question posed for most telecom cards, invoice customers directly and The image of Tele2 as primarily a Swedish companies today is: “Are there sufficient develop proprietary services. For the cus- or Nordic company is increasingly inaccur- funds?” The question I’m faced with is a tomer, the difference between a subscrip- ate. Each of our subsidiaries in France, totally different one: “What will we do with tion with Tele2 as the MVNO or having a Italy and the Netherlands have more fixed our funds?” The answer is easy to give: subscription with the operator who owns network customers than Tele2 in Sweden. We will continue to be a growth compa- the infrastructure is merely Tele2’s lower Tele2 is a unique telecom company ny and win market share in markets in rates and services. Being a Service Partner since we are not burdened by major invest- which we are present. The exciting feature (SP) is less attractive for Tele2, since this ments requiring write-offs. Tele2 reported is that we can personally set the pace with- does not permit the same type of customer a positive bottom line in 2002 despite out viewing financial resources as a bottle- contact. write-offs for our 3G venture in Norway. neck. Our efforts to develop fixed network cus- Tele2’s profit before and after deprecia- Over a number of years I’ve stated that tomers and transform them into mobile tion/amortization shows a much smaller we’ve got our fingers in the cookie jar. By customers is an expression of our cross- difference than other telecom companies. that I mean we are as close as possible to selling strategy. Our large customer base is Focusing on markets and customers our customers. We can see clearly how this being offered an increasing number of ser- instead of on costly investments in tech- approach works in Estonia, Latvia and vices, which means lower costs for one nology was the basic philosophy of Tele2’s Lithuania, countries in which we are high- “new” customer. founder Jan Stenbeck from the very begin- ly successful. I’m convinced that these Through MVNO´s, Tele2 is now trans- ning. Jan Stenbeck’s passing away in positive lessons can act as an excellent forming part of its large stock of fixed net- August 2002 was of course a profound loss guide as we increase the pace in our work customers in country after country for Tele2, but the founder’s basic ideas Russian operations. into Tele2 mobile customers. Mobile cus- remain intact. Tele2 is now working active- Tele2 started its operations in Sweden. tomers accounted for the largest percent- ly to develop these basic concepts through- Operations there are wide-ranging and age of the increase in customers in 2002. out Europe. highly important. This applies not least to Tele2 returned its Norwegian UMTS Tele2 now has a solid financial base. Comviq, which celebrated its tenth anni- license during the year, opting instead to The fact that the company began to report versary in 2002, and reported 3 million sign an MVNO deal with Telenor. a profit in 2002 is, of course, significant, mobile customers. Two million of these are European telecom deregulation is far but perhaps what is even more impressive prepaid customers. Comviq’s mobile tele- from complete, but the EU and the various is that cash flow during the year was boost- phony is based on our core values. Our aim national supervisory authorities are now ed by almost SEK 3 billion after invest- is always to give customers minimum worried by the threat that has emerged in ments. The company’s disposable liquid rates, while simultaneously developing a number of countries, namely, that mar- funds, including unutilized overdraft facil- concepts and services. ket newcomers are disappearing so that ities, amounted at year-end to slightly only the former monopolies remain. Since “Tele2 is the world’s fourth fastest growing telecom/IT company…” Business Week, June 19, 2002 10 T E L E 2 A N N U A L R E P O R T 2002
  • 13.
    “Tele2 is theonly telecom company with a pan-European market in fixed telephony.” Tele2 is one of the few profitable European point remains the same as in the past. We Communication is fun, and fun shouldn’t telecom operators, our operations attract gain a major advantage from expanding our cost too much. substantial positive interest from the EU 3G network in Sweden in cooperation with By rolling out Tele2’s concept across and national regulatory authorities. As the Telia. Our 3G operations will most likely be Europe and taking our experience with us sole alternative pan-European telecom profitable earlier than in any other from previously deregulated markets, we operator, we are currently one of the few European country. Our plan to commence are gaining a profitable customer base in examples of the positive effects of dereg- commercial 3G operations at the end of country after country. ulation for companies and consumers. 2003 remains in place. But for consumers, But there’s no shortage of challenges. Competition must continue in order to voice communications, SMS and MMS will My colleagues and I continue to focus on ensure consumer value. This means that remain the most important features. offering additional services to our enor- the supervisory authorities have an interest Subsequently, long-term 3G factors will mous customer base. This is a guarantee in maintaining competition. I definitely impact positively on earnings. But also in for continued growth and increased prof- feel that this represents a significant guar- this case I believe that our close-to-the- itability in the sprit of a small company. antee against national protection of the customer work approach will offer advan- former monopolies regaining the upper tages. Our dialogue with customers is filled Stockholm, February 2003 hand. But there are definitely countries in with respect and interest in the customer’s which one would wish for greater pressure requirements. Not least, we are following for change. This applies primarily to with great interest the use of mobile tele- Germany, but even in France this would be phony among young women, whom to date Lars-Johan Jarnheimer very desirable. have been major trendsetters in this area. UMTS (3G) continues to be a topical A key factor underlying Tele2’s success subject. I never expected rapid 3G devel- is that we communicate with our cus- opment and therefore my message on this tomers in a way that appeals to them. 11
  • 14.
    Market – continuinggrowth The European telecom market is charac- Continuing growth and market conditions permit. Tele2 has a terized by stiff competition, acquisitions At the same time as competition is stiff- history of offering customers attractive and mergers – but also by continuing ening, the telecom market continues to products at competitive prices. growth in demand. expand. For example, the total market for Following deregulation in the EU, fixed telephony, mobile telecom services Varying progress in deregulation numerous new players established a pres- and Internet access in Sweden rose 7% EU telecom markets were deregulated to ence in the market, at the same time as during the first six months of 2002, com- stimulate greater competition. The intro- the former monopolies expanded into new pared with the same period a year earlier. duction of new legislation designed to lead geographic markets. A central driving force in the market is to increased competition has, however, Following a wave of investments in 3G that customers are increasingly seeking progressed differently in various countries. licenses, data networks and other applica- total telecom solutions. Tele2 has access Germany, for example, has fallen behind tions, many companies have abandoned to services and expertise in mobile teleph- other countries as regards local carrier pre- the market, either as result of acquisition ony, fixed telephony, Internet, data net- selection. In those countries in which local or bankruptcy. One feature of the com- works, cable-TV and broadband and is pre-selection is made available for players panies that were pushed out is that they working continually to transfer know-how other than the former monopolies, such as lacked financial strength and/or a feasible among the various areas and countries to France and Italy, Tele2 has gained consid- business model. This trend has created strengthen its customer offering. Tele2 has erable successes. opportunities for Tele2 to acquire cus- had major success in cross selling new Also, the EU Commission believes there tomers from these companies. products to its existing customer base. is no effective competition in, for example, In markets in which Tele2 is relatively broadband services via access networks, recently established, the strategy is to add meaning copper wire that connects switch- new services and products as deregulation es with end customers. The pricing applied 12
  • 15.
    by the formermonopolies discriminates leases an existing network and thus avoids with Telenor. Tele2 is already active as an against newcomers. building a new mobile network. MVNO in Denmark and the Netherlands, Also, interconnect traffic charges are an The difference between MVNO and SP and during 2002, an MVNO agreement area in which improvements are required. is a fundamental one. In the latter case, was signed with Connect Austria in Austria, The interconnect traffic charge is the fee the operator becomes a vendor of another where service was launched in February paid by a telecom operator to enter the company’s telephony, since it only handles 2003. access network. Interconnect traffic outgoing traffic. MVNO means simply that charges are one of the largest expense a mobile operator purchases radio access UMTS – third generation mobile telephony items for Tele2. Consequently, lower inter- from an existing mobile operator, but is Tele2 holds UMTS licenses for third gen- connect traffic charges provide highly pos- otherwise completely independent and can eration telephony in Sweden, Finland itive effects. develop services, payment forms and (through joint ownership of Suomen The pricing originates from the former direct traffic accordingly as if it were a con- Kolmegee Oy), Liechtenstein, Luxembourg monopoly’s attempts to retain control of ventional mobile operator. The only differ- and Latvia. the access network. It is only when these ence between a conventional operator and In an effort to keep down costs of con- – and thus subscriptions – are exposed to a real MVNO is that the MVNO has no con- struction and operation of the UMTS net- competition that deregulation of the mar- trol of coverage build-out. For the cus- work in Sweden, Tele2 and Telia have ket will have a full impact. tomer, there is no difference between hav- established a jointly owned company, ing a subscription with a conventional Svenska UMTS-nät AB. Costs are curtailed MVNO offers new growth opportunities operator or having one with an MVNO. through the use of both companies’ exist- In cases in which deregulation is effective, The model opens major growth oppor- ing infrastructure, such as telecom masts. new markets are opened up to new forms tunities for a company like Tele2, which Tele2 has a strong brand, large cus- of service suppliers. Both Mobile Virtual has a large customer base in many coun- tomer base, service development close to Network Operators (MVNO) and Service tries but which does not have its own infra- customers, an efficient organization and Providers (SP) have emerged as new busi- structure. During the year, Tele2 returned comprehensive technical know-how – fac- ness models that add to competition in the its UMTS license in Norway and instead tors that suggest success in the market for mobile market. In both cases, the operator elected to conclude an MVNO agreement 3G-based services. 13
  • 16.
    Business concept Based oncustomers’ needs, Tele2 shall through simple, customer-friendly sevices and the lowest price have the most satisfied customers in the market. This is Tele2 Values Tele2, formed in 1993, is the leading alternative Tele2’s corporate culture rests on three pan-European telecommunications company and fundamental values: is active in GSM, public telecommunications and • flexibility data networks, as well as Internet and cable-TV • informality services. • cost-consciousness Tele2’s organization Tele2 AB Lars-Johan Jarnheimer, CEO Håkan Zadler, CFO Nordic Eastern Europe Central Europe Southern Europe Luxembourg Branded products and Russia Germany France & services Sweden Luxembourg Norway Estonia Netherlands Italy Liechtenstein C3 Denmark Latvia Switzerland Spain Belgium United Kingdom Finland Lithuania Austria Portugal 3C Everyday Optimal Telecom Poland Ireland Transac Datametrix Czech Republic Russia X-source 14 T E L E 2 A N N U A L R E P O R T 2002
  • 17.
    Strength factors: Strategies • profitability The company’s strategy is reflected in: • low rates • Being the price-leading operator in all markets in which the Group is present. • large customer base • Price-leadership and the role of challenger to the • industry-leading efficiency former monopolies have been decisive factors in • well-known brands successfully securing new customers and thus • flexibility Tele2’s growth. • prompt adjustment to new customer • When expanding into new markets, the aim is requirements and market conditions to rapidly build up a customer base that can • committed and skilled employees subsequently be cross sold services in pace with market maturity and deregulation to offer more people the opportunity to communicate less expensively through Tele2. Business model In existing markets in continental Europe, when it is not necessary. In countries in Baltic states are extremely important for future growth is expected to derive largely which Tele2 owns infrastructure, it would expansion in Russia. Know-how and experi- from the cross-selling of services and not have been possible to compete with the ence from the Baltic market can be used products to the existing customer base. In former monopoly without access to propri- to gain efficient growth in Russia. less mature markets, the penetration rate etary infrastructure. remains relatively low, permitting rapid The objective in each country is to reach Rapid growth growth when an increasing number of a positive operating income before depre- In 2002, Tele2 was the fastest growing people demand attractive communications ciation/amortization within three years telecom operator in Europe, thereby con- services. Tele2 is also monitoring countries from the start of operations. Tele2 has firming the functional nature of its busi- bordering on current market areas. achieved this in all markets except ness model. Tele2 consistently attempts to transfer Germany, where deregulation has lagged know-how among its various product areas behind the rest of Europe. Quality and countries. Customer offerings and suc- In Southern Europe, with France and Tele2 has a quality policy that serves as a cessful concepts create synergies since Italy as the largest markets, Tele2 has guide for all operations in the Group. One they can be more used effectively in sev- established itself as a strong brand and has of the most important means of attaining eral markets, creating conditions for high- had great success in fixed telephony. the Group’s target is high quality in every- er profitability through economies of scale Operations in the Baltic States have thing it does. Tele2’s commitments, and better resource utilization. largely emulated Nordic activities with actions and products will be perceived as Cost-consciousness also entails not great success – the area is one of the most an expression of quality. The foundation contracting and owning infrastructure rapidly growing in mobile telephony. The comprises the Group’s values and accu- 15
  • 18.
    Business model cont. mulatedexpertise. Constant improvement The rapid addition of new customers in with an expected introduction in Germany is the work motto. the Baltic States is driven by mobile tele- during 2003, revenues in Central Europe The experience of a product or service phony and particularly the prepaid card. In will grow in 2003 without triggering any must always meet the customer’s expect- Latvia, Tele2 acquired one of two UTMS rise in costs. As an MVNO, new possibili- ations. The customer is the center of atten- licenses. In January 2003, the market ties for growth are created. Tele2 has an tion and the key quality benchmark is cus- opened for fixed telephony and Tele2 MVNO agreement with Telenor in Norway, tomer satisfaction. Customer surveys are expects to introduce services during the with launch planned for the first quarter of conducted regularly in an effort to improve first half of the year. Tele2 launched fixed 2003. During 2002, Tele2 rolled out an results consistently. Customers must telephony in Poland during the first quarter MVNO in the Netherlands and signed an always feel confidence in Tele2 as a sup- of 2003 and plans to introduce local pre- MVNO agreement with Connect Austria in plier. selection in the Czech Republic during the Austria. year. In February 2003, Tele2 acquired Alpha Opportunities in 2003 In Continental Europe, fixed telephony Telecom, the leading prepaid fixed tele- During 2002, Tele2 grew faster than its operations continued to post strong growth phony operator in the UK for private indi- competitors, generated the best cash flow in 2002 and at year-end had 8.5 million viduals and the market leader in prepaid and improved earnings sharply. customers. Central Europe and Southern cards for fixed telephony. Alpha will ben- Maintaining the balance between cus- Europe combined reached breakeven at efit from Tele2’s strong market position tomer growth, profitability and cash flow the EBITDA level during the year. and will be able to expand to Tele2’s mar- continues to be the priority in 2003. Introduction of local pre-selection in kets in Europe. Tele2’s mobile operations are “Best in Southern Europe fueled Tele2’s very rapid Class” with very favorable margins in development in the market area. Fixed Sweden. Tele2 has more than 3 million telephony was launched in Portugal in mobile customers in Sweden. Profitability 2003. in the Swedish fixed telephony operations With local pre-selection available in the continues to be good. Netherlands since August 1, 2002, and Good positioning Tele2 always aims to improve 16 T E L E 2 A N N U A L R E P O R T 2002
  • 19.
    Products and services Tele2offers fixed telephony, mobile telephony, Internet services, and data network services, cable-TV and content services in 22 countries in Europe. Tele2’s product strategy is to have a joint product portfolio with fixed telephony as a base and add dial-up Internet services, mobile telephony and broadband when the market in each country is sufficiently mature. This strategy permits Tele2 to deliver and continually improve products that satisfy customer demands for low-cost, high-quality communications services. Fixed telephony Prepaid telephony Prepaid fixed telephony means that the customer pays his/her own “call account” which they then use when calling via the Carrier Pre-select fixed telecom network. For Tele2, the Pre-selection means that customers can service means fewer unpaid receivables, select to use Tele2’s lower prices for their lower customer churn and reduced invoicing fixed telephony. They no longer need to dial costs, and at the same time, it is positive a prefix. Local pre-selection means that for cash flow. Tele2 also takes charge of local calls via Tele2 has had considerable success pre-selection. with prepaid fixed telephony in France, Following deregulation in France, Italy Italy, Spain and Finland. and the Netherlands – Tele2 began to offer iHear stores and news stands. C3 works closely customers cheaper call rates using Tele2 iHear is a cordless telephone equipped with Tele2, which provides the network via pre-selection. Tele2 continues to work with a calling-router that always connects capacity. with the authorities in countries in which pre-selection and local pre-selection have the call via Tele2, and thus provides access not yet been deregulated. to the company’s attractive rates. In recent Telephone booths, Internet The access network, meaning the cop- years, Tele2 has used the iHear telephone terminals and WLAN Hot Spots successfully to increase customer satis- Via 3C Communications, Tele2 operates per wire connecting households with the faction, customer loyalty and call volumes. credit card-based telephone kiosks and telecom network, is still not open to com- The telephone is particularly effective in Internet terminals in hotels, restaurants petition but is instead handled almost ex- countries where pre-selection is not avail- and other well-frequented locations clusively by Europe’s former telecom mon- able. Tele2 launched the latest Dect 3 throughout Europe. The kiosks and termin- opolies. As a result, customers who have model of iHear in 2002. als are an excellent base for adding WLAN selected an alternative, must pay sub- Hot Spots (Wireless LAN) which permit a scription charges to the former monopoly. Telephone cards link up with portable computers. Tele2 However, we have succeeded in offering Since 1999, C – Calling Card Company – 3 operates via the operator organization subscriptions to customers in Denmark has sold calling cards for fixed telephony Pass-One for global roaming among vari- and we are intensively pursuing this issue in a number of markets in Europe. The call- ous Hot Spots. in other countries. This gives our cus- tomers one invoice and a better overview ing card is available in different denomi- of their telephony costs, resulting in more nations for domestic and international VoIP calls and features a code. The customer Voice over Internet Protocol – telephony via satisfied customers and notably lower cus- calls up the number indicated on the card the Internet. tomer turnover. and dials in his/her code – then it’s just a During 2002, Tele2 conducted a num- matter of calling cheaper with Tele2. ber of successful tests using VoIP in broad- The calling card is marketed under a band networks. number of brands and is sold primarily in 17
  • 20.
    Mobile telephony make calls outside Sweden using a pre- paid card. This service has proved to be very successful. Tele2 offers mobile telephony via a number UMTS of subscription forms and prepaid cards. UMTS technology increases capacity in Regardless of whether the service targets mobile networks considerably compared infrastructure. Capacity is leased instead consumers or the corporate market, it is with GSM. Tele2 believes firmly that third from a network owner. In countries in positioned as price leader. generation mobile telephony, 3G, will which Tele2 does not have a mobile Having a mobile telephone with a pre- involve a revolution for access to personal license, the MVNO concept permits Tele2 paid card is growing in popularity and has information and entertainment by con- to supply fixed telephony with a full range contributed to Tele2’s rapid growth. It’s necting mobile customers with mobile of services in subscription and prepaid easy to understand why many people opt broadband services such as e-mail, image calling cards for mobile telephony. for prepaid calling cards. Customers can services, games and content portals. Tele2 expects MVNO´s to expand in the start calling immediately, they have good Tele2 has UMTS licenses in Sweden, immediate future, since deregulation of control of their telephone costs and can Finland (via the jointly owned Suomen the EU telecom market is gaining an always check how much credit they have Kolmegee Oy), Luxembourg, Liechtenstein impact and the mobile market is maturing. left. They also avoid bills and credit and Latvia. Tele2 operates as a MVNO in Denmark and appraisals are unnecessary. the Netherlands. During 2002, a MVNO A major innovation in Sweden during MVNO agreement was signed with Telenor in 2002 was the introduction of a service MVNO – Mobile Virtual Network Operator Norway and with Connect Austria in allowing Tele2 customers to receive and – means that Tele2 can act as a complete Austria, where the service was subse- mobile operator without owning its own quently launched in February 2003. Internet services the conventional network are impossible due to technical, legal or business reasons. The success of wireless broadband also indicates that the former monopolies have Dial-up Internet an erroneous and ongoing monopolistic Dial-up Internet means that customers are approach in the pricing of broadband ser- not permanently connected but can use a vices. modem when they wish to link up to the Tele2 offers wireless broadband via WLL Internet. Dial-up Internet is available in in parts of Poland, Czech Republic, subscription form and as a link-up without Finland, Norway, Sweden and Denmark. a fixed charge, for which customers pay Metropolitan Area Networks only for the time they are connected. The ADSL Tele2 offers broadband at 10 Mbit/s in a primary growth in the area is represented ADSL – Asymmetric Digital Subscriber Line number of MANs (Metropolitan Area by connections without a fixed charge. – is a technology that permits the use of Networks) in Sweden and Denmark. Tele2 is the market leader in Scandi- broadband via conventional telephone In Sweden, the MAN is linked to Tele2’s navia for dial-up Internet and has very suc- lines. This area offers major potential, wide-ranging trunk network, Swipnet, cessfully launched Internet with subscrip- especially since customers find the product which was the first commercial IP network tions as base in France and Italy in 2002. easy to use by customers, although pricing in Sweden. In Denmark, MAN is linked to Dial-up Internet will be launched in more by the former monopolies presents a major the country’s largest trunk network. countries during 2003. The Internet product obstacle to future growth. Tele2 is active- is continually upgraded with new services. ly continuing its efforts to find solutions to Broadband via cable-TV the monopoly problem. As early as 1998 in Sweden, Tele2 began Wireless broadband Tele2 offers ADSL in Sweden, Norway, to offer broadband using cable-TV as the Broadband is a method for transferring Denmark and Switzerland. Tele2’s ADSL carrier. During 2001 and 2002, a large data in the form of text, images and voice services have made a definite impact in the portion of the network was upgraded to at very high speeds. Wireless broadband Nordic market and the company has con- handle broadband. The offering is one of via WLL (Wireless Local Loop, via radio net- solidated its position as the largest Internet the cheapest on the market. works) is a way of circumventing the access supplier in Scandinavia. ADSL will be intro- Tele2 also offers broadband via cable- network when broadband connections via duced in additional countries in 2003. TV network in Estonia and Lithuania. 18 T E L E 2 A N N U A L R E P O R T 2002
  • 21.
    Cable-TV Under the Kabelvisionbrand, Tele2 offers one of the market’s best basic packages in Sweden at an attractive price. Kabel- vision’s basic package (Pluspaket) offers access to 15 popular TV channels such as MTV, Visasat Sport, Discovery, Eurosport and E!. In addition, Kabelvision offers two highly competitive expanded packages, Silver and Gold, as well as premium channels such as Canal+ and TV1000. Available throughout Sweden, Kabelvision has 310,000 household subscribers – making it the country’s second largest cable-TV operator. Tele2 also conducts cable-TV operations in Estonia and Lithuania. Content services Tele2’s strategy is to organize but not During the year, the Tele2 SelfNavigator develop content services (e-mail, news, service was launched, permitting cus- games, ringtones, image services) which tomers to review, add to or terminate cer- makes things easier for our customers. The tain services on the Internet. It is also pos- services are linked to the portal sible to view billing information and account Tele2Internet that can be accessed irre- information. spective of the form of communication. Tele2 also offers a large amount of SMS Tele2 has a payment solution attached to and WAP-based services in various mar- the platform for micro-payments to the kets. For example, Tele2 was one of the companies supplying services, indepen- first companies in Estonia to offer payment dens of access. The business model is of parking charges via mobile telephone. based on distribution of revenue. Tele2 was also the first operator to give customers in Luxembourg the potential to send images using MMS. 19
  • 22.
    Market position among alternative Service Launch operators Sweden Mobile 1981 Market area Fixed Internet Cable TV 1993 1991 1986 1 Nordic Norway Mobile 2000 Fixed Internet 1998 1997 1 Denmark Mobile 2000 Fixed Internet 1996 1997 1 Finland Fixed 2000 Internet 2001 Sweden Comviq was the first operator in Sweden Tele2 was established in Sweden and this to offer all prepaid card customers the market accounts for the Group’s broadest opportunity to call and receive calls from Market area’s share of the Group’s 43% product portfolio. Sweden is also a key test market for new services and their develop- ment, which are subsequently implement- abroad. For corporate customers, Tele2 launched mobile centrex, which offers the potential net sales ed in other Tele2 countries. to use switch functions directly in the During 2002, Tele2 Sweden sharpened mobile phone. Customers are seeking to its focus on profitability and sales volumes. integrate solutions between fixed and Efforts in this direction have highlighted mobile telephony and the launch of cen- the primary products – mobile telephony, trex is a step in this direction. 2002 2001 Change fixed telephony, Internet, data network ser- vices and cable-TV. Fixed telephony Number of In February Tele2’s fixed telephony cus- customers, 000s 6,252* 6,274 Sharper customer focus tomers were also offered pre-selection for Net sales, SEK M 13,566 11,898 +14% Two customer areas were created: Private local calls. This means that customers Customers and Corporate Customers. The were also able to benefit from Tele2’s low EBITDA, SEK M 4,814 3,768 +28% customer areas are in charge of services prices for local calls. Tele2 is working *including adjustment to the Group’s definition of active customer and packaging as well as for reaching their towards achieving a solution to offer fixed preset profitability targets. The change has telephony susbcriptions, since this offers Brands Tele2, Comviq, Kabelvision, Datametrix, led to a clear customer focus. The primary additional potential to reduce customer Uni2, Optimal, Tango, Everyday, Get2Net results are more effective distribution as costs and enhance customer loyalty. well as a distinct product offering. The 2002 Increased market shares measures are a major factor underlying Launch of ADSL Improved profitability higher profitability and have been con- In the case of Internet customers, the ducted in all product areas. focus has been on ADSL, which was launched in June. Due to unreasonable Higher market shares pricing from the network owner, Tele2 is “We’re stronger Tele2 Sweden won market share in all unfortunately unable to offer a price that is substantially below that of competitors. than ever in the product areas. The most aggressive growth However, it is gratifying to see that the dial- was noted in Comviq prepaid, with the num- Nordic region.” ber of customers exceeding two million dur- up Internet service, Free2Connect, has ing autumn 2002. The total number of cus- shown stable growth. Fredrik Berglund tomers exceeded three million at year-end. Tele2 also launched IP-VPN for the data Market Area Director, Nordic network market. The launch marked a Consolidated price position in mobile major sales success and it is planned to Tele2 has consolidated its price position in enhance the product portfolio in data net- the private and corporate markets. Private works during 2002. customers are offered “Five ways of calling more cheaply” and corporate cus- Stronger brands tomers have two new subscriptions A logical development of the above is the “Company” and “Company+”. At the close growing recognition of the Tele2 and of the year, Comviq celebrated its 10th Comviq brands. Currently, 97% of anniversary with a number of activities, Sweden’s population recognizes both which included presenting existing and brands. 20 T E L E 2 A N N U A L R E P O R T 2002 new customers with lower calling prices.
  • 23.
    A taste foraction Tele2 – in pole position Norway In September Tele2 signed an MVNO In August, Tele2 launched its ADSL ser- Despite a slower growth rate in the market agreement with Telenor. The agreement vice for households, which offers cus- as a whole, Tele2 continued to expand and offers Tele2 the potential to transfer cus- tomers access to the market’s lowest rates. win market share. Growth, combined with tomers currently covered by the present cost control, resulted in record high prof- Service Provider agreement to the more Corporate market itability for Tele2 Norway. competitive MVNO service. The agreement Tele2 has a complete range of services for permits Tele2 to develop new, price-lead- companies, but focuses particularly on Fixed telephony ing services for its customers in Norway. offering standardized package solutions to Tele2 strengthened its customer offering In November, Tele2 returned its UMTS small and large companies. Standard- and sales rose throughout the year, despite license to the Norwegian authorities. ization of the product portfolio is a suc- aggressive marketing from old and new Consequently, Tele2 no longer has any cessful concept in reaching profitability in competitors. commitments or expenses linked to the the corporate market. expansion of the UMTS network in Norway. Mobile telephony Denmark Tele2 increased its market share and Internet The Danish telecom market is undergoing strengthened its position in the mobile Although the market for dial-up Internet restructuring and consolidation. A number market, with revenue showing a stable continued to weaken in 2002, Tele2 man- of players have withdrawn from the mar- increase during 2002. aged to raise its market share. Marketing ket. Tele2 is continually seeking to max- Tele2 successfully recruited mobile campaigns in January and December were imise the resulting emerging opportuni- customers from Tele2’s existing customer successful in recruiting a substantial num- ties. base in fixed telephony. Cross-selling ber of new customers. Cross-selling has Tele2 focused on controlling growth and offers lower costs in attracting new cus- also proved to be highly successful, result- costs and is entering 2003 with good tomers, moreover this type of customer ing in a larger number of more loyal cus- prospects in terms of growth and earnings. calls more frequently and is more loyal tomers. than other customer groups. 21
  • 24.
    Mobile telephony Tele2 operates a Wireless Local Loop for Datametrix 2002 was a year of consolidation, restruc- broadband in Jyväskylä. The service was Datametrix is a strong system integrator in turing and reassessment of the market for launched in spring 2002 and Tele2 is the Nordic market. The company is char- Danish mobile operators. Prices in the pri- studying the possibility of expanding into acterized by good geographic coverage, vate market have declined and competi- other cities with other network owners. flexibility and cost-consciousness. tion continues to be tough. Tele2 conduct- The market is driven by the develop- ed measures aimed at raising profitability Monopolistic market ment of conventional telephony with innova- from mobile services, which led to a reduc- The monopolistic nature of the Finnish tive applications and the ever-growing tion in costs for customer procurement and market means that Tele2 cannot yet offer demand for mobile solutions. IP telephony an increase in call volume per customer. local calls. Nevertheless the number of has established itself as a competitive During early 2002, Tele2 launched a customers and revenue rose during 2002. alternative for commercial applications. subscription service, which reported rapid During the year, new agreements were growth. signed covering international calls and other Sweden services that reduce costs for Tele2. During The Swedish organization has been Internet 2002, Tele2 moved from the development streamlined and is now focusing on IP Tele2 ASDL was launched in August 2002. phase to greater customer focus and further telephony and system integration of tele- The strategy is to attain balanced and cost developed its fixed telephony services, phony and data. Like Tele2, Datametrix is effective growth. The launch of broadband which were launched in autumn 2001. a unique total solution supplier with a has meant a reduction in dial-up traffic in strong product and service profile. the overall market. But customer intake Optimal Telecom continues nonetheless. Optimal Telecom is a Service Provider Norway A review of the company and its inter- offering individuals fixed telephony and In November 2002, Datametrix in Norway nal processes permitted the achievement Internet and the Tango prepaid calling card celebrated its 20th anniversary. The com- of synergies between Tele2 and UNi2, the for mobile telephony. pany has developed into a prominent sys- brand for corporate Internet. tems integrator in the Norwegian market. Lowest-price guarantee It has become a market heavyweight Fixed telephony Optimal Telecom’s lowest price guarantee through its consistent efforts in its three During the year, Tele2 launched what automatically gives customers the lowest core areas: infrastructure, IP telephony could be viewed as an alternative to fixed ordinary rate from Telia, Tele2, TeleNordia, and security. price telephony, namely, the Weekend+ Rix Telecom, Utfors, Glocalnet and ACN. The service, which offers 24-hour free tele- guarantee is the primary factor underlying Denmark phony each Sunday. The service attracted Optimal Telecom’s high customer loyalty. In September, Datametrix in Denmark was considerable attention and appeals to the Optimal Telecom also sells cordless ranked number 18 on the Børsen Gazelle conservative, fixed telephony market. telephones and speaker telephones index of the fastest growing companies in Two small operators with the corporate equipped with a calling-router, which Denmark, computed by the daily paper sector as their niche were acquired during means calls are always handled by Optimal Børsens Gazelle index. The factor underly- the year, which contributed to an increase Telecom. ing the success of Datametrix is its keen in the customer base and revenue in the focus on products for the call-center mar- corporate segment. Expansion in the private market ket. At the end of the year, the Danish Optimal Telecom continued to report authorities presented new regulations that robust growth in fixed and mobile teleph- Partners entail a reduction in interconnect charges ony, while the company also raised prof- In May 2002, Datametrix was appointed in certain areas during 2003. itability, despite stiff competition in the Norway Gold Partner to Cisco. This is con- market. firmation of the company’s leading-edge Finland During 2003, the focus is on generat- expertise and business skills. In Sweden, Tele2 offers fixed telephony in Finland in ing continued growth and improved prof- the company is Gold Partner to Avaya and the form of domestic calls, international itability in fixed and mobile telephony a certified Ericsson Service and Sales calls and calling cards. In the Helsinki through increased cross-selling and build- Partner. During the year, Datametrix signed area, dial-up Internet is also offered. The ing long-term customer relations. an OEM agreement with Intel, making it launch of iHear telephones commenced in the sole vendor of Intel’s product line for the summer of 2002. VPN in Sweden. 22 T E L E 2 A N N U A L R E P O R T 2002
  • 25.
    Market position among alternative Licenses Launch* operators Market area Estonia Mobile 1998 Fixed Cable-TV 1998 1998 1 Eastern Europe Latvia Mobile 1999 1 and Russia Lithuania Mobile 2000 2 Czech Republic Fixed Internet 2002 2000 1 Poland Fixed 2003 Internet 2000 Russia Estonia Tele2 offers mobile telephony in eleven regions in Russia. Most of the companies Tele2 in Estonia offers a broad range of telecom services: mobile telephony (sub- Russia Mobile 7 operate under the FORA brand. In scription and prepaid calling cards), fixed *Year of launch by Tele2 November Tele2 sold its share of the telephony, Internet, content services and Moscow-based NMT450 operator MCC. Preparations for GSM cable-TV. 2002 was one of the most successful years in the history of the company. The Market area’s share of the Group’s 8% During the year, Tele2 received GSM sharp growth from 2001 continued into net sales licenses for Nishny Novgorod, Chelyabinsk 2002. Tele2 is the most rapidly growing and the St Petersburg region. Thus, all mobile operator in Estonia and now has a companies have licenses for GSM1800 tight grip on the second place in the mar- and work is in progress to launch the first ket. Tele2 now commands one-third of the regions during 2003. Estonian mobile market. 2002 2001 Change Tele2 is also clearly the leading alter- Calling Party Pays native operator in fixed telephony. Number of customers, 000s 1,574 996 +58% Tele2’s company in Omsk was the first mobile operator to launch CPP (Calling Supplementary services launched Net sales, SEK M 2,320 1,148 +102% Party Pays) services, which, as the name During 2002, several supplementary ser- EBITDA, SEK M 541 272 +99% implies, means that the calling person vices were launched that create added pays the call. CPP is unusual in Russia, value for customers and which offer com- where it is most common that the mobile petitive advantages for Tele2. Among other Brands Tele2, Fora, C gates, Zeta Zivtina telephone owner pays (MPP, Mobile Party points, Tele2 is the only mobile operator to Pays), even when that person is called. date that offers pan-Baltic roaming for pre- 2002 Revenue doubled CPP has proved to be an attractive and paid customers. Tele2 has also introduced Continuing profitability effective means of competition in the a uniform invoice for customers who have Russia market. Tele2 has also launched fixed as well as mobile telephony. CPP in Chelyabinsk. During 2003, Tele2 “Tele2 is growing rapidly will continue its efforts in negotiating Attractive services in the Baltic States, with agreements for CPP in other regions. Tele2 is very positive about prospects in 2003, not least because of a highly attract- more than one million Outlook for 2003 ive product and service offering, although satisfied customers.” Prospects for the Russian economy in competition in the Estonian market has 2003 are positive. The mobile telephone stiffened in recent times. Johnny Svedberg Market Area Director, Eastern Europe and Russia market expanded by 125% in 2002. Rapid growth is expected to continue during the current year. The customer segments now seeking to acquire mobile telephones are the middle class, middle management in companies and small business owners, which traditionally have been strong cus- tomer groups for Tele2. 23
  • 26.
    Tele2 fångar destora fiskarna Thrives on competition Tele2 – more efficient than the old monopolies Latvia vice means that both subscription and pre- Recognition of Tele2 is very high. 80% Tele2 is the leading alternative mobile paid customers can call from anywhere in of Latvians recognize the brand, even operator in Latvia. The company’s growth the Baltic States and still enjoy call rates though it was launched less than two years is being driven particularly by the success as if they were at home in Latvia. ago. This level of recognition is reflected in prepaid calling cards. Tele2 plans to Prepaid customers now get a bonus in growth: Tele2 is the most rapidly grow- launch fixed telephony during 2003. when they are called, which contributes to ing telecom company in Latvia. raising call volumes. They can also refill Leader in the prepaid calling card market the prepaid card directly from their bank Tele2 leads the market for prepaid calling account, all that is required is an SMS – cards with Zelta Zivtina, “Gold Fish”. making it simple for customers and offer- Subscription services are the leading alter- ing a cost saving for Tele2. native to the former monopoly. A new ser- 24 T E L E 2 A N N U A L R E P O R T 2002
  • 27.
    Increasingly comprehensive range Deregulation of fixed telephony In early 2002, Tele2 became the first During 2002, Tele2 acquired one of two There are good prospects for the strong company to win a public license for fixed UMTS licenses in Latvia. Tele2 also has growth in mobile telephony continuing. telephony. Negotiations for an intercon- one of the two GSM licenses (900 and The market for fixed telephony was deregu- nect traffic agreement with the former 1800) for Internet services and a license lated in 2003 and Tele2 will maximise the monopoly were concluded in December for broadband via radio networks. An opportunities for cross-selling as they and the launch of fixed telephony is application for fixed telephony has been emerge. planned for the first quarter of 2003. submitted, and Tele2 expects an allocation during early 2003. Cable-TV and broadband Deregulation heralds new opportunities During 2002, Tele2 achieved a dominant In November 2002, Tele2 signed a distri- Exciting development position in cable-TV in all the company’s bution agreement for its prepaid calling Both the customer base and revenue are areas in Vilnius. During the autumn the cards for fixed telephony with the Polish expected to rise when Tele2 enters the cable-TV network was expanded to cover all Post Office, which sharply increased the market for fixed telephony, at the same of Vilnius. number of sales outlets from 2,000 to time as it continues to fuel growth in The number of broadband customers 10,000. mobile telephony. doubled during the year. Tele2 offers cable- Since Poland has some of the highest TV and broadband under the C gates brand. telephony rates in Europe, there are major Lithuania opportunities awaiting Tele2 during the Since its start-up in Lithuania in 2000, first quarter of 2003 with the finalization Tele2 has established a strong position as Czech Republic of deregulation. This creates the potential the leading operator among private cus- Tele2 has strengthened its position as one for Tele2 to market a more comprehensive tomers. of the three largest suppliers of wireless service range in fixed telephony. Mobile penetration rose sharply in 2002 broadband in the Czech Republic and has and the customer base more than doubled. established a presence in the market for X-source Tele2 is winning market share at the fixed telephony. X-source operates in IT outsourcing. The expense of the two competitors; Bite and During 2002, Tele2 expanded wireless company was started by Tele2 in an effort Omnitel. broadband to an additional two cities and to support IT operations in the group. The the number of customers rose by 52%. head office is located in Stockholm. Strong brand Depending on the business terms and con- During 2002, X-source expanded and During the past year, strength and trust in ditions that can be achieved, Tele2 is like- opened offices in London, Luxembourg the Tele2 brand have grown considerably, ly to offer ADSL during 2003. and Copenhagen. It also took over part of with brand recognition rising to 71% dur- Transcom Sweden’s IT operations. As a ing the fourth quarter of 2002. A contribu- Success in fixed telephony result, X-source is now established in six tory factor is the fact that the GSM network In July, Tele2 became the first operator to locations in Sweden. The company plans was expanded so that it now covers a little conclude an interconnect traffic agree- to established a presence in the Baltic more than 90% of the population. ment with Cesky Telecom. The agreement States by spring 2003. permits private customers to call more Subscriptions launched cheaply with Tele2 by dialing a prefix. Competitive prices During the first quarter of 2002, the Joker Tele2 is now a well-known brand in the X-source offers services in operations and subscription service was launched, offer- Czech Republic and the largest alternative the development of PC workplaces, oper- ing the market’s lowest monthly charge operator in the private market. During ations and maintenance of servers, data com- and a price guarantee. During the third 2003 Tele2 plans to offer pre-selection munications and data security. X-source quarter, a subscription was launched that and local calls. introduces a business approach to PC work- is aimed at small and medium-sized com- places and assists client companies in panies. Poland creating a secure and controlled IT infra- Tele2 in Lithuania was also the first Tele2 Poland continued its rapid develop- structure, while simultaneously reducing IT operator to launch pan-Baltic roaming for ment in IP telephony and wireless broad- costs. prepaid customers. band access. The focus is on small and X-source’s services are also competitive medium-sized companies. The number of for companies outside the Tele2 Group. customers more than doubled during Customers include Datscha, Metro, MTG, 2002. Viasat, EIM. Iocore and Basset Support Solutions. 25
  • 28.
    Market position among alternative Licenses Launch operators Market area Germany Fixed 1998 3 The Netherlands Mobile Fixed 2001 1997 1 Central Europe Switzerland Mobile 2000 Fixed Internet 1998 2002 2 Austria Mobile Fixed 2003 1999 1 Ireland License for fixed telephony. Germany The Netherlands In 2002, Tele2 strengthened its position Tele2 bolstered its position as the second- Market area’s share of the Group’s 18% as the third-largest alternative operator in the German fixed telephony market and is currently one of the fastest-growing oper- largest alternative operator in the Dutch fixed telephony market in 2002. At the end of the year, 80% of the population was net sales ators in the country. familiar with the Tele2 brand. Focus on growth Fixed telephony Growth is the result of several measures Greater focus on pre-selection customers undertaken during the year such as a sim- and iHear phones led to a dramatic 2002 2001 Change plified price structure, successful market- increase in ARPU during the latter part of ing campaigns focusing on comparing 2002. Efforts to increase customer loyalty Number of Tele2’s prices with competitors’ and a dis- during the third and fourth quarter were customers, 000s 3,587 3,191 +12% tinct targeting of pre-selection customers. successful and contributed to the rise in Net sales, SEK M 5,689 4,844 +17% Combined with an increased focus on volume. With huge success, Tele2 focused measures to limit customer turnover, this its marketing on private customers, and EBITDA, SEK M –81 –606 will pave the way for sustained growth in market share increased during the year. 2003. Tele2Mobile – MVNO Brands Tele2, Everyday, Calling Card Company, 3C Deregulation lags behind rest of Europe Tele2Mobile experienced fantastic growth 2002 Sharp growth in earnings The deregulation of the German market as well as strong development during the Fixed telephony provides positive EBITDA has lagged behind the rest of Europe. For second half of 2002. Tele2 operates as a example: local calls are not deregulated, Mobile Virtual Network Operator, MVNO, pre-selection rules are more complicated and is the sixth-largest mobile operator in than in other countries and Deutsche the country. Cross-selling to current fixed Telekom is allowed to package its services telephony customers has proven to be suc- “Deregulation jointly despite the fact that local calls are cessful. Tele2’s success in the future is not open to competition. After strong pres- founded on its ability to offer fixed tele- opens up sure from the EU, Germany is expected to phony customers new services at more opportunities start a deregulation process in 2003. attractive rates. The marginal cost stem- ming from the new services is low. for Tele2.” Tele2 gaining greater brand recognition Tele2’s market strategy and comprehen- Switzerland Roman Schwarz sive cost efficiency guarantee that Tele2 Tele2 has become the second-largest alter- Market Area Director, Central Europe will survive as one of the strongest players native fixed operator in Switzerland fol- on the market. Market consolidation is pos- lowing its 1998 launch of fixed telephony itive because it weeds out many operators in the country. The company is known for that lack a sound business model. This its competitive rates, easy-to-understand eases pressure from future competition. pricing and for challenging the former Recognition of the Tele2 brand increased monopoly. dramatically in 2002. Tele2 is the third most recognized brand within fixed tele- phony. 26 T E L E 2 A N N U A L R E P O R T 2002
  • 29.
    Confident outlook Tele2 welcomes new challenges Simple pre-selection sign-up Austria Focus on growth Tele2 succeeded in building a strong base Tele2 is the largest alternative fixed tele- Tele2 will continue to focus on profitable of pre-selection customers, a feat made phony operator in Austria. The number of growth while exploring new business possible by actions such as being the first customers as well as operating revenue potential such as MVNO agreements and operator in Switzerland to take advantage rose during 2002. Tele2 is known for its other value-added services. The launch of of the so-called Third Party Verification, in attractive rates, excellent customer service mobile telephony as a MVNO occurred in which, as the name implies, a third party and reliability. early 2003. verifies that an agreement has actually been reached. This makes it easy for cus- Increased recognition of Tele2 Ireland tomers to sign up for pre-selection with one A growing number of Austrians know what Tele2 has a fixed telephony license in simple phone call. Tele2 represents and as many as 85% of Ireland. The launching of Tele2Mobile in May the population is familiar with the Tele2 2000, Tele2 Voicebox in April 2002 and brand. A high proportion of pre-selection Tele2 Internet ADSL in November 2002 customers and a low churn reflect a great has enabled Tele2 to broaden its product degree of customer satisfaction and loyalty. offering substantially and has strengthen During the year, the company intro- its market position. The focus is on private duced e-invoices and prepaid cards for customers as well as on small businesses international calls. and medium-size companies. 27
  • 30.
    Market position among alternative Licenses Launch operators Market area France Fixed Internet 1999 2002 1 Italy Fixed Internet 1999 2002 2 Southern Europe Spain Fixed 2001 4 Portugal Fixed 2003 Market area’s share of the Group’s 26% France Tele2 provides a complete range of fixed telephony services to private customers Italy Tele2 also has a complete range of services in fixed telephony in Italy. Tele2 is Italy’s net sales and smaller businesses: local calls, nation- second largest alternative operator, with a al calls, international calls and calls to market share of about 9%. mobile phones. Tele2 continued to experience fast- The company is the leading alternative paced growth in Italy in 2002. Compared operator in France with a market share of to 2001, revenues grew by more than 60% 2002 2001 Change 12%. With almost three million active cus- and traffic volumes rose 80%. The back- tomers and 50% of the market area’s rev- ground to the rapid growth is that Tele2 Number of enue, France is also one of Tele2’s largest has been offering all customers local calls customers, 000s 5,129 4,286 +20% operations. via pre-selection since 2001. Net sales, SEK M 8,105 5,124 +58% Price-leading operator Strong brands EBITDA, SEK M –101 –1,331 Tele2 is perceived as the price-leading With about 2 million customers and a high operator and is known for its quality and ARPU, Tele2 Italy is a strong and profitable customer service and for products that are part of the Group. Tele2, which is posi- Brands Tele2, Everyday, Calling Card Company, 3C easy to use. Tele2 enjoys a brand recogni- tioned as the price leader in the Italian 2002 Sharp rise in revenue growth tion rate exceeding 80% among the French market, is a well-known brand – more than Robust earnings trend population. The French market offers major 80% of the population recognizes it. potential for continuing growth. The strong Greater recognition of Tele2, combined brand offers Tele2 the potential to strength- with higher customer satisfaction, has en its position as the price-leading opera- increased customer loyalty. tor and keep down costs in order to attract new customers. Cross-selling to Tele2’s customers Tele2 benefits from being able to offer Higher revenue local calls and a stable competitive situa- The launch of local calls in 2002 con- tion. During the third quarter of 2002, “Tele2 continues to tributed to increases in revenue and cus- dial-up Internet was launched, which tomer loyalty and helped Tele2 to report proved to be a remarkable success. The attract an increasing profitability, three years after its opera- strategy of supplementing the product and tional start. The improvements were service offering to the existing customer number of customers.” gained at a very low cost. The trend towards base and an increased number of pre- profitability remained strong throughout selection customers creates the potential Jean-Louis Constanza Market Area Director, Southern Europe the year, especially during the fourth quar- for continuing growth. ter. Tele2 expects to launch ADSL suc- As in the case of Tele2 France, Tele2 cessfully this current year, against the Italy is undergoing strong development background of the access network being and the rapid customer intake has contin- opened up and the fact that Tele2 already ued in early 2003. has an attractive dial-up Internet offering. 28 T E L E 2 A N N U A L R E P O R T 2002
  • 31.
    Gillar utveckling A great future i Eurpoa Tele2 växer snabbast Tele2 for big and small Spain MVNO license In just a short period, Tele2 has estab- With a brand recognition rate of 60% lished itself in the Spanish market and is among the Spanish population, Tele2 is already the country’s fourth largest alter- beginning to capitalize on its marketing native operator. Tele2 offers prepaid fixed and effective IP-based network. Spain is telephony services for national calls, the first country in Southern Europe in international calls and calls to and from which Tele2 received an MVNO license. mobile networks. The prepaid services are highly effect- Portugal ive in curtailing billing costs, reducing bad Using Spain as the base, Tele2 is launch- debts and reducing churn. ing fixed telephony in Portugal during the Tele2’s revenue rose more than 160% first half of 2003. compared with 2001. 29
  • 32.
    Market position among alternative Licenses Launch operators Luxembourg Mobile 1998 Market area Fixed Internet 1999 2000 1 Liechtenstein Mobile 2000 Luxembourg Fixed Internet 2000 2000 1 Belgium Fixed 2003 Luxembourg 2002 and plans to offer UMTS services in Market area’s share of the Group’s 2% Tele2 has offered fixed telephony in Luxembourg since 1999 and is clearly the largest competitor to the former monopoly. the new network during the second half of 2003. Fixed telephony has been available under the Tele2 brand since June 2000. net sales Pre-selection customers comprise 40% of The company holds a license for GSM and the customer base. After repeated appeals for all types of fixed-line telecommunica- from Tele2, the authorities have forced the tion services, including the Internet. former monopoly to cut its interconnection fees by another 20% during 2003. In Belgium 2002 2001 Change March 2002, Tele2 began to offer prepaid Tele2 has a license for fixed telephony in Number of calling cards for fixed telephony. Belgium and services have been offered customers, 000s 222 211 +5% since January 2003. The goal is to quickly Growth in mobile telephony become the leading alternative to the for- Net sales, SEK M 754 663 +14% The Tango brand is one of the most appre- mer monopoly. EBITDA, SEK M 126 5 ciated in Luxembourg. With a GSM 900 and GSM 1800 license, Tango is the largest 3C mobile operator in Luxembourg with a share 3C has been active in public telecommu- Brands Tele2, Tango, Everyday, 3C, Transac of almost 50% of the active customers in nications for more than 17 years. the market. The traffic volume rose by The company currently offers integrated 2002 Increased revenue Higher profitability more than 40% compared to 2001, main- solutions for processing credit card trans- ly because of strong growth within prepaid actions, solutions for payments via the web calling cards. Tango received a UMTS and public credit card telephones. license in May 2002 and services in the 3C approves and processes credit card new network are scheduled for commercial transactions for 20 different national and launch in the second quarter of 2003. international banks. Its pan-European Everyday Media encompasses Tango TV presence in 650 hotels, 300 restaurants and Tango Radio. The main purpose for and 550 parking companies makes the this – apart from marketing Tango’s ser- company a unique player in the European “An exciting 2003 vices – is to create interactivity between market for integrated credit card transactions. with, among other the media and mobile telephony by using The Parking service is an overall con- SMS, MMS, WAP and IVR as bearers of cept for parking lot operators. The concept things, a launch content services being generated by the was developed in Britain, where 3C has media companies. 95% of the market for parking spaces at in Belgium.” the airports and in larger cities. Operations Internet services are being expanded to Sweden, Norway Jean-Claude Bintz Internet services were launched in June and Germany. Market Area Director, Luxembourg 2000 and are reporting steady growth, pri- 3C has credit card phones at major marily thanks to its prices, which are the European airports, hotel chains and trade lowest in the market. fairs. Liechtenstein Transac Tele2 is the largest alternative operator in Transac is a Luxembourg-based company Liechtenstein. The company has provided offering services in data processing to mobile telephony services in the country companies that process large amounts of since March 2000 under the Tango brand. data, such as credit card transactions and Tele2 was awarded a UMTS license in billing. 30 T E L E 2 A N N U A L R E P O R T 2002
  • 33.
    Market area Branded products& services United Kingdom Calling Card Company (C3) Tele2 launched fixed telephony in cooper- ation with the British Post Office in November 2001. Tele2 had already sup- C3 sells calling cards in the UK, France, Germany, Italy, the Netherlands, Spain and Austria and Tele2’s rechargeable interna- Market area’s share of the Group’s 3% net sales plied national and international access for tional call card, which may be used in a the Tele2 group. Prepaid calling cards for large number of countries. C3 operates in fixed telephony are sold under the Post close cooperation with Tele2, which sup- Office brand and may be purchased at post plies network capacity, with the focus on offices, via Post Office telephone services price and quality in international lines. or at the Post Office website. 2002 2001 Change Prepaid calling cards are sold mainly in During the year, the customer base in stores and kiosks, but C3 is continuing to Net sales, SEK M 848 1,408 –40% fixed telephony grew constantly and the seek additional sales channels. The pre- challenge ahead is to continue to capital- EBITDA, SEK M –172 –410 paid card was launched in cooperation ize on the major potential of the Post with the British Post Office in October Office brand, as represented by the Post 2001 and volumes increased steadily dur- Office’s 40,000 cashier counters at Brands Tele2, C3, iHear, Everyday ing 2002. 17,500 sales outlets. In February 2002, C3 won a tender from 2002 Success for calling cards Tele2 has successfully managed trials AAFES (American Army and Air Force) for Improved earnings to offer pre-selection services in the UK deliveries to bases in Italy, UK and the and will continue its launch during the Netherlands. In October, the agreement first quarter of 2003. was extended to include US naval bases. Access operations doubled their traffic After trials during the summer, Tele2 volume during the year as Tele2 increased was selected as the supplier of calling its presence in the tough market for access cards to the Travelex group in continental services in London. Europe. C3 doubled its volume in the sec- ond half of the year compared with the first iHear six months. Tele2 has its own product range of ana- C3 enhanced its prepaid calling card logue and digital cordless phones, which technology to permit calls from Call Shops, “Implementing are marketed under the brand name iHear. a service now available in France, Italy and successful marketing The telephones are equipped with a call- Spain, and which will be further expanded ing-router that automatically routes the to include the UK and Germany during the based on best practices calls to the Tele2 network. More than first half of 2003. 600,000 iHear telephones were sold Along with 3C, C3 has also developed a across Europe” across Europe during 2002, mainly through magnetic card that is undergoing trials in Anders Olsson telemarketing. Italy and the UK. Market Area Director, Branded products & sevices Everyday Tele2 owns the Internet portal Everyday.com jointly with MTG. 31
  • 34.
    Report of theBoard of Directors The Board of Directors herewith presents the Annual Report for Tele2 AB (publ) company registration number 556410-8917 for fiscal 2002. Tele2 AB’s share is listed on Stock- 667 million (2001: SEK 1,376 million) amounting to SEK 1.9 billion, and in- holmsbörsen (Stockholm Stock Exchange) and sales of shares amounted to SEK 40 creased pre-tax profit by more than SEK under the abbreviations TEL2A and TEL2B million (2001: SEK 236 million). 2.7 billion to SEK 796 million. Main- and Nasdaq under the abbreviations Tele2 had a total of 16.8 million cus- taining a balance between customer TLTOA and TLTOB. tomers at December 31, 2002, to which a growth, profitability and cash flow will con- The ten largest shareholders at one-off adjustment of –389,000 has been tinue to have priority during 2003, and as December 31, 2002 held shares corre- applied to adjust all Group companies to a result of this it is probable that the Board sponding to 60% (2001: 44%) of the cap- report in line with the Group’s definition of will propose a dividend for fiscal 2003. ital and 80% (2001: 72%) of the voting an active customer (see Note 36). Net cus- Fixed telephony operations in continen- rights, of which the Invik & Co AB, tomer intake for 2002 as a whole before tal Europe continue to show sharp growth Industriförvaltnings AB Kinnevik, Emesco this adjustment was 15%, corresponding and now have 8.5 million customers. and Millicom International Cellular S.A. to 2,195,000 (2001: 3,108,000). Tele2’s Combined, Southern and Central Europe owns 30%, 26%, 9% and 3%, respectively, operating revenue amounted to SEK reached breakeven at the EBITDA level of the voting rights, and 9%, 21%, 2% and 31,282 million (2001: SEK 25,085 mil- during 2002. Growth of 58% in Southern 7% of the capital. lion), or an increase of 25%. Europe is in turn being driven through the EBITDA amounted to SEK 5,127 mil- introduction of local carrier pre-selection. Operations lion (2001: SEK 1,698 million), with an This is encouraging since local pre-selec- Tele 2 AB, formed in 1993, is the leading EBITDA margin of 16% (2001: 7%). EBIT tion is about to be introduced in Germany alternative pan-European telecommunica- totaled SEK 1,530 million (2001:SEK during 2003, which will boost revenue in tions company offering fixed and mobile –1,356 million) with an EBIT margin of Central Europe without raising costs. The telephony, as well as data network and 5% (2001: –5%). EBITDA margin of 22% in our Swedish Internet services, under the brands Tele2, Net interest expense and other financial fixed telephony operations remains within Tango and Comviq to more than 16.8 mil- items totaled SEK –698 million (2001: our profitability target. Tele2’s mobile lion customers in 22 countries. Tele2 oper- SEK –621 million). The average interest operations are “Best in Class”, with EBITDA ates Datametrix, which specializes in sys- rate on outstanding liabilities was 6.4% in margins of 55% in Sweden, along with an tems integration; 3C Communications, 2002. Net profit after financial items impressive customer intake, notably in the which operates Internet payments, credit amounted to SEK 796 million (2001: SEK Baltic States. We are continuing to focus card transactions and public pay tele- –1,944 million). on cutting costs in an effort to win new phones; Transac, which offers data pro- Tax on net profit for the year amounted customers, reduce customer turnover, or cessing of credit card transactions and to SEK –574 million, which was positive- churn, and gain control over operating billing; C3, which is active in prepaid call- ly affected by SEK 576 million in respect expenses. ing cards for fixed telephony; and Optimal of a revaluation of loss carry-forwards in a Local carrier pre-selection is being Telecom, which offers households low number of European companies. In 2001, steadily introduced throughout Europe and price guarantees for telephony services. tax on net profit was SEK 2,335 million, already in 2002 it was widely available in, The Group also offers cable-TV services which reflected the tax effects in Swedish for example, Sweden, Denmark, France, and jointly owns the Internet portal operations, and a tax effect of SEK 3,082 Spain and Italy. Local pre-selection made Everyday.com with MTG. Tele2 AB’s share million in connection with the restructur- a major contribution to growth in Southern is listed on Stockholmsbörsen (Stockholm ing of SEC. Profit after tax was SEK 223 Europe during the year, with revenue surg- Exchange) under TEL2A and TEL2B and million (2001: SEK 392 million). Earnings ing by 58%. With local pre-selection on Nasdaq under TLTOA and TLTOB. per share were SEK 1.51 (2001: SEK already available in the Netherlands since During 2002, the Tele2 Group invested 2.70) after full dilution. August 2002 and with its introduction in a net of SEK 1,890 million (2001: SEK During 2002, not only did Tele2 grow Germany during 2003, Central Europe is 2,145 million) in intangible and tangible faster than its competitors, with an organ- expected to experience the same benefits fixed assets (see Not 32). Investments in ic growth of 25%, but also managed to during 2003. shares in companies amounted to SEK generate the record cash flow to date, 32 T E L E 2 A N N U A L R E P O R T 2002
  • 35.
    Five-year summary SEK million 2002* 2001 2000** 1999*** 1998 Income statement and balance sheet items: Operating revenue 31,282 25,085 12,440 8,171 5,918 EBITDA 5,127 1,698 1,820 2,060 1,165 EBIT 1,530 –1,356 420 1,152 506 EBT 796 –1,944 165 4,184 219 Net profit/loss 223 392 –396 3,768 53 Shareholders' equity 28,728 29,517 26,539 6,659 2,926 Shareholders' equity, after dilution 28,870 29,547 26,584 6,659 2,926 Balance sheet total 46,872 49,156 42,345 14,401 9,995 Cash flow from current operations 4,365 413 883 1,753 971 Liquidity 2,332 1,625 1,304 1,123 821 Net borrowing 7,729 9,286 7,095 4,605 4,600 Net borrowing, after dilution 7,587 9,256 7,050 4,605 4,600 Investments, including financial leases 2,581 1,485 774 1,475 1,941 Key figures: Solidity, % 61 60 63 46 29 Solidity, after dilution, % 61 60 63 46 29 Debt/equity ratio 0.27 0.31 0.27 0.69 1.57 EBITDA margin % 16.4 6.8 14.6 25.2 19.7 EBIT margin % 4.9 –5.4 3.4 14.1 8.6 Return on shareholders equity, % 0.8 1.4 –2.4 78.6 1.8 Return on shareholders equity, after dilution, % 0.8 1.4 –2.4 78.6 1.8 Return on capital employed, % 3.9 –3.3 1.9 45.2 6.8 Average interest expense, % 6.4 6.3 4.8 4.8 6.6 Average interest expense, after dilution, % 6.4 6.3 4.8 4.8 6.6 Value per share, SEK: Profit/loss after tax 1.51 2.70 –3.47 36.28 0.51 Profit/loss after tax, after dilution 1.51 2.70 –3.47 36.28 0.51 Shareholders’ equity 194.95 203.56 232.62 64.12 28.24 Shareholders’ equity, after dilution 195.55 203.46 232.74 64.12 28.17 Cash flow 29.62 2.85 7.74 16.88 9.38 Cash flow, after dilution 29.56 2.85 7.73 16.88 9.35 Dividend — — — — — Share price on closing date 230.50 378.00 392.00 598.00 330.00 * Operating revenue for 2002, include SEK 237 million, relating to a court case against Telia, which, for reasons of prudence was not previously reported as income. During 2002, Tele2 Norway returned its UMTS license, whereby the net book value of capitalized costs was eliminated in its entirety and was charged against depreciation for the year in an amount of SEK –400 million. EBT for 2002 was affected by a write-down of SEK 86 million, attributable to shares in XSource Corporation, which is under the item ”Interest expense and other financial expenses”. ** Net profit/loss for 2000 was affected by the acquisition of SEC Group on October 2, 2000. ***EBT for 1999 was affected by a non-recurring item of SEK 3,228 million, attributable to a capital gain on the acquisition of the associated company NetCom ASA. 33
  • 36.
    Tele2 Sweden hasmore than 3 million monthly average revenue per user (ARPU) Eastern Europe and Russia mobile telephony customers, reflecting in mobile telephony, including cash cards, Operatng revenue, 2002: SEK 2,320 mil- growth during 2002 when Tele2 expanded amounted to SEK 196 (2001: SEK 204) lion (2001: SEK 1,148 million), +102%. faster than its two primary competitors, in 2002. Meanwhile, the monthly minutes EBITDA, 2002: 541 million (2001: 272), attaining a market share of more than 50% per user and month (MoU) in 2002 +99%. of the total number of new customers. amounted to 103 (2001: 107). Prepaid Eastern Europe and Russia comprises Tele2 Sweden finalized the financing of customers accounted for 72% of the total Tele2’s operations in the Baltic States, Svenska UMTS nät AB – the Swedish customer base in mobile telephony. Fixed (Estonia Latvia and Lithuania) Poland, UMTS network company that is equally telephony and Internet had 1.9 million Czech Republic and Russia as well as and jointly owned with Telia. Tele2 and customers at year-end. XSource operations. Telia announced that a bank credit of SEK Operations in Denmark, Finland and In the Baltic States, Tele2’s services are 11 billion had been signed to finance the Norway are primarily involve fixed teleph- experiencing robust customer growth, expansion of the UMTS network in ony and Internet. Competitive pressure which is primarily driven by mobile tel- Sweden. continues to decline in these countries. ephony and especially prepaid customers. Moreover, costs have fallen as a result of a In Latvia, Tele2 acquired one of two UMTS Nordic 10% reduction in the workforce in licenses in 2002. In January 2003, the Operating revenue, 2002: SEK 13,566 Denmark and 20% in Norway, among other market for fixed telephony in Latvia was million (2001: SEK 11,898 million), factors. opened to competition and Tele2 expects +14%. EBITDA, 2002: SEK 4,814 million During the third quarter, Tele2 signed to launch fixed telephony services there (2001: SEK 3,768 million), +28%. an MVNO agreement for UMTS with during the next six months. Customer The Nordic market area comprises Telenor in Norway in exchange for Telenor intake in the Czech Republic was high and Tele2 operations in Sweden, Norway, Den- gaining access to Tele2’s UMTS network in Tele2 will introduce local pre-selection mark and Finland, as well as Datametrix. Sweden. Tele2’s Norwegian MVNO will be during 2003. Meanwhile, in Poland, Tele2 As of January 1, 2002, Optimal Telecom launched during the first quarter of 2002. will launch fixed telephony during the first is included in the Nordic Market Area. It The advantage for Tele2 is reduced invest- quarter of 2003, following deregulation of was previously included in Branded ment costs of some SEK 5 billion for UMTS international calls on January 1. Products & Services. in Norway. The decision to return the Tele2 has reached agreement with Telia UMTS license in Norway to the Norwegian Central Europe in Sweden, Telenor in Norway and TDC in authorities meant that Tele2 conducted a Operating revenue, 2002: SEK 5,689 mil- Denmark on the terms and conditions for write-down of SEK 399 million during the lion (2001: SEK 4,844) million, +17%. offering ADSL services, and Tele2 will fourth quarter. Margins in Norway and EBITDA, 2002: SEK –81 million (2001: launch these services during the summer. Denmark have improved and in Denmark a SEK –606 million), of which SEK 105 Tele2 Sweden is the largest operation in review of switched traffic fees means that (2001: SEK –585 million) related to fixed the Nordic market area. During 2002, suc- these will be reduced by the equivalent of telephony and Internet. cessful marketing campaigns for both fixed DEK 20 million annually. Denmark is the Central Europe comprises Tele’s opera- and mobile telephony led to larger market last country to start applying the Group’s tions in Germany, Netherlands, Switzer- shares. During 2002, Telia 2 Sweden definition of active customers. This result- land and Austria, as well as a license in retained its high margins, with an EBITDA ed in a one-off reduction in the number of Ireland. margin of 55% for fixed telephony and customer by 461,000 as a result of the Central Europe displayed robust growth 22% for fixed telephony and Internet. data-processing system in Denmark being in revenue and EBITDA during the year, Mobile telephony operations in Sweden upgraded to the same standard as the rest with EBITDA for fixed telephony at a pos- reported 3 million customers, a rise of of the Group. Accordingly, all companies itive level throughout the year. The market 19% on an annual basis. Comviq increased within Tele2 apply the same definition of area’s ARPU was SEK 153 (2001: SEK its share of new sales on the market. The active customer. 148) for 2002. 34 T E L E 2 A N N U A L R E P O R T 2002
  • 37.
    Tele2 is thethird largest alternative expects to launch an MNVO in early 2003. 2002. The improvements were achieved at operator in Germany in fixed telephony and In Switzerland, Tele2 is now the second minimal cost. one of the fastest growing operators nation- largest alternative operator and has signed Tele2 France continued its high growth wide. During 2002, recognition of Tele2 agreements with a large number of cus- and has consolidated its position as the increased dramatically and it is now the tomers for pre-selection by using what is leading alternative operator. Tele2 Italy is third best known brand in the country in referred to as Third Party Verification. the second largest alternative operator, fixed telephony, just behind number two, During 2002, Tele2 broadened its offering and continues to report strong customer Arcor. Tele2 simplified its price structure in Switzerland through the launch of intake and is adding new services, such as and had considerable success with its mar- mobile telephony services in May, Tele2 the recently launched Internet services. In keting, which focuses on comparisons with Voice box in April and Internet ADSL in Spain, Tele2 introduced local pre-selec- competitor prices. During the fourth quarter, November. tion in June, which has increased call traf- operating revenue increased and EBITDA fic considerably. Using Spain as a base, strengthened. However, as a market, Southern Europe Tele2 will launch fixed telephony services Germany has fallen behind the rest of Operating revenue, 2002: SEK 8,105 mil- in Portugal during 2003. Europe, notably in the area of local pre- lion (2001: SEK 5,124 million), +58%. select, which are not deregulated there- EBITDA, 2002: SEK –101 million (2001: Luxembourg by benefiting the former monopoly. SEK –1,331 million). Operating revenue, 2002: SEK 754 mil- Coordinated lobbying at the EU level has Southern Europe comprises Tele2’s lion (2001: SEK 663 million), +14%. had an effect and Germany will start to operations in France, Italy, Spain and EBITDA, 2002: SEK 126 million (2001: deregulate during 2003, thus suggesting Portugal. SEK 5 million). that the Central Europe market area can Southern Europe continued to report The Luxembourg market area compris- expect to gain the same benefits from local sharp growth in operating revenue, which es Tele2 operations in Liechtenstein and pre-selection during the second half of rose 58% in 2002, and a highly significant Luxembourg, the newly launched opera- 2003 as experienced by Southern Europe improvement in EBITDA. The EBITDA- tions in Belgium, 3C’s operations and during 2002. trend was robust during 2002, notably dur- Transac. In the Netherlands, Tele2 is the second ing the fourth quarter, when it reached Tango is the largest mobile operator in largest alternative operator and Tele2 has SEK 156 million, which reflects good Luxembourg. Tele2 has received a UMTS a brand recognition rate of 80% of the popu- results in both Italy and France, and lower license and recently launched MMS ser- lation. Tele2 launched an MVNO during marketing costs in the market area as a vices. TANGO TV, combined with the Tango the first half of 2002, which enjoyed whole. Tele2 has begun to launch services Sunshine radio station, permits access to strong growth during the second half of the in Portugal, which will be launched in their a young target group and also represents year and is now the sixth largest mobile entirety during early 2003. Tele2 attained the first step towards interactivity between operator nationwide. Tele2 attained its tar- a good ARPU of SEK 149 (2001: 129) in media and mobile telephony, which will act get of converting 10% of the customer Southern Europe in 2002. as a driving force for SMS and MMS traf- base in fixed telephony during the first year Tele2 offers a complete product port- fic. Tele2 launched fixed telephony in of operations. These mobile customers folio with local, nationwide and interna- Belgium on January 15, 2003. have been gained at a low cost. tional calls as well as calls for the fixed net- Tele2 Austria is the country’s second work to mobile networks and has recently Branded products & services largest alternative operator and experi- added Internet services. Local pre-selec- Operating revenue, 2002: SEK 848 mil- enced sharp growth during 2002, with a tion has been available for all customers in lion (2001: SEK 1,408 million). brand recognition rate of 85% of the popu- France, Italy and Spain, which has had a EBITDA, 2002: SEK –172 million (2001: lation. The low customer turnover reflects very positive impact on call volumes, oper- SEK –410 million). considerable customer satisfaction. Tele2 ating revenue and customer turnover in 35
  • 38.
    Other trademarks compriseTele UK, an the Board’s work. Matters placed before operation launched in the UK in coopera- the Board are dealt with by the entire tion with The Post Office, C3 operations, Board. In 2002, Tele2’s Board of Directors Everyday operations and IntelliNet opera- held eleven meetings at which minutes tions. were taken. Specific instructions govern- ing the President’s responsibilities and Significant events after the end authority were adopted. Each year, the of the financial year company’s auditors report to the Board the In February 2003 Tele2 Alpha Telecom result of their examination and provide was acquired. This is the UK’s leading their assessment of internal control. operator in prepaid fixed network teleph- ony for individuals and a market leader in Parent Company cash cards for fixed telephony. Tele2 Alpha The Parent Company performs functions Telecom, sells about 1.25 million cash and conducts certain development pro- cards per month from 60,000 sales outlets jects common to the Group. in the UK and has sales of SEK 1.9 billion. A convertible debenture was converted The acquisition will directly contribute to to 100,000 B-shares on December 31, Tele2’s earnings per share in 2003, even 2002, which affected shareholders’ equi- without the expected synergy effects. The ty by SEK 15 million. The Parent Company acquisition price amounted to approxi- gave a shareholder contribution to sub- mately SEK 780 million, on a debt-free sidiaries in the amount of SEK 400 million basis. and received Group contributions totaling The acquisition of Alpha Telecom is a SEK 3,035 million. unique opportunity for Tele2 to attain crit- ical mass in the UK and is line with Tele2’s Proposed appropriation of profit strategy of steadily establishing a presence The Group’s non-restricted reserves in the UK market. Alpha is a stable base amount to SEK 3,590 million. No alloca- on which to further develop Tele2’s opera- tion to restricted reserves is proposed for tions in the UK. The objective is to emu- companies within the Group. late Alpha’s successful product concept in The Board of Directors and President other significant markets in Europe, in propose that the amount at the disposal of which Tele2’s current presence will con- the Annual General Meeting, SEK tribute major revenue and cost synergies. 2,253,624,328, be carried forward to a new account. Work of the Board of Directors It was with great sorrow that the Board of Directors of Tele2 AB announced the death of Board Chairman Jan Hugo Stenbeck at the age of 59. Bruce Grant was appointed Board Chairman on August 22. The work of the Board of Directors fol- lows an annual plan, designed to secure the Board’s need for information and in other respects is affected by the specific work procedure that has been adopted for 36 T E L E 2 A N N U A L R E P O R T 2002
  • 39.
    Income Statement Group Parent Company SEK million Note 2002 2001 2002 2001 Operating revenue 1 31,282 25,085 16 12 Cost of services sold –19,890 –17,715 — — Gross profit 11,392 7,370 16 12 Selling expenses –7,279 –6,652 — — Administrative expenses 39 –2,571 –2,188 –101 –73 Other operating revenues 3 50 189 12 4 Other operating expenses 4 –62 –75 — — Operating profit/loss 2, 38 1,530 –1,356 –73 –57 Profit/loss on associated companies: Result from shares in associated companies 5 –41 –58 — — Sale of associated companies 6 5 91 — — Profit/loss on financial investments: Result from shares in Group companies 7 — –13,964 Result from other securities and receivables classed as fixed assets 8 –84 4 182 64 Other interest revenue and similar income 9 165 65 — 14 Interest expenses and similar costs 10 –779 –690 –5 –15 Profit/loss after financial items 796 –1,944 104 –13,958 Tax on profit for the year 11 –574 2,335 –35 3,076 Minority interest 1 1 Profit/loss for the year 33–34 223 392 69 –10,882 Earnings/loss per share 25 SEK 1.51 SEK 2.70 Earnings/loss per share after full dilution 25 SEK 1.51 SEK 2.70 Number of shares 25 147,460,175 147,360,175 Average number of shares 25 147,360,175 145,003,847 Number of shares after dilution 25 148,223,175 147,560,175 Average number of shares after dilution 25 147,634,293 145,223,466 37
  • 40.
    Balance Sheet Group Parent Company SEK million Note Dec. 31, 2002 Dec. 31, 2001 Dec. 31, 2002 Dec. 31, 2001 ASSETS Fixed assets Intangible assets Licenses and right of use 12 509 736 — — Goodwill 12 24,587 27,033 — — Total intangible assets 25,096 27,769 — — Tangible assets Buildings and land 13 115 124 — — Machinery and other technical plant 13 8,334 8,270 — — Equipment, tools and installations 13 575 687 — — Fixed plant under construction 13 233 350 — — Total tangible assets 9,257 9,431 — — Financial fixed assets Shares in Group companies 14 2,686 1,987 Receivables from Group companies 15 15,353 12,526 Shares in associated companies 16 542 326 — — Receivables from associated companies 17 19 115 19 115 Other long-term holdings of securities 18 139 202 28 5 Other long-term receivables 19 74 85 — — Deferred tax receivable 11 1,246 1,764 1,771 2,656 Total financial fixed assets 2,020 2,492 19,857 17,289 Total fixed assets 36,373 39,692 19,857 17,289 Current asset Materials and supplies 353 362 — — Current receivables Accounts receivable 20 4,373 3,624 — — Current tax receivables 1 6 — — Receivables from Group companies 7 2 Other receivables 21 250 530 — 2 Prepaid expenses and accrued revenues 22 3,049 2,769 1 1 Total current receivables 7,673 6,929 8 5 Cash and bank balances 23 2,473 2,275 10 8 Total current assets 10,499 9,566 18 13 Total assets 33–34 46,872 49,258 19,875 17,302 38 T E L E 2 A N N U A L R E P O R T 2002
  • 41.
    Group Parent Company SEK million Note Dec. 31, 2002 Dec. 31, 2001 Dec. 31, 2002 Dec. 31, 2001 EQUITY AND LIABILITIES Shareholders’ equity 24 Restricted equity Share capital 25 737 737 737 737 Restricted reserves 24,401 35,741 16,562 23,935 Total restricted equity 25,138 36,478 17,299 24,672 Non-restricted reserves/accumulated losses Non-restricted reserves/accumulated losses 3,367 –7,353 2,185 3,495 Profit/loss of the year 223 392 69 –10,882 Total non-restricted reserves/accumulated losses 3,590 –6,961 2,254 –7,387 Total shareholders’ equity 28,728 29,517 19,553 17,285 Minority interest 22 28 Provisions Shares in associated companies 16 28 102 — — Total provisions 28 102 — — Long-term liabilities Interest-bearing Liabilities to financial institutions 26 7,876 10,843 — — Liabilities to Group companies 303 — Bank overdraft facility 23 — 14 — — Other liabilities 27 23 115 — — Total interest-bearing liabilities 7,899 10,972 303 — Non-interest-bearing Other liabilities — 8 — — Total non-interest-bearing liabilities — 8 — — Total long-term liabilities 7,899 10,980 303 — Current liabilities Interest-bearing Liabilities to financial institutions 26 2,377 731 — — Other liabilities 27 5 151 — — Total interest-bearing 2,382 882 — — Non-interest bearing Accounts payable 3,542 3,344 6 10 Current tax liabilities 57 16 — — Other liabilities 28 441 375 5 — Accrued expenses and prepaid revenues 29 3,773 4,014 8 7 Total non-interest bearing liabilities 7,813 7,749 19 17 Total current liabilities 10,195 8,631 19 17 Total shareholders’ equity and liabilities 33–34 46,872 49,258 19,875 17,302 PLEDGED ASSETS AND CONTINGENT LIABILITIES Pledged assets 30 23,678 24,139 None None Contingent liabilities 31 None None 12,825 15,133 39
  • 42.
    Cash Flow Statement Group Parent Company SEK million Note 2002 2001 2002 2001 Operating activities Operating profit/loss 1,530 –1,356 –73 –57 Adjustments ofincome/expense items that do not generate cash flow from operating activities: Depreciation and amortization 3,597 3,054 — — Capital losses/gains on sale of machinery, other technical plant 9 40 — — Financial leases –20 –14 — — Exchange rate differences 63 — — — Interest received 157 54 2 4 Interest paid –619 –569 — –14 Financial expenses paid –104 –55 — –1 Tax paid/refund –49 7 — — 4,564 1,161 –71 –68 Change in working capital: Materials and supplies –12 –66 — — Accounts receivable –815 –837 — — Other current receivables 167 –69 2 –2 Prepaid expenses and accrued revenues –185 –851 — — Intra-Group transactions, current –4 –2 Accounts payable 236 566 –4 3 Other current liabilities 123 112 3 — Accrued expenses and prepaid revenues 287 397 1 –1 –199 –748 –2 –2 Cash flow provided by operating activities 4,365 413 –73 –70 Investing activities Acquisition of intangible fixed assets –208 –17 — — Acquisition of tangible fixed assets –1,699 –2,167 1 — Sale of tangible fixed assets 17 38 — 1 Acquisition of shares in Group companies, exc. Cash 14 –346 831 –299 –36 Acquisition of other long-term securities –317 –334 –23 –75 Sale of other long-term securities 40 236 — — Lending to Group companies –128 –52 Payment received from Group companies 414 313 Other long-term lending –12 –103 –7 –71 Payment received from other long-term lending 9 49 102 — Cash flow from investing activities 32 –2,516 –1,467 60 80 Financing activities Raising of loans from credit institutions 528 12,139 — 1,285 Amortization of loans from credit institutions –1,744 –9,861 — –1,306 Raising of other interest-bearing liabilities 12 342 — 203 Amortization of other interest-bearing liabilities –209 –842 — –206 New share issue 15 15 15 15 Cash flow from financing activities –1,398 1,793 15 –9 Net change in cash 451 739 2 1 Liquid funds at beginning of year 23 2,275 1,511 8 7 Exchange-rate differences in liquid funds 23 –253 25 — — Liquid funds at end of year* 23 2,473 2,275 10 8 *of which, blocked accounts 23 870 897 — — For additional cash flow information, refer to: 32 40 T E L E 2 A N N U A L R E P O R T 2002
  • 43.
    Change in Shareholders’Equity Group Note Share Restricted Unrestricted Total share- SEK million capital reserves reserves hold.’ equity Closing shareholders’ equity, Dec. 31, 2000 724 25,098 717 26,539 Items reported directly against shareholders’ equity Gradual acquisitions — — –12 –12 Exchange-rate difference Note 24 — 1,844 –110 1,734 Total items reported directly against shareholders’ equity — 1,844 –122 1,722 Other changes in shareholders’ equity New share issue, acquisition of Tele2 Russia 12 837 — 849 New share issue 1 14 — 15 Transfers within shareholders’ equity — 7,948 –7,948 — Net profit/loss for the year — — 392 392 Closing shareholders’ equity, Dec. 31, 2001 737 35,741 –6 961 29,517 Closing shareholders’ equity, Dec. 31, 2001 737 35,741 –6,961 29,517 Items reported directly against shareholders’ equity Exchange-rate difference Note 24 — –4,189 3,163 –1,026 Total items reported directly against shareholders’ equity — –4,189 3,163 –1,026 Other changes in shareholders’ equity New share issue — 14 — 14 Utilization of share premium reserve — –7,387 7,387 — Transfers within shareholders’ equity — 222 –222 — Net profit/loss for the year — — 223 223 Closing shareholders’ equity, Dec. 31, 2002 737 24,401 3,590 28,728 Parent Company Restricted shareholders’ equity Unrestricted equity Total Share capital Share premium Profit/loss sharehold. equity SEK million reserve brought forward Closing shareholders’ equity, Dec. 31, 2000 724 23,083 1,983 25,790 Items reported directly against shareholders’ equity Group contribution, received — — 2,100 2,100 Group contribution, tax effect — — –588 –588 Rounding off — 1 — 1 Total items reported directly against shareholders’ equity — 1 1,512 1,513 Other changes in shareholders’ equity New share issue, acquisition of Tele2 Russia 12 837 — 849 New share issue 1 14 — 15 Net profit/loss for the year — — –10,882 –10,882 Closing shareholders’ equity, Dec. 31, 2001 737 23,935 –7,387 17,285 Closing shareholders’ equity, Dec. 31, 2001 737 23,935 –7,387 17,285 Items reported directly against shareholders’ equity Group contribution, received — — 3,035 3,035 Group contribution, tax effect — — –850 –850 Total items reported directly against shareholders’ equity — — 2,185 2,185 Other changes in shareholders’ equity New share issue — 14 — 14 Utilization of share premium reserve — –7,387 7,387 — Profit/loss for the year — — 69 69 Closing shareholders’ equity, Dec. 31, 2002 737 16,562 2,254 19,553 41
  • 44.
    Notes (SEK million) Generalaccounting principles The annual report has been prepared in accordance with the Annual Tele2’s management conducts continual appraisals to confirm Accounts Act and recommendations of the Swedish Financial these assumptions remain reasonable. Accounting Standards Council’s Emerging Issues Task Forece and • Tele2’s management continually makes assessments of the sus- the Swedish Financial Accounting Standards Council’s recommen- tained value of intangible and tangible fixed assets. If manage- dations RR1: 00-RR28, of which RR2:02, RR22 and RR24-RR28 ment identifies factors that entail a risk of reduced value of the were applied before they came into force. particular asset, a revaluation of the asset is conducted by com- In 2002, Tele2 modified its accounting principles to conform to paring the sum of the future discounted cash flow with the recommendations RR2:02-Materials and Supplies, RR22-Layout asset’s book value. In cases in which the book value exceeds the of Financial Reports, RR23-Information on Related Parties, RR24- future discounted cash flow, a write-down requirement emerges. Managed Properties, RR25-Reporting for segments -operating The appraisal that concludes that there are factors indicating areas and geographical areas, RR26- Events after the Closing Date, that an asset is exposed to a decline in value; the assessment RR27-Financial Instruments: Information and Classification, and of future cash flow, including discounting factors; and the final RR28-State support. decision regarding the real value of the asset, entail a require- The new recommendations have no significant impact on Tele2’s ment for management to conduct essential estimates and financial reporting. Effective 2003, Tele2 has begun to apply RR29 approximations. (Note 12–13). Employee Benefits, which means that defined-benefit pension • The calculation of deferred taxes takes into consideration tem- plans for all the Group’s subsidiaries are to be reported on the basis porary differences, including a valuation of unutilized loss carry- of uniform principles. To date, Tele2 has reported such plans in line forwards. Deferred tax receivables are reported only for loss with local rules and stipulations in each country. Since the com- carry-forwards to the extent that the loss-carry forwards will be pany has largely had defined-contribution plans (Note 38), the utilized in the near future. A prudent valuation has been made introduction of RR29 is not expected to have any material impact of deferred tax receivables and the company’s management con- on the Group’s earnings and financial position. ducts continual appraisals to confirm that these assessments Assets and liabilities in subsidiaries are valued on the basis of are reasonable. (Note 11). the accounting principles applied by the Parent Company. • Receivables are valued continually and reported in the amounts expect to be paid. Reserves for doubtful receivables are based Critical accounting principles on various assumptions and historical experience (Note 20). Assets and liabilities are valued at their acquisition value unless otherwise stated. Consolidated accounts The consolidated financial reports are, in part, based on account- The consolidated financial statements include the accounts of the ing methods, assumptions and estimates in conjunction with the Parent Company and all companies in which the Parent Company, drawing up of the consolidated accounts. The estimates and approxi- directly or indirectly, controls more than 50% of the votes, or in mations are based on historical experience and a number of other some other respect has a decisive influence. assumptions, which result in a decision regarding the value of the The consolidated accounts were prepared using the purchase assets or liabilities that cannot be set in any other way. The actual method, which means that the Parent Company’s purchase cost of outcome may deviate from these estimates and approximations. shares in each subsidiary is charged against that subsidiary’s acqui- The account below presents the accounting principles applied sition value, that is, the subsidiary’s shareholders’ equity (includ- to the most critical estimates and approximations used in drawing ing the equity component of untaxed reserves) at the time of acqui- up the Group’s financial reports. sition based on a market appraisal of the subsidiary’s net assets. • Depreciation according to plan is based on the acquisition value Consequently, the Group’s shareholders’ equity includes only that and estimated utilization period of fixed assets. The utilization part of each subsidiary’s equity that has been earned after the period for machinery and technical plant is estimated to amount acquisition. to between 2–25 years. All depreciation is straight-line over the The difference between the purchase cost of shares in a sub- utilization period (Note 2). sidiary and the market value of that subsidiary’s net assets at the Amortization periods for goodwill are set on the basis of each time of acquisition is allocated to the subsidiary’s identifiable acquisition date and the acquisition’s estimated long-term, assets if the book value is less than the market value. Remaining strategic significance. An amortization period of 20 years amounts are reported as goodwill. applies for each corporate acquisitions in new markets. This The current method is used to translate the accounts of foreign means that goodwill arising from all strategic acquisitions in subsidiaries. Consequently, the exchange rate on the closing date recent years (meaning acquisitions in the Baltic States, contin- is used to translate items in the balance sheet, while items in the ental Europe and Russia) is written off over a period of 20 years. income statement are translated using the average exchange rate for the year. 42 T E L E 2 A N N U A L R E P O R T 2002
  • 45.
    All non-Swedish companiesin the Tele2 Group are regarded as Receivables and liabilities of Swedish and non-Swedish sub- independent foreign operations since they conduct independent sidiaries denominated in foreign currencies operations and operations that are pursued with transactions in Receivables and liabilities of Group companies denominated in for- local currency, so that exchange rate differences arising from trans- eign currencies have been translated into Swedish kronor applying lations are charged directly to shareholders’ equity. the year-end rate. When an independent foreign operation is divested, the accu- Gains or losses on foreign exchange in international transactions mulated exchange-rate differences attributable to the divested related to regular operations are included in the income statement operation are reported in “Net assets in Group companies divest- under “Other operating revenues” and “Other operating expenses”, ed” in the income statement. respectively, while differences in financial receivables and liabil- ities are reported among financial items. Note 24 summarizes the Accounting for associated companies and joint ventures exchange rate differences charged directly to shareholders’ equity Companies in which the shareholding is regarded as long term and and the differences that affected profit/loss for the year. in which the Group’s voting rights amount to a minimum of 20% Long-term lending to/borrowing from Tele2’s foreign operations and a maximum of 50%, or in which the management believes that is regarded as a permanent part of the Parent Company’s financing the shareholders have equal control, are treated as associated com- of/borrowing from foreign operations, and thus as an expansion/ panies. Companies in which the owners have major control pursuant reduction of the Parent Company’s investment in the independent to agreement are regarded as joint ventures. foreign operation. This lending/ borrowing is translated at the his- Associated companies and joint ventures (“associated com- torical rate of exchange if the borrowing is denominated in the for- panies”) are reported in accordance with the equity method. This eign company’s currency. means that the book value of the shares in the associated company that is reported in the consolidated financial statements corre- Fixed assets sponds to the Group’s share in the equity of the associated com- Intangible and tangible fixed assets are reported in net form after pany and any residual value of consolidated surplus values after deductions for accumulated amortization and depreciation accord- adjustment to the consolidated accounting principles. Participation ing to plan. Depreciation/amortization according to plan is based in earnings after net financial items of the associated company are on the acquisition value of the assets and the estimated utilization reported in the income statement in the item “Result from shares period. Note 2 presents depreciation and amortization schedules in associated companies” along with amortization of acquired sur- for fixed assets and reasons for amortizing certain intangible fixed plus values. The share of associated companies’ tax expense and assets over utilization period longer than five years. deferred tax expense/income is reported in the income statement If there is an indication that a tangible or intangible asset has in the item “Tax on profit for the year” and in the balance sheet as declined in value, an estimate is made of its recovery value. If the “Shares in associated companies”. Earnings accrued in associated calculated recovery value is less than the reported value, a write- companies arising after the acquisition date, and which have not down is made to the asset’s recovery value. yet materialized through dividends, are allocated to the equity method reserve, which comprises part of restricted shareholders’ Intangible assets equity in the Group. The equity share reduces unrestricted share- License fees and right of use holders’ equity in the event of losses. The Company holds a number of licenses issued by the Swedish In the event of an increase or decrease in the Group’s equity National Post and Telecom Agency and the equivalent licensing share in associated companies through share issues, the loss or gain authority in other countries. Capitalized expenses for these rights is reported in the consolidated income statement in the item are amortized over the duration of the contract. “Result from participations in associated companies”. If the non- recurring effect is significant, the amount is reported in the item Goodwill “Items affecting comparability”. Goodwill is defined as the difference between the purchase cost of In the event of negative shareholders’ equity in associated com- shares or assets acquired and the market value of net assets. panies and in which the company has pledged to contribute add- itional capital, the negative portion is reported as a provision. Tangible assets Group surplus values relating to foreign associated companies Buildings and land are reported as assets in foreign currencies. These values are trans- Buildings and land pertain to fixed assets intended for use in actual lated in accordance with the same principles as the income state- operations. Buildings are written off straight-line over the utilization ments and balance sheets for associated companies. period. Acquisition value includes direct costs attributable to the building. Minority interest The minority share in net profit/loss and shareholders’ equity is reported as minority interest. 43
  • 46.
    Machinery and technicalplant Liquid funds Machinery and technical plant include equipment and machinery Liquid funds consist of cash and bank balances as well as current intended for use in operations, such as network installations. The investments with a maturity of a maximum three months. Liquid asset is written off on a straight-line basis over the utilization funds according to the cash flow statement and balance sheet period. The acquisition value includes direct expenses attributable include blocked bank accounts. to the construction and installation of networks. Interest directly relating to acquisition, construction or production of an asset that Financial items necessarily requires considerable time to complete for the intended Financial items are reported originally at their acquisition value. application is included in the acquisition value of the asset. Current financial assets are subsequently reported in line with the Additional expenses for extensions and improvements that lower of cost and market value. Financial items such as cash and increase value are capitalized, while additional expenses for repairs bank balances, current investments, receivables and liabilities, pre- and maintenance are charged continually to income during the period paid income and current liabilities to financial institutions are in which they arise. viewed as corresponding to their real value as they are of a short- term nature. The book value of long-term liabilities to financial insti- Equipment, tools and installations tutions is also regarded as corresponding to their real value. Equipment comprises assets used in administration, sales and operations. Shareholders’ equity Shareholders’ equity consists of registered share capital, reserves Proprietary software for internal use that are not available for distribution (statutory reserve, share pre- Tele2 capitalizes certain direct development costs attributable to mium reserve and other restricted reserves) and disposable earn- software for internal use. These are written off over the period of ings/accumulated losses, net profit/loss and shares in losses of use, which commences when the asset is ready for application. associated companies. Costs attributable to the project phase in the planning stage as well The share premium reserve pertains to surplus portions when a as costs for maintenance and training are expensed as they arise. company’s shares are issued at a price that exceeds the normal value. The equity reserve pertains to positive earnings of associat- Leasing ed companies received after the acquisition date. According to the Leases are classified as either financial or operating leases. A lease Swedish Companies Act, a provision must be made each year to the is considered financial if all economic risks and benefits associated statutory reserve in a minimum amount corresponding to 10% of with ownership of the asset have been transferred, to a material that portion of net profit for the year that is not used to cover degree, to the lessee; otherwise, the lease is an operating lease. In retained losses until the statutory reserve and the share premium the case of financial leases as reported in the consolidated finan- reserve, combined, correspond to 20% of the share capital. cial statements, each asset is entered as a tangible fixed asset, and Restricted reserves in Tele2 and the Swedish Group companies may a corresponding amount is entered as a loan on the liability side of be used to increase share capital in order to cover accumulated the balance sheet. In the income statement, the cost of the lease losses, under certain conditions. Other restricted reserves pertain is divided into a depreciation portion and an item in interest to the equity share of untaxed reserves, deferred tax receivables and expense. The asset is written off on a straight-line basis over the a portion of exchange-rate differences. utilization period. According to the Swedish Companies Act, Tele2’s disposable Agreements covering financial leases before January 1, 1997 have earnings after the requisite provision to the statutory reserve and been reported as operational leases in line with a transitional rule. after covering accumulated losses of previous years are available for distribution to shareholders. The legal limit for distributable Materials and supplies funds is represented by rules to the effect that dividends may not Inventories of materials and supplies are valued in line with the threaten the company’s liquidity or overall position or exceed unre- first-in, first-out principle at the lower of purchase cost and market stricted shareholders’ equity in the Group. The dividend is deter- value. mined by shareholders at the Annual General Meeting and, gener- ally, may not exceed the dividend proposed by the Board. Receivables Receivables are reported in the amounts expected to be paid. 44 T E L E 2 A N N U A L R E P O R T 2002
  • 47.
    Revenue recognition Transactions with related parties Sales are reported net of VAT, discounts and exchange rate differ- Transactions with related parties are shown in Note 35. ences for sales in foreign currency. Revenue from telephony, cable TV and other services and products is recognized at the time the US accounting principles (US GAAP) service/product is supplied to the customer. The Group’s balance sheet and income statement were drawn up in accordance with Swedish accounting principles. These diverge Marketing expenses to a certain extent from US accounting principles (US GAAP). Note Expenditure for advertising and other marketing activities is 40 shows the adjustments necessary to report in accordance with charged on an ongoing basis. US-GAAP. Corporate income tax Other information Consolidated profit or loss for the year is charged with the tax on Tele2 AB is a limited liability company domiciled in Stockholm, taxable income for the year (“Current tax”) and with estimated tax Sweden. The company’s head office (phone +46 8 5620 0060) is charges or credits for temporary differences (“Deferred tax”). A tem- located at Skeppsbron 18, Box 2094, 103 13 Stockholm, Sweden. porary difference is a provision to appropriations made by an indi- The balance sheets and income statements will be approved at vidual company or any other item that merely alters the time when the Annual General Meeting on May 15, 2003. an item is considered taxable or entitling the company to a deduction. The calculation of deferred tax receivables in the Group takes into account the Group’s loss carry-forwards to the extent that it is expected they can be used in the foreseeable future. Deferred tax receivables and deferred tax liabilities are netted only among units with the same domicile for tax purposes. The tax effects of Group contributions paid and received are reported in the individual companies as a tax expense or tax rev- enue in the income statement (“Current tax”) and charged to retained losses or earnings. Earnings per share Earnings per share after dilution is calculated according to a method in which the present value of the exercise price of the option is assumed to be used to acquire shares at the average market value during the accounting period. If the result for the year is negative, this does not affect the calculation, since the dilution may not reduce the loss per share. Note 1 Operating revenue Intra-group sales include sales to companies in the Tele2 Group. Intra-Group sales in each market area and additional information concerning the segments are shown in Note 33, Market areas and Note 34, Operating areas. Sales of telephones are included in operating revenue in the amount of SEK 453 million (2001: SEK 306 million). The number of customers per market area and business area is shown in Note 36. Optimal Telecom, which was previously reported in the Branded products & services market area, is included in the concept “Tele2 Sweden” as of January 1, 2002 and in the Nordic market area. Operating revenue for Optimal Telecom amounted to SEK 450 million in 2001. During the first quarter of 2002, Tele2 won a case in the County Administrative Court against Telia regar-ding the principles of payment for joint traffic charges, which means that Telia is responsible for paying SEK 350 million for switched traffic transited via its network (Cascade Accounting). As a result, operating revenue was positively affected in the amount of SEK 237 million in 2002 for traffic attributable to earlier periods. The entire operating revenue of the Parent Company pertains to sales to other Group companies. 45
  • 48.
    Cont. note 1 Operatingarea by market area: Group Operating revenue 2002 2001 Change Nordic: Mobile telephony 7,109 6,029 18% Fixed telephony and Internet 6,637 5,886 13% Cable-TV 270 171 58% Data processing 214 280 –24% Intra-Group sales –664 –468 42% Total, Nordic 13,566 11,898 14% of which, Tele 2 in Sweden; Mobile telephony 6,611 5,720 16% of which, Tele 2 in Sweden: Fixed telephony 3,877 3,183 22% of which, Tele 2 in Sweden: Cable TV 253 157 61% of which, Tele 2 in Sweden; Total 10,741 9,060 19% Eastern Europe and Russia: Mobile telephony 2,068 1,094 89% Fixed telephony and Internet 198 34 482% Cable-TV 26 — — Data processing 77 53 45% Intra-Group sales –49 –33 48% Total, Eastern Europe and Russia 2,320 1,148 102% Central Europe: Mobile telephony 145 25 480% Fixed telephony and Internet 5,922 5,339 11% Intra-Group sales –378 –520 –27% Total, Central Europe 5,689 4,844 17% Southern Europe: Fixed telephony and Internet 8,415 5,591 51% Intra-Group sales –310 –467 –34% Total, Southern Europe 8,105 5,124 58% Luxembourg: Mobile telephony 535 471 14% Fixed telephony and Internet 209 211 –1% Cable-TV 2 — — Data processing 124 104 19% Intra-Group sales –116 –123 –6% Total, Luxembourg 754 663 14% Branded products & services: Mobile telephony — 17 — Fixed telephony and Internet 1,004 1,559 –36% Intra-Group sales –156 –168 –7% Total, Branded products & services: 848 1,408 –40% Total by market 31,282 25,085 25% Group Operating revenue 2002 2001 Change Mobile telephony 9,857 7,636 29% Fixed telephony and Internet 22,385 18,620 20% Cable TV 298 171 74% Data processing 415 437 –5% Intra-Group sales –1,673 –1,779 –6% Total by operating area 31,282 25,085 25% 46 T E L E 2 A N N U A L R E P O R T 2002
  • 49.
    Note 2 Depreciation/amortization for the year and operating profit Operating area by market: Group EBITDA* Depreciation/amortizat. EBIT** 2002 2001 2002 2001 2002 2001 Nordic: Mobile telephony 3,576 2,917 –791 –354 2,785 2,563 Fixed telephony and Internet 1,187 847 –466 –484 721 363 Cable-TV 41 –11 –73 –72 –32 –83 Data processing 10 15 –5 –3 5 12 Total, Nordic 4,814 3,768 –1,335 –913 3,479 2,855 of which, Tele 2 in Sweden, Mobile telephony 3,646 3,111 –388 –352 3,258 2,759 of which, Tele 2 in Sweden, Fixed telephony 870 675 –347 –351 523 324 of which, Tele 2 in Sweden, Cable TV 41 –13 –70 –70 –29 –83 of which, Tele 2 in Sweden, Total 4,557 3,773 –805 –773 3,752 3,000 Eastern Europe and Russia: Mobile telephony 611 320 –339 –244 272 76 Fixed telephony and Internet –76 –56 –29 –23 –105 –79 Cable-TV –1 — –12 — –13 — Data processing 7 8 –10 –11 –3 –3 Total, Eastern Europe and Russia 541 272 –390 –278 151 –6 Central Europe: Mobile telephony –186 –21 –17 –3 –203 –24 Fixed telephony and Internet 105 –585 –116 –98 –11 –683 Total, Central Europe –81 –606 –133 –101 –214 –707 Southern Europe: Fixed telephony and Internet –101 –1,331 –129 –96 –230 –1,427 Total, Southern Europe –101 –1,331 –129 –96 –230 –1,427 Luxembourg: Mobile telephony 161 101 –65 –65 96 36 Fixed telephony and Internet 6 –61 –18 –48 –12 –109 Cable-TV –29 — –5 — –34 — Data processing –12 –35 –4 –5 –16 –40 Total, Luxembourg 126 5 –92 –118 34 –113 Branded products & services: Mobile telephony — –22 — — — –22 Fixed telephony and Internet –172 –388 –12 –36 –184 –424 Total, Branded products & sevices –172 –410 –12 –36 –184 –446 Group depreciation/amortization –1,506 –1,512 –1,506 –1,512 Total by market 5,127 1,698 –3,597 –3,054 1,530 –1,356 Group EBITDA* Depreciation/amortizat. EBIT** 2002 2001 2002 2001 2002 2001 Mobile telephony 4,162 3,295 –1,212 –666 2,950 2,629 Fixed telephony and Internet 949 –1,574 –770 –785 179 –2,359 Cable-TV 11 –11 –90 –72 –79 –83 Data processing 5 –12 –19 –19 –14 –31 Group depreciation/amortization –1,506 –1,512 –1,506 –1,512 Total per operating area 5,127 1,698 –3,597 –3,054 1,530 –1,356 * EBITDA = Operating profit before depreciation/amortization ** EBIT = Operating profit after depreciation/amortization 47
  • 50.
    Cont. note 2 Group EBITDA-margin EBIT-margin 2002 2001 2002 2001 Nordic 35% 32% 26% 24% of which, Tele 2 in Sweden, Mobile telephony 55% 54% 49% 48% of which, Tele 2 in Sweden, Fixed telephony 22% 21% 13% 10% of which, Tele 2 in Sweden, Cable-TV 16% –8% –11% –53% of which, Tele 2 in Sweden, Total 42% 42% 35% 33% Eastern Europe & Russia 23% 24% 7% –1% Central Europe –1% –13% –4% –15% Southern Europe –1% –26% –3% –28% Luxembourg 17% 1% 5% –17% Branded products & services –20% –29% –22% –32% Total per operating area 16% 7% 5% –5% The profit gauges above do not include internal sales to other companies in the Tele2 Group. Profit/loss including internal sales, depreciation by seg- ment (with the exception of goodwill for the acquisition of SEC) and additional information on segments is shown in Note 33, Market areas and Note 34, Operating areas. Sales of telephones are included in operating expenses for the year in the amount of SEK –573 million (2001: SEK –543 million). Optimal Telecom, which was previously reported in the Branded products * market area is included in the Nordic market area as of January, 2002. Operating profit/loss before and after depreciation/ amortization for Optimal Telecom in 2001 amounted to SEK –20 million and SEK –43 million, respectively. By function: Depreciation/Amortization Group Parent Company 2002 2001 2002 2001 Cost of services sold –3,264 –2,782 — — Selling expenses –83 –75 — — Administration expenses –250 –197 — — Total depreciation/amortization for the year by function –3,597 –3,054 — — By type of asset: Depreciation/Amortization Group Parent Company 2002 2001 2002 2001 Licences and right of use –339 –46 — — Goodwill –1,512 –1,506 — — Buildings –19 –19 — — Machinery and other technical plant –1,350 –1,276 — — Equipment, tools and installations –240 –207 — — Plant under construction –137 — — — Total depreciation/amortization for the year by type of asset –3,597 –3,054 — — Group Parent Company Estimated utilization period: Intangible fixed assets: Licences and right of use 2–25 years — Goodwill 3–20 years — Tangible fixed assets: Buildings 5–40 years — Machinery and other technical plant 2–25 years — Equipment, tools and installations 2–10 years — Depreciation/amortization according to plan is based on the acquisition value of each fixed asset and its estimated utilization period. All deprecia- tion/amortization is applied on a straight-line basis over the utilization period. Goodwill arising from the original acquisition of Comviq GSM AB and Tele2 Sverige AB and other acquisitions before 1996 are amortized over ten years. The goodwill arising in 1996 in conjunction with the acquisition of outstanding minority shareholding in Tele2 Sverige AB and outstanding options in Comviq GSM AB, is amortized over 20 years. Goodwill arising from the acquisition of Datametrix, Ritabell, SIA Tele2, SEC, Fora and Levicom Broadband is amortized over a period of 20 years. The amortization periods are set on the basis of the estimated long-term and strategic significance of each acquisition on the acquisition date. In the case of corporate acquisitions in new markets, an amortization period of 20 years is applied. Other goodwill is amortized over five years. 48 T E L E 2 A N N U A L R E P O R T 2002
  • 51.
    Note 3 Other operating revenue Group Parent Company 2002 2001 2002 2001 Rental of capacity and antenna installations — 64 — — Exchange gains in business operations 24 33 1 — Divestment of fixed assets 9 2 — — Other revenue, external 17 90 — — Other revenue, Group — — 11 4 Total other operating revenue 50 189 12 4 Note 4 Other operating expenses Group Parent company 2002 2001 2002 2001 Exchange loss from operations –35 –20 — — Sale/scrapping of other fixed assets –18 –46 — — Other costs –9 –9 — — Total other operating expenses –62 –75 — — Note 5 Profit/loss on shares in associated companies Group Parent company 2002 2001 2002 2001 Participation in profit/loss of associated companies –41 –58 — — Total profit/loss in associated companies –41 –58 — — Holding Group Parent Company Dec. 31, 2002 Dec. 31, 2001 2002 2001 2002 2001 Svenska UMTS-nät AB 50% 50% –1 –1 — — Other associated companies Note 16 Not 16 –40 –57 — — Total net profit/loss from associated companies –41 –58 — — Profit/loss in associated companies: 2002 2001 Sv UMTS-nät Other Sv UMTS-nät Other (9 mth) Profit/loss in each associated company –2 –108 –2 –113 Holding 50% 20–50% 50% 20–50% Share of profit/loss –1 –39 –1 –57 Change in share of profit/loss from preceding year — –1 — — Total net profit/loss from associated companies –1 –40 –1 –57 In the fourth quarter of 2002, Tele2 sold its 20% shareholding in Moscow Cellular Communication, an associated company in Tele2 Russia Telecom BV Group (formerly Fora BV), which was acquired in 2001. Extracts from the balance sheets and income statements of each associated company: 2002 2001 Sv UMTS-nät Other Sv UMTS-nät Other (9 mån) Income statement: Revenue — 70 — 13 Operating profit/loss after depreciation/amortization –20 –86 –11 –103 Profit/loss for the year –2 –108 –2 –113 49
  • 52.
    Cont. note 5 Dec. 31, 2002 Dec. 31, 2001 Sv UMTS-nät Other Sv UMTS-nät Other Balance sheet: Tangible assets 468 — 12 432 Intangible and financial assets — 33 — 107 Current assets 545 80 492 141 Total assets 1,013 113 504 680 Shareholders’ equity 995 –8 498 130 Long-term liabilities — 37 — 349 Current liabilities 18 84 6 201 Total shareholders’ equity and liabilities 1,013 113 504 680 Note 6 Sales of associated companies Group Parent Company 2002 2001 2002 2001 Sale of Moscow Cellular Communication 5 — — — Sale of Transcom Worldwide S.A — 91 — — Total sales of associated companies 5 91 — — Note 7 Profit/loss on shares in Group companies Parent Company 2002 2001 Liquidation loss in Société Europénne de Communication S.A. — –13,964 Total profit/loss from shares in Group companies — –13,964 Note 8 Profit/loss on other securities and receivables constituting fixed assets Group Parent Company 2002 2001 2002 2001 Interest, Group 180 61 Interest, external receivables 2 5 2 3 Writedown of shares in XSource Corporation –86 — — — Exchange rate difference — –1 — — Total profit/loss on other securities and receivables constituting fixed assets –84 4 182 64 Note 9 Other interest income Group Parent Company 2002 2001 2002 2001 Interest, Group — 14 Interest, bank balances, etc. 111 66 — — Interest, penalty interest etc. 47 — — — Exchange rate difference on financial fixed assets 7 –1 — — Total other interest income 165 65 — 14 Note 10 Interest expense and similar profit/loss items Group Parent Company 2002 2001 2002 2001 Interest, loans –679 –557 — –14 Interest, financial leasing –13 –11 — — Interest, penalty interest rate and other liabilities –30 –53 — — Interest, Group –5 — Exchange rate difference on financial liabilities 57 2 — — Other financial expense –114 –71 — –1 Total interest expense and similar profit/loss items –779 –690 –5 –15 50 T E L E 2 A N N U A L R E P O R T 2002
  • 53.
    Note 11 Tax on profit/loss for the year and deferred tax liability/receivable Tax on profit/loss for the year Group Parent Company 2002 2001 2002 2001 Current tax expense: Eastern Europe and Russia –45 –2 — — Central Europa –4 — — — Southern Europe — –1 — — Luxembourg — 4 — — –49 1 — — Deferred tax expense, as a result of temporary differences: Nordic –835 2,334 –35 3,076 Eastern Europe and Russia 22 — — — Central Europa 116 — — — Southern Europe 127 — — — Luxembourg 30 — — — Branded products & services 15 — — — –525 2,334 –35 3,076 Total tax expense (–)/tax income (+) on profit for the year –574 2,335 –35 3,076 Group Profit before tax and and minority share, geographic breakdown 2002 2001 Sweden 2,532 2,072 Other countries –1,736 –4,016 Total profit/loss and minority share 796 –1,944 The difference between the booked tax expense for the Group and the tax expense based on prevailing tax rates in each country consists of the following components: Group Calculation of effective tax rate 2002 2001 Profit/loss before tax and minority share 796 –1 944 Tax according to prevailing tax rate in: Tax effect according to tax rates in Sweden –223 28,0% 544 28,0% Difference between tax rate in Sweden for foreign subsidiaries 135 326 –88 870 Tax effect of: Non-tax affecting items, Group adjustments –418 52.5% –422 –21.7% Non-tax affecting items, other adjustments 18 –2.3% 40 2.1% Liquidation of SEC and taxation of deferral — — 3 082 158.5% Non-deductible expenses etc –81 10.2% –35 –1.8% Loss carry-forwards: – Valuation of loss carry-forwards in previous years 576 –72.4% — — – Non-assessed additional loss carry-forward for the year –581 73.0% –1 200 –61.7% Tax expense/income and effective tax rate –574 72.1% 2 335 120.1% Group Deferred tax receivable, attributable to Dec. 31, 2002 Dec. 31, 2001 Long-term receivables –3 –5 Machinery and technical plant –1,019 –928 Value of unutilized loss carry-forwards 2,268 2,697 Total deferred tax receivable (+)/tax liability (–) 1,246 1,764 51
  • 54.
    Cont. note 11 Group Deferred tax receivable Dec. 31, 2002 Dec. 31, 2001 Deferred tax receivable: Nordic 1,937 2,697 Eastern Europe and Russia 35 — Central Europa 117 — Southern Europe 128 — Luxembourg 36 — Branded products & services 15 — 2,268 2,697 Deferred tax liability: Nordic –1,022 –933 Total deferred tax receivable (+)/tax liability (–) 1,246 1,764 Loss carry-forwards: At December 31, 2002, the Tele2 Group had loss carry-forwards totaling SEK 19,173 million (2001: SEK 19,871million), of which SEK 1,744 mil- lion (2001: SEK 3,300 million) expires within five years and the remaining amount, SEK 17,429 million (2001: SEK 16,571 million), expires after five years or they continue to apply in perpetuity. A deferred tax receivable in the case of loss carry-forwards is reported only to the extent that it is estimated that they can be utilized in the near future. Due to the improved results in Continental Europe deferred tax receivables of a total amount of SEK 576 million has been recognized in the profit and loss statement in 2002. Total losses carried forward for the Group at December 31 2002 amounted to SEK 19,173 million, of which SEK 7,881 million has been utilized for deferred tax accounting and the remaining part, SEK 11,292 million, is valued to zero. The Swedish tax authorities have queried a loss carry-forward in Tele2 AB corresponding to a tax effect of SEK 176 million (2001: SEK 176 mil- lion). These have been valued to SEK 169 million. Note 12 Intangible assets Dec. 31, 2002 Group Parent Company Licences & Goodwill Total Licenses & right of use right of use Acquisition value: Acquisition value at Jan. 1 996 29,755 30,751 1 Acquisition value in acquired companies 1 — 1 — Investments for the year 147 460 607 — Sales and scrapping –272 –9 –281 — Reclassification –13 –498 –511 — Translation differences for the year –37 –962 –999 — Total acqusition value 822 28,746 29,568 1 Accumulated depreciation/amortization: Accumulated depreciation/amortization at Jan 1 –260 –2,722 –2,982 –1 Accumulated depreciation/amortization in acquired companies — — — — Depreciation/amortization for the year –339 –1,512 –1,851 — Sales and scrapping 271 9 280 — Reclassification 2 — 2 — Translation differences for the year 13 66 79 — Total accumulated depreciation/amortization –313 –4,159 –4,472 –1 Total intangible assets 509 24,587 25,096 — Investments for the year in goodwill relate essentially to the supplementary purchase price paid for Tele2 Russia (SEK 407 million). Sales and scrapping relate essentially to the phase-out of Tele2 Norway’s UMTS license, in which the net book value of capitalized license costs was dissolved in its entirety and charged to depreciation in the amount of SEK –263 million. When Tele2 acquired Société Europénne de Communication SA, through an offer to SEC’s shareholders, there were outstanding stock options in SEC. Tele2’s offer did no encompass the stock options, thus in order to calculate net assets, these have been given a theoretical value as if they had been encompassed by the offer and booked as a liability in the consolidated balance sheet. During 2002, this liability was adjusted vis-à-vis good- will, shown above as a reclassification, in the amount of SEK 498 million, with no effect on cash and profit. 52 T E L E 2 A N N U A L R E P O R T 2002
  • 55.
    Note 13 Tangible assets Dec. 31, 2002 Group Parent Company Buildings Machinery, Equipment Plant under Total Inventarier & land tech. plant construction Acquisition value: Acquisition value at Jan. 1 177 14,069 1,320 350 15,916 1 Acquisition value in acquired companies 1 14 13 — 28 — Investments for the year 18 1,244 203 300 1,765 — Sales and scrapping –1 –146 –54 –147 –348 — Reclassification — 331 –55 –263 13 — Translation differences for the year –13 –268 –49 –7 –337 — Total acqusition value 182 15,244 1,378 233 17,037 1 Accumulated depreciation: Accumulated depreciation at Jan. 1 –53 –5,799 –633 — –6,485 –1 Accumulated depreciation in acquired companies — –9 –11 — –20 — Depreciation for the year –19 –1,350 –240 –137 –1,746 — Sales and scrapping — 130 44 144 318 — Reclassification — –11 9 — –2 — Translation differences for the year 5 129 28 –7 155 — Total accumulated depreciation –67 –6,910 –803 — –7,780 –1 Total tangible assets 115 8,334 575 233 9,257 — Sales and scrapping relate essentially to the phase-out of Tele2 Norway’s UMTS license, in which the net book value of capitalized license costs was dissolved in its entirety and charged to depreciation for the year in the amount of SEK –137 million. Group Parent Company Dec. 31, 2002 Dec. 31, 2001 Dec. 31, 2002 Dec. 31, 2001 Total capitalized interest expenses in fixed assets 205 193 — — Financial leases: All fixed assets utilized through financial leasing have been included in the consolidated accounts as fixed assets and loan liabilities, with the exception, however, of contracts signed before 1997. The effects of these being included in the consolidated balance sheet are shown below and in Note 26. Group Booked assets Assets not booked Dec. 31, 2002 Dec. 31, 2001 Dec. 31, 2002 Dec. 31, 2001 Machinery and other technical plant: Acquisition value 298 306 155 155 Accumulated depreciation –57 –87 –49 –42 Book value 241 219 106 113 Financial leasing pertains primarily to the extension for transmission capacity in Sweden through Svenska Kraftnät, Vattenfall and agreements signed in Denmark. Also, financial leasing occurs in Estonia, Russia and Luxembourg. During 2002, investments amounted to SEK 83 million, primarily in Sweden in the amount of SEK 66 million and in Luxembourg in the amount of SEK 11 million. During the year, termination of financial leasing occurred in Estonia and Latvia. Tax-assessed value: The tax-assessed value of the Group’s land in Sweden is SEK 1 million (2001: SEK 1 million). 53
  • 56.
    Note 14 Shares in Group companies Parent Company Dec. 31, 2002 Dec. 31, 2001 Acquisition value: Acquisition value at Jan. 1 1,987 24,488 Investments 699 885 Liquidation of Société Europénne de Communication S.A. — –23,386 Total shares in Group companies 2,686 1,987 During 2002, the Parent Company paid a supplementary purchase price for Tele2 Russia Telecom BV (formerly Fora) of SEK 299 million and pro- vided a shareholder contribution to NetCom Luxembourg SA of SEK 400 million. Effect on cash of corporate acquisitions and divestments during the year: The Group’s book value of acquired/divested assets and liabilities in acquired/divested companies was: Group Acquired Divested 2002 2001 2002 2001 Intangible fixed assets –351 –394 — — Tangible fixed assets –2 –614 — — Financial fixed assets –1 –469 — — Inventories — –21 — — Current receivables –9 –238 — — Current investments and liquid funds –4 –890 — — Long-term liabilities 5 1,166 — — Current liabilities 12 428 — — Exchange rate difference — –11 — — Purchase sum –350 –1,043 — — Paid with own shares — 849 — — Paid through loans from the seller — 135 — — Paid/Received purchase sums –350 –59 — — Cash in acquired/divested companies 4 890 — — Effect on Group cash –346 831 — — 54 T E L E 2 A N N U A L R E P O R T 2002
  • 57.
    Cont. note 14 Legalstructure of the Tele2 Group*: * including associated companies and other investments Parent Company Number of Total par Holding Book value Company, reg. No, reg’d. Office shares value (capital/votes) Dec. 31, 2002 Dec. 31, 2001 Tele2 Russia Telecom BV, 33287334, Rotterdam, Netherlands 400 pcs NLG 40 000 100% 1,150 851 Tele2 Russia Telecom Services BV, 33.287.334, Amsterdam, Netherlands 100% PSNR Personal System Networks in region, 1025202610157, Niznhy Novgorod, Russia 100% Tele2 Russia EKA Holding GmbH, FN 131600 f, Wien, Austria 100% Fora Telecom M, no P-12721.17, Moscow, Russia 100% Tele2 Russia VOL Holding GmbH, FN 131602 h, Wien, Austria 100% Kursk Cellular Communications, no P-16792.17, Kursk, Russia 100% Smolensk Cellular Communications, no P-2581.16, Smolensk, Russia 60% Belgorod Cellular Communications, no P-2586.16, Belgorod, Russia 65% Kemerovo Mobile Communications, no P-13742.17, Kemerovo, Russia 100% Rostov Cellular Communications, no P-1790.16, Rostov, Russia 75% Udmurtiya Cellular Communications, no P-5818.16, Izhevsk, Russia 55% Siberian Cellular Communications, no P-4458.16, Omsk, Russia 60% Chelyabinsk Cellular Network, no P-3656.15, Chelyabinsk, Russia 51% Tele2 Russia MAC Holding GmbH, FN 132666 y, Vienna, Austria 100% CISC Cellular, no P-8068.17, Moscow, Russia 100% Millicom New Tech. in Communications, no P-9894.17, Moscow, Russia 100% Tele2 Russia International Holding BV, Nr 33221654, Amsterdam, Netherlands 100% Tele2 Russia International Cellular BV, Nr 33227655, Amsterdam, Netherlands 100% Suomen Kolmegee, Helsinki, Finland Note 18 27.44%/15% SCD Invest AB, 556353-6753, Sweden Note 18 9.1%/49.9% NetCom Luxembourg SA, RC B73.796 Luxembourg 1 000 pcs tEURO 35 100% 1,536 1,136 Tele2 Holding AB, 556579-7700, Stockholm, Sweden 100% Tele2 Sweden AB, 556267-5164, Stockholm, Sweden 100% Tele2 Sweden SA, RC B73.802, Luxembourg 100% 4 T Solutions Holding AB, 556580-2690, Stockholm, Sweden 100% XSource Corporation, USA Note 18 11,88% X-Source Holding AB, 556580-2682, Stockholm, Sweden 100% X-Source AB, 556290-2238, Stockholm, Sweden 100% X-Source SA, RC B 87235, Luxembourg 100% Optimal Telecom Holding AB, 556580-7855, Stockholm, Sweden 100% Optimal Telecom Sweden AB, 556440-1924, Stockholm, Sweden 100% Datametrix Sweden Holding AB, 556580-7871, Stockholm, Sweden 100% Datametrix AB, 556539-4870, Stockholm, Sweden 100% Everyday Holding AB, 556579-7718, Stockholm, Sweden 100% Stenblocket i Fruängen AB, 556058-8500, Stockholm, Sweden 100% Everyday Webguide AB, 556182-6016, Stockholm, Sweden Note 16 50% Svenska UMTS-nät Holding AB, 556606-7988, Stockholm, Sweden 100% Svenska UMTS-nät AB, 556606-7996, Stockholm, Sweden Note 16 50% Svenska UMTS-licens Holding AB, 556606-7764, Stockholm, Sweden, dormant 100% Tele2 Norway Holding AB, 556580-8143, Stockholm, Sweden 100% Tele2 AS, 974534703, Oslo, Norway 100% Tele2 Norge UMTS AS, 982795761, Oslo, Norway 100% Tele3 Norge AS, 932100975, Norway, dormant 100% Tele2 Danmark Holding AB, 556580-8028, Stockholm, Sweden 100% Tele2 Denmark A/S, 221234, Köpenhamn, Denmark 100% In2Loop A/S, 25 48 43 47, Köpenhamn, Denmark 100% In2loop Polska Sp. So.o, 54380, Warsawa, Poland 90% Web Communication BV, 34112460, Amsterdam, Netherlands 100% Tele2 Polska Sp, 57496, Warsawa, Poland 100% Tele2 Holding AS, 10262238, Tallinn, Estonia 90% Tele2 Eesti AS, 10069046, Tallinn, Estonia 52% UAB Tele2, 1147164, Vilnius, Lithuania 100% UAB Levi & Kuto Kaunas, 1149679, Kaunas, Lithuania, dormant 100% UAB Levi & Kuto Klaipeda, 1150061, Klaipeda, Lithuania, dormant 100% 2,686 1,987 55
  • 58.
    Cont. note 14 Parent Company Number of Total par Holding Book value Company, reg. No, reg’d. Office shares value (capital/votes) Dec. 31, 2002 Dec. 31, 2001 trsp 2,686 1,987 Belmus BV, 33261289, Amsterdam, Netherlands 100% Tele2 Eesti AS, 10069046, Tallinn, Estonia 48% Tele2 Holding SIA, 000351206, Latvia 100% SIA Tele2, 000327285, Latvia 100% OU Levicom BroadBand, 10309744, Tallinn, Estonia 100% UAB KRT, 2304688, Vilnius, Lithuania 100% UAB C-Gates, 2424016, Vilnius, Lithuania 100% UAB Trigeris, 2123967, Vilnius, Lithuania 100% AS Levi Kaabel, 10417072, Tallinn, Estonia 100% AS Telset Telecommunications Group, 10673906,Tallinn, Estonia 100% Tallinna Kaabeltelevisiooni AS, 10375439,Tallinn, Estonia 65% OU Trigger Software, 10687966, Tallinn, Estonia 100% AS Eesti Telag AS, 10310799, Tallinn, Estonia, dormant 100% SIA Levicom Broadband, 000353597, Riga, Latvia, dormant 100% Montalto Investments BV, 33135957,Amsterdam, Netherlands, dormant 100% Corporation Severnaya Korona, no P-6117.16, Irkutsk, Russia 100% St Petersburg Telecom, no AO-3177, St Petersburg, Russia 60.6% Oblcom, no P-7180.16, St Petersburg, Russia 60.6% ProcureITright AB, 556600-9436, Stockholm, Sweden 100% Proceedo Solution AB, 556599-5049, Stockholm, Sweden 100% Datametrix Norway AS, 975993108, Oslo, Norway 100% Datametrix Danmark A/S, 39419, Köpenhamn, Denmark 100% Datametrix OY AS, 378548, Helsingfors, Finland 100% OY Finland Tele2 AB, 1482343-8, Helsingfors, Finland 100% Interloop AB, 556284-7565, Stockholm, Sweden 100% NetCom GSM Sweden AB, 556304-7025, Stockholm, Sweden 100% Åkersberga KV AB, 556326-3192, Österåker, Sweden 100% Halmstads KV AB, 556380-6115, Halmstad, Sweden 100% Skaraborgs Kabel-TV AB, 556483-6467, Mariestad, Sweden 60% Hallstahammar KV KB, 916580-7912, Västerås, Sweden 90% Kopparstaden KV KB, 916583-0564, Västerås, Sweden 80% Nelab KV KB, 916597-8983, Västerås, Sweden 80% Kabelvision KB, 916836-8828, Sweden, dormant 100% KB Haninge Kabelvision, 916633-3485, Sweden, dormant 80% Härnösand Kabelvision KB, 916589-2481, Sweden, dormant 80% KB June Kabelvision, 916702-4836, Sweden, dormant 65% KB Lidingö Kabelvision, 916631-3289, Sweden, dormant 80% Älmhults Kabelvison KB, 916525,1043, Sweden, dormant 80% Trade2 (Sweden) AB, 556469-7836, Sweden, dormant 100% Comviq Broadband AB, 556405-6678, Sweden, dormant 100% SCD AB, 556353-6829, Sweden, dormant 100% Call2Web AB, 556403-7983, Sweden, dormant 100% NIU Nätteknik, Installation och Underhåll AB, 556041-1307, Sweden, dormant 100% Kalmar Kabelvision AB, 556244-2466, Sweden, dormant 100% Comviq GSM AB, 556450-2606, Sweden, dormant 100% Swipnet AB, 556411-9401, Sweden, dormant 100% NetCom Luxembourg Holding AB, 556580-7905, Sweden, dormant 100% Tele1 A/S, 955780132, Norway, dormant 100% SNPAC Swedish Nr Portability Adm.Centre AB, 556595-2925, Sweden Note 16 20% Travellink AB, 556596-2650, Stockholm, Sweden Note 18 15% S.E.C. Luxembourg S.A., R.C. B-84.649, Luxembourg 100% Managest Media SA, RCB87091, Luxembourg Note 16 40% Managest Media Spa, Italy 100% Tele2 Services Luxembourg SA, RC B 70203, Luxembourg 100% Societe Europeenne de Communication (Ireland) Ltd, 316848, Dublin, Ireland, dormant 100% 3C Communications (Ireland) Ltd, 164025, Ireland, dormant 100% 2,686 1,987 56 T E L E 2 A N N U A L R E P O R T 2002
  • 59.
    Cont. note 14 Parent Company Number of Total par Holding Book value Company, reg. No, reg’d. Office shares value (capital/votes) Dec. 31, 2002 Dec. 31, 2001 trsp 2,686 1,987 Tele2 s.r.o., 25650009, Prag, Czech Republic 100% Tele2 /Slovakia/ s.r.o., 35806486, Slovakia 100% Tele2 Magyarorszag Kft., 0109695967, Hungary 100% SEC Holding BV, 33141829, Rotterdam, Netherlands 100% Kinnevik Telecommunications Int. SA, RC B 52976, Luxembourg 100% Tele2 Europe SA, B 56944, Luxembourg 100% Tele2 Telecommunication Services GmbH, FN 178222t, Vienna, Austria 100% Tele2 Belgium SA, 609 392, Zellik, Belgium 100% Télé2 France SA, FR48-409914058, Velizy, France 100% Tele2 Telecommunication Services GmbH, 36232, Düsseldorf, Germany 100% Tele2 Italia Spa, Ml-1998-247322, Segrate, Italy 100% Tele2 AG, H.1045/80, Liechstenstein 100% Tele2 Luxembourg SA, B 65774, Luxembourg 100% Tele2 (Netherlands) BV, BV 291906, Amsterdam, Netherlands 100% Tele2 Telecommunication Services S.L, B82051913, Madrid, Spain 100% Tele2 Telecommunication Services AG, CH-020390 55 969, Zürich, Switzerland 100% Tele2 Communications Serv. Ltd, 3565220, London, UK 100% Telemilenio, Telecomunicacoes, Sociedade Unipessoal, 10468, Lissabon, Portugal 100% TANGO SA, RC 59560, Luxembourg 100% Transac SA, B49487, Luxembourg 100% Everyday Media SA, R.C. B 78.227, Luxembourg 100% Everyday Prod. SA, 69802, Luxembourg 100% Calling Card Company SA, B 424 906 618, Paris, France 5% 3C Communications International SA, RC B 29697, Luxembourg 100% 3C Communications GmbH, FN695021, Vienna, Austria 100% 3C Communications BVBA, 514 274, Brussels, Belgium 99% 3C Communications SPA Italy, 28894/7359/14, Segrate, Italy 91% 3C Communications Czech s-r-s, Czech Republic, dormant 100% 3C Communications A/S,184462, Ballerup, Denmark 100% 3C Communications OY, 585632, Finland 100% 3C Communications SA, 345 343 396 00023 Orleans, France 99% 3C Communications GmbH, HRB 24104, Germany 99% 3C Communications Luxembourg SA, B39690, Luxembourg 100% 3C Kommunikacios Szolgaltato Kft, Budapest, Hungary 90% 3C Communications BV, Amsterdam, 14630454, Netherlands 99% 3C Communications A/S, Oslo, Norway 100% 3C Transac A/S, Norway 100% 3C Communicacoes Ltda, Domingos de Rana, Portugal 95% 3C Communications Espana SA, Madrid, Spain 99% 3C Communications AB, 556332-6346, Stockholm, Sweden 97% 3C Transac AB Sweden,556057-2116, Stockhom, Sweden 100% 3C Communications Ltd, 2343138, UK 96% 3C Transac Ltd, Kingston-upon-Thames, UK 100% Comviq Holding BV, 14630454, Amsterdam, Netherlands 100% 3C Communications Equipment SA, B 25465, Luxembourg 100% 3C Communications BVBA, 514 274, Brussels, Belgium 1% 3C Communications SPA Italy, 28894/7359/14, Segrate, Italy 9% 3C Communications SA, 345 343 396 00023 Orleans, France 1% 3C Communications GmbH, HRB 24104, Germany 1% 3C Kommunikacios Szolgaltato Kft, Budapest, Hungary 10% 3C Communications BV, Amsterdam, 14630454, Netherlands 1% 3C Communicacoes Ltda, Domingos de Rana, Portugal 5% 3C Communications Espana SA, Madrid, Spain 1% 3C Communications AB, 556332-6346, Stockholm, Sweden 3% 3C Communications Ltd, 2343138, UK 4% 2,686 1,987 57
  • 60.
    Cont. note 14 Parent Company Number of Total par Holding Book value Company, reg. No, reg’d. Office shares value (capital/votes) Dec. 31, 2002 Dec. 31, 2001 trsp 2,686 1,987 CCC Holding BV, 33 269 398, Amsterdam, Netherlands 100% Calling Card Company Limited, 3794813, UK 100% CCC Calling Card Company Germany GmbH, HRB 40498, Germany 100% C3 Calling Card Company (Ireland) Limited, 309745, Ireland 100% Calling Card Company SA, B 424 906 618, Paris, France 95% Calling Card Company Italy SpA, 233372, Milano, Italy 100% Tele2 International Card Company S.A., RC 64 902, Luxembourg 100% Calling Card Company Netherlands BV, BV 82334, Amsterdam, Netherlands 100% Calling Card Company Spain, S.A. A-62426457, Spain 100% Calling Card Company Telecommunication Services GmbH, FN 215362i, Austria 100% SEC Everyday Europe BV, 341124357, Amsterdam, Netherlands 100% Everyday.com Internet Services GmbH, Austria 100% Everyday.com Switzerland AG, CHF-0203023164-4, Zürich, Switzerland 100% Everyday.com Germany GmbH, HR B 36232, Germany 100% Everyday.com France SAS, B-430291898, Velizy, France 100% Everyday.com Italia S.R.L, R.C. 1605497, Italia Srl, Italy 100% Everyday Luxembourg SA, B 64 902, Luxembourg 100% Everyday.com Netherlands BV, 34125168, Amsterdam, Netherlands 100% IntelliNet Holding BV, 34126307, Amsterdam, Netherlands 100% Intellinet Telecommunications GmbH, FN 190268 g, Vienna, Austria 100% Intellinet Telecommunication GmbH, HRB 48344, Frankfurt, Germany 100% IntelliNet S.p.A, R.C. 1615155, Segrate, Italy 99% IntelliNet BV, 34120156, Amsterdam, Netherlands 100% IntelliNet Telecommunication Services AG, CH-020.3.021.518-8, Zürich, Switzerland 100% Fagersta AB, 556238-4171, Stockholm, Sweden 100% Transcom Holding AB, 556468-0857, Sweden, dormant bolag 100% 3C Holding AB, 556491-9503, Sweden, dormant bolag 100% Tele2 Marketing Dynamics AS, 932100975, Norway, dormant 100% Tele2 Telecommunications Services Ltd, 292887, Dublin, Ireland, dormant 100% IntelliNet S.p.A, R.C. 1615155, Segrate, Italy 1% Total shares in Group companies 2,686 1,987 In October 2002, Tele2 acquired 100% of the shares in ProcureITright, a supplier of procurement function services and WEB-based procurement systems, from XSource Corporation. During 2002, the sale was made of the Swedish UMTS license to Svenska-nät AB, which is 50% owned with Telia; as well as a 20% share of OJSC Moscow Cellular Communication. Significant events after the end of the financial year In February 2003 Tele2 acquired Alpha Telecom. This is the UK’s leading operator in prepaid fixed network telephony for individuals and a market leader in cash cards for fixed telephony. Alpha Telecom, sells about 1.25 million cash cards per month from 60,000 sales outlets in the UK and has sales of SEK 1.9 billion. The acquisition price amounted to approximately SEK 780 million, on a debt-free basis. Note 15 Receivables from Group companies Parent company Dec. 31, 2002 Dec. 31, 2001 Acquisition value at Jan. 1 12,526 1,028 Lending 3,337 11,904 Amortization and additions granted –510 –406 Total receivables from Group companies 15,353 12,526 Receivables from/liabilities to Group companies are subject to commercial terms and conditions. 58 T E L E 2 A N N U A L R E P O R T 2002
  • 61.
    Note 16 Shares in associated companies Group Number of Total par Holding Book value Company, reg. No, reg’d. Office shares value Dec. 31, 2002 Dec. 31, 2001 Svenska UMTS-nät AB, 556606-7996, Stockholm, Sweden 502,000 pcs tSEK 50,200 50% 498 249 OJSC Moscow Cellular Com., P7696.16, Moscow, Russia 1,250,000 pcs tRUBEL 1,250 — — 75 Managest Media SA, RCB87091, Luxembourg 12,000 pcs B tEURO 120 40% 44 — SNPAC Swedish Number Portability Administrative Centre AB, 556595-2925, Stockholm, Sweden 200 pcs tSEK 20 20% — 2 Total shares in associated companies 542 326 Everyday Webguide AB, 556182-6016, Stockholm, Sweden 1,750 pcs tSEK 175 50% –28 –102 Total provisions to associated companies –28 –102 During the fourth quarter of 2002, Tele2 sold its 20% shareholding in Moscow Cellular Communication. Contribution of each associated company to Group equity: 2002 2001 Sv UMTS-nät Other Sv UMTS-nät Other (9 mth) Goodwill: Total goodwill, book value, Dec. 31 — — — — Equity share: Equity share, Jan. 1 249 –25 — –51 Acquired companies, opening balance — — — 75 Share of capital contributions and new share issues 250 147 250 8 Share of profit/loss –1 –40 –1 –57 Divestments during the year — –66 — — Equity share, Dec. 31 498 16 249 –25 Total shares in associated companies 498 16 249 –25 Note 17 Receivables from associated companies Group Parent Company Dec. 31, 2002 Dec. 31, 2001 Dec. 31, 2002 Dec. 31, 2001 Acquisition value at Jan, 1 115 105 115 67 Shareholder contribution –102 –7 –102 –7 Lending 6 17 6 55 Total receivables from associated companies 19 115 19 115 Receivables from associated companies are subject to commercial terms and conditions. 59
  • 62.
    Note 18 Other long-term holdings of securities Group Number of Total par Holding Book value Company, reg. No, reg’d. Office shares value capital voting rights Dec. 31, 2002 Dec. 31, 2001 Parent Company : Suomen Kolmegee, Helsinki, Finland 1,924 pcs tFIM 1 924 27.44% 15% 28 5 SCD Invest AB, 556353-6753, Stockholm 1,058,425 A 9.1% 49.6% — — 28 5 Other, Group: XSource Corporation, USA 1,806,575 pcs tUSD 18 11.88% 11.88% 36 122 Travellink AB, 556596-2650, Stockholm 15,000 pcs tSEK 1,500 15% 15% 75 75 Total long-term holdings of securities 139 202 Group Parent Company Dec. 31, 2002 Dec. 31, 2001 Dec. 31, 2002 Dec. 31, 2001 Acquisition value: Acquisition value at Jan. 1 545 489 348 366 Investments for the year 23 74 23 — Sales for the year — — — –18 Reclassification — –18 — — Total acqusition value 568 545 371 348 Write-downs: Accumulated write-downs at Jan, 1 –343 –343 –343 –343 Write-downs during the year –86 — — — Total accummulated write-downs –429 –343 –343 –343 Total other long-term holdings of securities 139 202 28 5 During 2002, additional investments were made in Suomen Kolmegee OY for SEK 23 million, as well as share write-downs in XSource Corporation by SEK 86 million. The book value is regarded as corresponding to real value. Note 19 Other long-term receivables Group Parent Company Dec. 31, 2002 Dec. 31, 2001 Dec. 31, 2002 Dec. 31, 2001 Acquisition value at Jan. 1 85 106 — 46 Lending 8 23 — 12 Amortization –11 –5 — — Reclassification –7 –41 — –58 Translation difference –1 2 — — Total other long-term receivables 74 85 — — Group Parent Company Dec. 31, 2002 Dec. 31, 2001 Dec. 31, 2002 Dec. 31, 2001 Receivable from Finvision 39 47 — — Receivable from XSource Corporation 20 17 — — Receivable from Alecta 6 6 — — Other 9 15 — — Total other long-term receivables 74 85 — — 60 T E L E 2 A N N U A L R E P O R T 2002
  • 63.
    Note 20 Accounts receivable, trade Group Accounts receivable, trade Dec. 31, 2002 Dec. 31, 2001 Accounts receivable, trade 5,656 4,542 Reserve for doubtful receivables –1,283 –918 Total accounts receivable, trade 4,373 3,624 Group Reserve for doubtful receivables Dec. 31, 2002 Dec. 31, 2001 Reserve for doubtful receivables at Jan. 1 918 558 Reserves in companies acquired during the year — 15 Netincrease of reserve 415 349 Recovery of previous write-downs –30 –36 Translation difference in opening balance –20 32 Total reserve for doubtful receivables 1,283 918 Credit risk entails the book losses that should be reported as of the closing date if the counter-parties have completely neglected to fulfill their pay- ment liability in accordance with agreements. The Group has limited its credit risk in respect of receivables by continually conducting credit assess- ments of the customer stock. Since the Group has a highly varied customer stock that covers individuals as well as companies, this entails that the credit risk is limited. The Group makes provisions for any credit losses, and these have remained within management’s expectations. Note 21 Other current receivables Group Parent Company Dec. 31, 2002 Dec. 31, 2001 Dec. 31, 2002 Dec. 31, 2001 VAT receivables 174 262 — 2 Receivable from Kinnevik — 78 — — Receivable from Millicom International BV — 113 — — Receivable from Svenska UMTS-nät 32 11 — — Receivable from suppliers 13 — — — Miscellaneous 31 66 — — Total other current receivables 250 530 — 2 Note 22 Prepaid expenses and accrued revenues Group Parent Company Dec. 31, 2002 Dec. 31, 2001 Dec. 31, 2002 Dec. 31, 2001 Accrued telephony revenue, other telecom operators 934 544 — — Accrued telephony revenue, customers 1,525 1,511 — — Finanacing fees 170 209 — — Prepaid financing charges 420 505 1 1 Total prepaid expenses and accrued revenues 3,049 2,769 1 1 61
  • 64.
    Note 23 Liquid funds and overdraft facilities Liquidity Group Parent Company Dec. 31, 2002 Dec. 31, 2001 Dec. 31, 2002 Dec. 31, 2001 Cash and bank balances 2,473 2,275 10 8 Current investments — — — — Total cash 2,473 2,275 10 8 Blocked accounts –870 –897 — — Unutilized overdraft facilities and credit lines 729 247 — — Total liquidity 2,332 1,625 10 8 Overdraft facilities Group Parent Company Dec. 31, 2002 Dec. 31, 2001 Dec. 31, 2002 Dec. 31, 2001 Overdraft facilities granted 19 26 — — Overdraft facilities utilized — –14 — — Total unutilized overdraft facilities 19 12 — — Unutilized credit lines 710 235 — — Unutilized overdraft facilities and credit lines 729 247 — — Collateral pledged for overdraft facilities Group Parent Company Dec. 31, 2002 Dec. 31, 2001 Dec. 31, 2002 Dec. 31, 2001 Receivables — 18 — — Other assets — 9 — — Total collateral pledged for own overdraft facilities — 27 — — Exchange-rate difference in liquid funds Group Dec. 31, 2002 Dec. 31, 2001 Liquid funds at Jan. 1 –185 83 Cash flow for the year –68 –58 Total exchange-rate difference in cash –253 25 62 T E L E 2 A N N U A L R E P O R T 2002
  • 65.
    Note 24 Shareholders' equity Exchange-rate difference: Group Exchange-rate difference in shareholders' equity Other restricted Unrestricted Total reserves reserves Opening shareholders' equity, Jan. 1, 2002 1,049 –320 729 Change during the year 1,844 –110 1,734 Year-end, Dec. 31, 2002 2,893 –430 2,463 Other changes during the year –4,189 3,165 –1,024 Tax effect this year, net — –2 –2 Total change during the year –4,189 3,163 –1,026 Closing adjusted shareholders’ equity, Dec. 31, 2002 –1,296 2,733 1,437 Exchange rate difference in consolidated income statement: Exchange-rate differences that arise in operations are reported across the income statements and amount to: Group Parent Company 2002 2001 2002 2001 Other operating revenue 24 33 1 — Other operating expenses –35 –20 — — Result from other securities and receivables treated as fixed assets — –1 — — Other interest income and similar profit/loss items 7 –1 — — Interest expense and similar profit/loss items 57 2 — — Exchange-rate difference in the income statement 53 13 1 — The consolidated balance sheet and income statement are affected by fluctuations in subsidiaries' currencies via-á-vis the Swedish krona. Group operating revenue and EBITDA are distributed among the following currencies: Operating revenue EBITDA 2002 2001 2002 2001 SEK 10,337 33% 9,289 37% 4,516 88% 3,690 217% EURO 13,523 43% 10,084 40% –355 –7% –2,172 –128% Other 7,422 24% 5,712 23% 966 19% 180 11% Total 31,282 100% 25,085 100% 5,127 100% 1,698 100% A 1% currency movement against the Swedish krona affects the Group's operating revenue and EBITDA on an annual basis by SEK 209 million (2001: SEK158 million) and SEK 6 million (2001: SEK –20 million), respectively. At December 31, 2002 changes in exchange rates compared with the preceding year affected operating revenue by SEK 57 million and EBITDA by SEK –1 million. The change rates used to translate income statements and balance sheets to SEK are shown below. Income statement Balance sheet 2002 2001 Dec. 31, 2002 Dec. 31, 2001 GBP 14.6394 14.8725 14.1475 15.4750 USD 9.82870 10.33080 8.825 10.6675 EURO 9.1698 9.2519 9.1925 9.4190 CHF 6.2494 6.1280 6.3235 6.3600 DKK 1.2340 1.2415 1.2375 1.2665 NOK 1.2150 1.1499 1.2595 1.1835 EEK 0.5860 0.5913 0.5875 0.6020 LVL 15.8860 16.5171 15.0200 16.9000 LTL 2.6490 2.5819 2.6600 2.6700 PLN 2.4076 2.5239 2.3000 2.6900 CZK 0.2971 0.2718 0.2933 0.2936 HUF 0.0377 0.0361 0.0390 0.0382 Currency risks: In telephony operations a currency risk arises in connection with international call traffic, which means that a liability or a receivable arises between Tele2 companies and foreign operators. In mobile telephony through December 2002, these transactions were calculated in SDRs (Special Drawing Rights) but were invoiced and paid in USD. As of 2003, these are calculated and paid in EURO. Currency risks in our international operations are limited by denominating loans to group companies in the subsidiary’s local currency. The five-year loan facility is denominated partly in EURO. The exchange-rate difference that continually arises in translating the loan liability is offset against the exchange-rate differences that arise on the corresponding net investment in subsidiaries. No hedging is undertaken against other types of currency risk. 63
  • 66.
    Not 25 Number of shares The share capital in Tele2 AB is divided into two share classes, namely, Series A and B shares. Both types of shares have a par value of SEK 5 per share and offer equal participation in the company’s net assets and earnings. Series A shares, however, entitle the holder to 10 voting rights and Series B shares to one voting right. Parent Company A-shares B-shares Change Total Change Total Total Par value per Share capital Number share (SEK) (MSEK) Number of shares: December 31, 1999 18,095,632 85,754,614 103,850,246 SEK 5 519 New share issue, acq. of SEC 11,911,315 30,006,947 28,837,165 114,591,779 144,598,726 SEK 5 723 New share issue, options 30,006,947 200,000 114,791,779 144,798,726 SEK 5 724 December 31, 2000 30,006,947 114,791,779 144,798,726 SEK 5 724 New share issue, acq. of Tele2 Russia 30,006,947 2,461,449 117,253,228 147,260,175 SEK 5 736 New share issue, convertibles 30,006,947 100,000 117,353,228 147,360,175 SEK 5 737 December 31, 2001 30,006,947 117,353,228 147,360,175 SEK 5 737 Reclassification, A- to B-shares –8,317,143 21,689,804 8,317,143 125,670,371 147,360,175 SEK 5 737 New share issue, convertibles*) 21,689,804 100,000 125,770,371 147,460,175 SEK 5 737 December 31, 2002 21,689,804 125,770,371 147,460,175 SEK 5 737 Outstandng convertibles and warrants: Convertibles, 2000–2003 — 100,000 100,000 Warrants, 2002–2005 — 663,000 663,000 Total number of shares after full dilution 21,689,804 126,533,371 148,223,175 *) At December 31, 2002 the shares converted during 2002, 100 000 B-shares, were being registered at the Swedish Patent and Registration Office. Convertibles and warrants: In October 2000, three convertible debenture loans were issued at a par value of SEK 1, each with preference rights to subscribe for 100,000 B shares in Tele2 AB at a subscription price of SEK 150 per share, and maturing in 2001, 2002 and 2003. See Note 38 for further information. The outstanding warrants at Dec. 31, 2002 correspond to 663,000 B shares, at a subscription price of SEK 191 per share and a subscription period from 2005 to 2006. See Note 38 for further information. Earnings per share: Group Earnings per share Earnings per share, after full dilution 2002 2001 2002 2001 Net profit/loss for the year 223 392 223 392 Reversal: interest for the year after tax on outstanding convertibles — — Adjusted profit/loss for the year after full dilution 223 392 Weighted average number of shares 147,360,175 145,003,847 Weighted average number of outstanding shares after full dilution 147,634,293 145,223,466 Earnings per share SEK 1.51 SEK 2.70 SEK 1.51 SEK 2.70 Dividend per share: Tele2 AB did not pay a dividend during the year and does not foresee paying a dividend during the current fiscal year. 64 T E L E 2 A N N U A L R E P O R T 2002
  • 67.
    Note 26 Liabilities to financial institutions Short-term liabilities to financial institutions Group Parent Company Dec. 31, 2002 Dec. 31, 2001 Dec. 31, 2002 Dec. 31, 2001 Five-year loan facility 2,344 707 — — Alfa Bank /Omskpromstoy Bank 3 — — — (collateralt: chattel mortgages in Seberian Cellular Comm., Omsk Russia) Financial leases 30 24 — — Total short-term interest-bearing loans 2,377 731 — — Long-term liabilities to financial institutions Creditors Group (collateral provided) Interest-rate terms Maturity date Dec. 31, 2002 Dec. 31, 2001 Parent Company: — — Other Group companies: Five-year loan facility EURIBOR/LIBOR + 0.75–2.25% 2003–2006 6,954 9,834 (collateral: shares in Tele2 Sverige and SEC SA as well as certain shares in Group companies which in turn are subject to guarantees Tele2 AB and cross-guarantees among certain Group companies, and collateral provided in the form of receivables from certain Group companies and limitations in repayment potential of internal loans from Tele2 AB) Banque Invik marginal 0.5%–1% 2004–2005 755 881 (collateral: Blocked bank accounts in Tele2 Russia Telecom BV) Merita-Nordbanken variable rate 2004 1 3 (collateral: guarantees by Tele2) Financial leasing, for machinery & technical plant 166 125 Total long-term interest-bearing loans 7,876 10,843 Collateral provided for liabilities to financial institutions Group Parent Company Dec. 31, 2002 Dec. 31, 2001 Dec. 31, 2002 Dec. 31, 2001 Chattel mortgages 11 — — — Net assets in subsidiaries 22,778 23,197 Bank deposits 841 897 — — Total collateral provided for liabilities to financial institutions 23,630 24,094 — — During 2001, Tele2 Sverige AB signed a new five-year bank finance facility for SEK 10.8 billion, guaranteed by ABN Amro, CIBC World Markets, ING Bank, Nordea, The Royal Bank of Scotland and West LB. The loan is partly denominated in SEK and partly in EUR. The five-year bank financing facil- ity with amortization is divided up into three tranches, in which the agreed SEK 9.4 billion in Tranche A is to be repaid in seven repayments, and in which each amortization amounts to between 5% an 15% of the original loan amount and the remaining 17.5% of the loan is to be repaid by June 30, 2006. During 2002, repayment of Tranche A was made in the amount of SEK 467 million. The potential to borrow under Tranche B is limited to SEK 1.1 billion and is to be repaid by June 30, 2006. Tranche C, amounting to SEK 250 million, was repaid in its entirety in January 2002. The five-year loan facility is based on requirements involving the fulfillment of certain financial key ratios. Tele2 expects to fulfill the requirements. The loan liability carries a rate of interest corresponding to Euribor and Libor, respectively, plus an interest margin. The interest margin, which is based on indebtedness in relation to EBITDA, starts at 2.25% and is reduced in line with the improvement in EBITDA. At December 31, 2002 Tele2 attained the minimum interest differential of 0.75% with effect from February 2003. The five-year facility entails a certain curtailment of Tele2 Group’s potential to raise other external loans and the potential to provide assets as collateral. The loan in Banque Invik pertains to loan to the Russian operations. Tele2 has deposited the corresponding amount with Banque Invik. The inter- est margin is 0.5%–1%. Pledged shares are reported in the Group at an amount that corresponds to the book value of the net assets that each subsidiary represents in the consolidated balance sheet. The average rate of interest on loan liabilities during the year was 6.4% (2001: 6.3%). Loan liability matures Group Parent Company Dec. 31, 2002 Dec. 31, 2001 Dec. 31, 2002 Dec. 31, 2001 Within1 year 2,377 731 — — 1–2 years 3,070 2,375 — — 2–3 years 2,646 3,254 — — 3–4 years 2,049 2,601 — — 4–5 years 16 2,553 — — 5–10 years 75 60 — — 10–15 years 20 — — — Total loans to financial institutions 10,253 11,574 — — 65
  • 68.
    Cont. note 26 Interestrate risk: Of the total loan liability at December 31, 2002, SEK 9,330 million, corresponding to 91% (2001: SEK 10,824 million, 91%) carried a variable rate of interest. An increase in interest rates of 100 basic points would entail an additional interest expense of SEK 93 million, calculated on the basis of variable interest-bearing liabilities at December 31, 2002. The Group’s interest-rate on borrowing is currently variable with fixed-interest periods of up to 12 months. However, Tele2 is monitoring trends on interest-rate markets and decisions regarding the interest-rate fixing strategy are assessed continually. Interest-bearing liabilities with variable interest rates mature for payment as follows: Within 1 year 1–2 years 2–3 years 3–4 years 4–5 years 5–10 years Total Interest-bearing liabilities with variable interest rates 2,352 2,368 2,578 2,032 — — 9,330 Financial leasing: All fixed assets utilized through financial leasing have been included in the consolidated accounts as fixed assets and loan liabilities, with the exception, however, of contracts signed before 1997. The effects of these being included in the consolidated balance sheet are shown below and In Note 13. Group Financial leasing Booked Not booked Dec. 31, 2002 Dec. 31, 2001 Dec. 31, 2002 Dec. 31, 2001 Short-term portion 30 24 8 9 Long-term portion 166 125 84 91 Total loans for financial leasing objects 196 149 92 100 Dec. 31, 2002 Group Loan liability matures Booked Not booked Within 1 year 43 12 1–2 years 30 12 2–3 years 28 12 3–4 years 25 12 4–5 years 23 11 5–10 years 79 42 10–15 years 22 13 Total loan liability and interest 250 114 Less interest portion: –54 –22 Total loans for financial leasing objects 196 92 Financial leasing pertains primarily to the extension of transmission capacity in Sweden through Svenska Kraftnät Vattenfall and agreements signed in Denmark. Also, financial leasing occurs in Estonia, Russia and Luxembourg. During 2002, investments amounted to SEK 83 million, primarily in Sweden in the amount of SEK 66 million and in Luxembourg in the amount of SEK 11 million. During the year, termination of financial leasing occurred in Estonia and Latvia. Note 27 Other interest-bearing liabilities Other short-term interest-bearing liabilities Group Parent Company Dec. 31, 2002 Dec. 31, 2001 Dec. 31, 2002 Dec. 31, 2001 XSource Corporation 5 — — — Levicom International — 134 — — Ericsson — 17 — — Total other short-term interest-bearing liabilities 5 151 — — Other long-term interest-bearing liabilities Group Parent Company Dec. 31, 2002 Dec. 31, 2001 Dec. 31, 2002 Dec. 31, 2001 SCD Finans AB 23 — — — Ericsson — 2 — — Motorola — 55 — — Kinnevik S.A. — 14 — — Millicom International BV — 44 — — Total other long-term interest-bearing liabilities 23 115 — — 66 T E L E 2 A N N U A L R E P O R T 2002
  • 69.
    Cont. note 27 Loan maturity schedule Group Parent Company Dec. 31, 2002 Dec. 31, 2001 Dec. 31, 2002 Dec. 31, 2001 Within 1 year 5 151 — — 1–2 years 23 115 — — Total other interest-bearing liabilities 28 266 — — Note 28 Other short-term liabilities Group Parent Company Dec. 31, 2002 Dec. 31, 2001 Dec. 31, 2002 Dec. 31, 2001 VAT liability 276 218 — — Tax-at-source, personnel 27 37 — — Other taxes 59 34 — — Liability to SCD Finans AB — 30 — — Liability to Motorola — 26 — — Customer deposits 26 17 — — Other 53 13 5 — Total other short-term liabilities 441 375 5 — Note 29 Accrued expenses and prepaid revenues Group Parent Company Dec. 31, 2002 Dec. 31, 2001 Dec. 31, 2002 Dec. 31, 2001 Personnel-related costs 168 734 4 3 Interest expenses 212 150 — — Telephony expenses to other telecom operators 1,701 1,664 — — Expenses for vendors 14 12 — — Leasing and rental expenses 24 29 — — Program costs 33 33 — — External services expenses 715 602 4 4 Prepaid income 702 541 — — Other 204 249 — — Total accrued expenses and prepaid revenues 3,773 4,014 8 7 When Tele2 acquired Société Europénne de Communication SA, through an offer to SEC’s shareholders, there were outstanding stock options in SEC. Tele2’s offer did not encompass the stock options, thus in order to calculate net assets, these have been given a theoretical value as if they had been encompassed by the offer and booked as a liability in the consolidated balance sheet. During 2002, this liability was adjusted vis-à-vis goodwill, shown above as a personnel-related cost, and adjusted against goodwill the amount of SEK 498 million, with no effect on cash and profit. Note 30 Pledged assets Group Parent Company Dec. 31, 2002 Dec. 31, 2001 Dec. 31, 2002 Dec. 31, 2001 Chattel mortgages 11 — — — Net assets in Group companies 22,778 23,197 Inventories 19 18 — — Receivables — 18 — — Bank bills 870 897 — — Other assets — 9 — — Total assets pledged for own liabilities 23,678 24,139 — — The above information shows the book value of assets pledged as collateral for external loans (as in Note 26), overdraft facilities and blocked bank funds (as in Note 23) and other liabilities (as in Note 27). In the Group, pledged shares are reported in an amount corresponding to the book value of the net assets that each subsidiary represents in the consolidated balance sheet. 67
  • 70.
    Note 31 Contingent liabilities and other commitments Group Parent Company Dec. 31, 2002 Dec. 31, 2001 Dec. 31, 2002 Dec. 31, 2001 Surety bonds benefiting Group companies — — 12,825 15,133 Total contingent liabiities — — 12,825 15,133 SEK 9,298 million (SEK 10,541 million) of the contingent liabilities in the Parent Company relates to a guarantee for the five-year loan facility (see Note 26). Operational leasing: Operational leasing fees Group Parent Company 2002 2001 2002 2001 Annual fees for operating leases 752 782 — — Payment schedule for future fees Group Parent Company Dec. 31, 2002 Dec. 31, 2001 Dec. 31, 2002 Dec. 31, 2001 Within 1 year 621 471 — — 1–2 years 279 238 — — 2–3 years 197 189 — — 3–4 years 158 123 — — 4–5 years 135 112 — — More than 5 years 759 727 — — Total future fees for operating leases due for payment 2,149 1,860 — — Contractual commitments/commercial pledges: Group Dec. 31, 2002 Within 1 year 1–3 years 3–5 years After 5 years Total Liabilities to financial institutions 2,377 5,716 2,065 20 10,178 Other interest-bearing liabilities 5 23 — — 28 Financial leasing, agreements signed before 1997 8 16 16 52 92 Operational leasing 621 476 293 759 2,149 Total contractual commitments/commercial pledges 3,011 6,231 2,374 831 12,447 Note 32 Supplementary cash-flow information Transactions not affecting cash are as follows: In addition to the reported investing and financing operations, as shown in the cash flow statement, the following transactions occurred that did not affect cash. In addition to reported investments and loan liabilities in cash flow, investments and the raising of loans through financial leasing amounted to SEK 66 million (2001: SEK 17 million), as well as amortization of loans through financial leasing in the amount of SEK –20 million (2001: SEK –22 million). During 2002, the Parent Company received a Group contribution from Tele2 Sweden amounting to SEK 3,035 million (2001: SEK 2,100 million) and provided a shareholder contribution of SEK 400 million, which has not been reported as financial activities. In the Parent Company, the acquisition of shares in 2001 in Tele2 Russia Telecom BV and in OU Levicom Broadband, respectively, was conduct- ed through a limited share issue of SEK 849 million and through loan financing at the seller amounting to SEK 134 million and is not included in cash flow as investing or financing. On the acquisition date, the companies had cash of SEK 884 million and SEK 5 million, respectively, which is reported in the cash flow as a reduction in investment. In addition to the reported sale of shares in subsidiaries in the cash flow in 2001, the Parent Company divested shares in OU Levicom Broadband and Travellink AB for SEK 93 million to the subsidiary Tele2 Sverige AB. In addition to the reported sale of shares in subsidiaries, Tele2 AB’s subsidiary, Société Européenne de Communication S.A., was liquidated in 2001. This represented a net reduction of SEK 9,421 million, since the shares were booked at a value of SEK 23,385 million and the loss on liquidation amounted to SEK 13,964 million. 68 T E L E 2 A N N U A L R E P O R T 2002
  • 71.
    Cont. note 32 Cashflow statement based on net profit/loss: Group 2002 2001 Current operations Net profit/loss for the year 223 392 Adjustment of items in profit/loss for the year that do not generate cash flow from current operations: Depreciation/Amortization 3,597 3,054 Minority interest –1 –1 Profit/loss from shares in associated companies 36 –33 Deferred tax expense 525 –2,334 Financial leasing –9 –5 Unpaid interest 107 88 Write-down of shares 86 — 4,564 1,161 Change in working capital –199 –748 Cash flow from current operations 4,365 413 Investments according to the cash flow statement by market and operating area: Group Investments 2002 2001 Nordic 902 1 029 Eastern Europe and Russia 594 328 Central Europe 135 149 Southern Europe 142 454 Luxembourg 94 122 Branded products & other services 23 63 1,890 2,145 Change in long-term receivable 3 87 Acquisition/divestment of companies 623 –765 Total investments according to cash flow statement 2,516 1,467 Group Investments 2002 2001 Mobile telephony 998 789 Fixed telephony and Internet 794 1,272 Cable-TV 85 52 Data processing 13 32 1,890 2,145 Change in long-term receivable 3 87 Acquisition/divestment of companies 623 –765 Total investments according to cash flow statement 2,516 1,467 Additional information on segments is presented in Notes 33–34. Note 33 Market areas The Group’s operations are primarily divided among six market areas: Nordic, Eastern Europe and Russia, Central Europe, Southern Europe, Luxembourg and Branded products & services, which reflect internal reporting to the Board and executive management and the division of respon- sibility and organization within the Group. Market control and prioritization is largely jointly undertaken for continental Europe, and thus goodwill and depreciation/amortization attributable to the acquisition of the SEC Group is not broken down across market areas Central Europe, Southern Europe, Luxembourg and Branded products & services. The Nordic market area is acting on a more mature market, while continental Europe has not pursued operations for an equally long period. The Eastern Europe and Russia market area is yet another market with its own particular risks and possibilities. The division is based on the geographi- cal location of operations, which also reflects where customers are located. Relations between companies within the Group are based on commercial terms and conditions and pricing. The Nordic market area consists of Tele2 operations in Sweden, Norway, Denmark and Finland, Datametrix operation and ProcureITright. Optimal Telecom are also included in the Nordic market area as of January 1, 2002, having previously been part of the Branded products & services market area. The Eastern Europe and Russia market area encompasses Tele2 operations in the Baltic States (Estonia, Latvia and Lithuania), Poland, Czech 69
  • 72.
    Cont. note 33 Republicand Russia as well as X-Source operations. The Central Europe market area comprises Tele2 operations in Germany, Netherlands, Switzerland, Austria and a license in Ireland. The Southern Europe market area comprises Tele2 operations in France, Italy, Spain and Portugal. The Luxembourg market area encompasses Tele2 operations in Liechtenstein and Luxembourg, plus the recently launched operations in Belgium, as well as 3C oper- ations and Transac. The Branded products & services market area comprises Tele2 UK, C3-operations, Everyday operations and IntelliNet operations. Operating revenue, operating profit before and after depreciation/amortization, as well as investments for the operating areas in each market area are presented in Note 1, Note 2 and Note 32. Group Dec. 31, 2002 Eastern Branded Non-distributed Europe & Central Southern products and internal Nordic Russia Europe Europe Luxembourg & services elimination Total Balance sheet ASSETS Intangible fixed assets 1,025 3,491 46 2 177 4 20,351 25,096 Tangible fixed assets 6,055 1,399 616 557 569 61 — 9,257 Shares in associated companies 498 — — — 44 — — 542 Other long-term securities 103 36 — — — — — 139 Other financial fixed asets 9,318 326 180 129 3,426 16 –12,056 1,339 16,999 5,252 842 688 4,216 81 8,295 36,373 Current assets 5,008 813 1,591 2,074 1,806 313 –1,106 10,499 Total assets 22,007 6,065 2,433 2,762 6,022 394 7,189 46,872 LIABILITIES Provisions 28 — — — — — — 28 Interest-bearing liabilities 9,931 4,140 1,523 680 5,195 976 –12,164 10,281 Long-term liabilities, other — 1 — 142 1 12 –156 — Current liabilities, other 3,274 651 2,402 2,297 637 422 –1,870 7,813 Total liabilities 13,233 4,792 3,925 3,119 5,833 1,410 –14,190 18,122 Group 2002 Eastern Branded Non-distributed Europe & Central Southern products and internal Nordic Russia Europe Europe Luxembourg & services elimination Total Income statement Operating revenue external 13,566 2,320 5,689 8,105 754 848 — 31,282 internal, other Group 79 41 265 263 29 95 –772 — internal, market area 585 8 113 47 87 61 –901 — Operating revenue, total 14,230 2,369 6,067 8,415 870 1,004 –1,673 31,282 Depreciation/amortization –1,435 –577 –133 –129 –92 –12 –1,219 –3,597 Operating expenses, other –9,410 –1,877 –6,348 –8,514 –747 –1,181 1,934 –26,143 Other operating revenue 37 33 204 1 6 5 –236 50 Other operating expenses –43 16 –4 –3 –3 — –25 –62 Operating profit/loss 3,379 –36 –214 –230 34 –184 –1,219 1,530 Profit/loss on assoc. companies –31 –4 — — –1 — — –36 Profit/loss on fixed assets –86 2 –84 Other interest income, etc. 165 165 Interest expense, etc. –779 –779 Profit/loss after financial items 3,348 –126 –214 –230 33 –184 –1,831 796 Tax on profit for the year –574 –574 Minority interest 1 1 Profit/loss for the year 3,348 –126 –214 –230 33 –184 –2,404 223 Miscellaneous Investments, intangible assets 23 124 — — — — 147 Investments, tangible assets 885 504 339 142 95 19 –219 1,765 70 T E L E 2 A N N U A L R E P O R T 2002
  • 73.
    Cont. note 33 Group Dec. 31, 2001 Eastern Branded Non-distributed Europe & Central Southern products and internal Nordic Russia Europe Europe Luxembourg & services elimination Total Balance sheet ASSETS Intangible fixed assets 1,317 3,547 55 16 201 6 22,627 27,769 Tangible fixed assets 6,162 1,408 479 682 578 122 — 9,431 Shares in associated companies 251 75 — — — — — 326 Other long-term securities 80 122 — — — — — 202 Other financial fixed asets 9,935 577 — — 4,331 — –12,879 1,964 17,745 5,729 534 698 5,110 128 9,748 39,692 Current assets 4,459 2,554 1,367 2,027 2,643 590 –4,074 9,566 Total assets 22,204 8,283 1,901 2,725 7,753 718 5,674 49,258 LIABILITIES Provisions 102 — — — — — — 102 Interest-bearing liabilities 11,094 6,843 1,424 1,531 4,359 1,076 –14,473 11,854 Long-term liabilities, other 7 1 — — — — — 8 Current liabilities, other 3,970 659 2,243 3,045 1,393 631 –4,192 7,749 Total liabilities 15,173 7,503 3,667 4,576 5,752 1,707 –18,665 19,713 Group 2001 Eastern Branded Non-distributed Europe & Central Southern products and internal Nordic Russia Europe Europe Luxembourg & services elimination Total Income statement Operating revenue external 11,898 1,148 4,844 5,124 663 1,408 — 25,085 internal, other Group 226 33 396 444 74 84 –1,257 — internal, market area 242 — 124 23 49 84 –522 — Operating revenue, total 12,366 1,181 5,364 5,591 786 1,576 –1,779 25,085 Depreciation/amortization –1,011 –447 –101 –96 –118 –36 –1,245 –3,054 Operating expenses, other –8,760 –907 –5,968 –6,923 –777 –1,986 1,820 –23,501 Other operating revenue 198 9 15 2 3 4 –42 189 Other operating expenses –36 –11 –17 –1 –7 –4 1 –75 Operating profit/loss 2,757 –175 –707 –1,427 –113 –446 –1,245 –1,356 Profit/loss on assoc. companies –58 — — — 91 — — 33 Profit/loss on fixed assets 4 4 Other interest income, etc. 65 65 Interest expense, etc. –690 –690 Profit/loss after financial items 2,699 –175 –707 –1,427 –22 –446 –1,866 –1,944 Tax on profit for the year 2,335 2,335 Minority interest 1 1 Profit/loss for the year 2,699 –175 –707 –1,427 –22 –446 470 392 Miscellaneous Investments, intangible assets 1 –2 2 15 1 — 17 Investments, tangible assets 1,094 363 151 442 125 66 –32 2,209 71
  • 74.
    Note 34 Operating areas A secondary division of operations takes the form of a grouping into four operating areas: Mobile telephony, Fixed telephony & Internet, Cable-TV and Data processing, which is based on services and products that differ from each other in terms of risks and possibilities. The Fixed telephony & Internet operating area includes fixed telephony as well as the Dial-up and DNS data services. The Cable-TV operating area encompasses broadband services, Cable-TV, the radio station Tango Sunshine and Tango TV. The Data processing operating area includes IT-out- sourcing via X-source, as well as system integration through Datametrix, Internet payments, credit card transactions and call phone services via 3C, data processing of card transactions and invoicing through Transac, cash cards for fixed telephony through C3 and the Internet portal, Everyday. It is not practically possible to distribute financial fixed assets and current assets by operating area. Operating revenue, operating profit before and after depreciation/amortization, as well as investments of the operating areas in each market area are presented in Note 1, Note 2 and Note 32. Group Dec. 31, 2002 Non-dist. and Mobile Fixed telephony Data internal telephony & Internet Cable-TV processing elimination Total Balance sheet Intangible fixed assets 3,687 1,014 3 41 20,351 25,096 Tangible fixed assets 4,232 4,226 736 63 — 9,257 Financial fixed assets 2,020 2,020 Current assets 10,499 10,499 Total assets 7,919 5,240 739 104 32,870 46,872 Group 2002 Non-dist. and Mobile Fixed telephony Data internal telephony & Internet Cable-TV processing elimination Total Income statement Operating revenue from external customers 9,819 20,843 298 322 — 31,282 Miscellaneous Investments in intangible assets 121 26 — — — 147 Investments in tangible assets 901 763 88 13 — 1,765 Group Dec. 31, 2001 Non-dist. and Mobile Fixed telephony Data internal telephony & Internet Cable-TV processing elimination Total Balance sheet Intangible fixed assets 4,188 948 4 2 22,627 27,769 Tangible fixed assets 4,345 4,285 744 57 — 9,431 Financial fixed assets 2,492 2,492 Current assets 9,566 9,566 Total assets 8,533 5,233 748 59 34,685 49,258 Group 2001 Non-dist. and Mobile Fixed telephony Data internal telephony & Internet Cable-TV processing elimination Total Income statement Operating revenue from external customers 7,615 16,937 172 361 — 25,085 Miscellaneous Investments in intangible assets –2 18 — 1 — 17 Investments in tangible assets 841 1,280 57 31 — 2,209 72 T E L E 2 A N N U A L R E P O R T 2002
  • 75.
    Note 35 Transactions with related parties As a result of its substantial direct and indirect shareholdings in the Tele2 Group, Invik Group, Kinnevik Group, Transcom Worldwide Group, Millicom Group, XSource Corporation Group, MTG Group, Metro Group and other companies, the Stenbeck family has the potential to exert considerable influ- ence in terms of financial and operational decisions regarding operations in these companies. These companies has been regarded as related parties to Tele2. Business relations between Tele2 and all closely related parties are subject to commercial terms and conditions. Significant transactions in recent years: • At year-end 1998, Tele2 acquired 48% of Tele2 Eesti (formerly Ritabell AS), with mobile operations in Estonia, from Millicom. • In November 1999 Tele2 sold its shareholding (24.8%) in the associated company Netcom ASA, a mobile telephony company in Norway, to SEC in return for 17.8% in SEC. SEC gradually divested Netcom ASA during under 1999 and 2000. • In August 2000, via a limited share issue corresponding to SEK 19,773 million, Tele2 acquired an additional 81.9% of SEC, which pursues fixed telephony operations in continental Europe and mobile telephony operations in Luxembourg, etc., from Millicom. • During 2000 Tele2 divested its holding in 4T Solutions, with billing systems operations, to XSource Corporation in return for 11.88% of XSource Corporation. • In January 2001, Tele2 Group divested its 37.45% holding in the associated company Transcom Worldwide to Industriförvaltings AB Kinnevik. Transcom Worldwide is one of Europe’s largest customer service companies. The purchase price was based on the market share price 60 trading days after Transcom Worldwide was listed on the Stockholm Stock Exchange. • In December 2001, Tele2 Group acquired shares in Tele2 Russia Telecom BV from Millicom through a limited shares issue corresponding to a value of SEK 849 million. Tele2 Russia Group conducts mobile operations in Russia. Transactions in 2002: • In October 2002, the Tele2 Group acquired all shares in the ProcureITright Group, a supplier of procurement function services and WEB-based procurement systems, from XSource Corporation Group for SEK 42 million. Operational agreements between Tele2 and related parties: Tele2 supplies telephony and data services on commercial terms to closely related corporate groups. Invik Group: • Tele2 Group’s telephony operates are, with the exception of Russian operations, insured by Moderna Försäkringar AB. • Banque Invik conducts certain financial services for the Tele2 Group. Bankque Invik is also a credit supplier and conducts credit transactions that arise using the equipment of 3C-operations. Kinnevik Group: • CIS Credit International Service AB provides Tele2 with debt collection services. • Collect Sweden AB is a company that managed a fidelity program and provided multi-bonus cards and was also in charge of marketing and man- agement of benefit and offers within the framework of the Collect multi-bonus program. Collect is now being phased out. Transcom Worldwide Group: • Transcom provides customer services and telemarketing for Tele2. Millicom Group: • Millicom Group purchases certain consulting services from the Tele2 company ProcureITright. XSource Corporation Group: • Savera Systems Incorporated and its sister company Basset AB supplies Tele2 with operator billing systems. Savera also supplies Tango with an invoicing system for cash cards. • NetCom Consultants AB supplies Tele2 with consulting services in tele and data communications. MTG Group: • Tele2 buys advertising time on radio and TV channels owned by MTG. • Tele2 Sverige AB purchases cable TV programs from TV1000 Sverige AB. Other related companies: • Viking Telecom provides Tele2 with most of the line routers that Tele2 supplies to its end customers. 73
  • 76.
    Cont. note 35 Transactionsbetween Tele2 and related parties: Group Operating revenues Operating costs 2002 2001 2002 2001 Invik Group — 10 124 10 Kinnevik Group 11 1 132 387 Transcom Worldwide Group 23 20 1,860 2,031 Millicom Group 17 16 14 7 XSource Corporation Group 7 9 266 236 MTG, Modern Times Group 28 32 108 163 Metro International Group 3 2 4 5 Other related companies 5 1 102 140 Total 94 91 2,610 2,979 Group Interest revenue Interest costs 2002 2001 2002 2001 Invik Group 97 — 131 — Total 97 — 131 — Group Materials & supplies Restricted cash Dec. 31, 2002 Dec. 31, 2001 Dec. 31, 2002 Dec. 31, 2001 Invik Group — — 841 897 Kinnevik Group 1 — — — XSource Corporation Group — 2 — — MTG, Modern Times Group 7 — — — Other related companies 5 39 — — Total 13 41 841 897 Group Acc. receivable, etc. Other liabilities Dec. 31, 2002 Dec. 31, 2001 Dec. 31, 2002 Dec. 31, 2001 Invik Group — 1 — — Kinnevik Group 9 — — 78 Transcom Worldwide Group 2 6 — — Millicom Group 8 20 — 113 XSource Corporation Group 2 69 20 17 MTG, Modern Times Group 53 45 — — Other related companies 8 1 39 47 Total 82 142 59 255 Group Liabilities to suppliers, etc. Other liabilities Dec. 31, 2002 Dec. 31, 2001 Dec. 31, 2002 Dec. 31, 2001 Invik Group 124 11 755 881 Kinnevik Group 23 43 — — Transcom Worldwide Group 188 267 — — Millicom Group — 43 — — XSource Corporation Group 39 93 5 — MTG, Modern Times Group 17 27 — — Metro International Group 2 — — — Other related companies 63 98 23 30 Total 456 582 783 911 74 T E L E 2 A N N U A L R E P O R T 2002
  • 77.
    Note 36 Customers Operating area by market area: Group Number of customers Net customer intake (thousands) Dec. 31, 2002 Dec. 31, 2001 change 2002 2001 Nordic: Mobile telephony 3,221 2,642 22% 579 517 Fixed telephony and Internet 2,822 3,632 –22% –810 285 Cable-TV 209 — — 209 — Total, Nordic 6,252 6,274 0% –22 802 Eastern Europe and Russia: Mobile telephony 1,366 853 60% 513 576 Fixed telephony and Internet 144 77 87% 67 76 Cable-TV 64 66 –3% –2 66 Total, Eastern Europe and Russia 1,574 996 58% 578 718 Central Europe: Mobile telephony 271 48 465% 223 16 Fixed telephony and Internet 3,316 3,143 6% 173 473 Total, Central Europe 3,587 3,191 12% 396 489 Southern Europe: Fixed telephony and Internet 5,129 4,286 20% 843 1,344 Total, Southern Europe 5,129 4,286 20% 843 1,344 Luxembourg: Mobile telephony 181 167 8% 14 42 Fixed telephony and Internet 41 44 –7% –3 9 Total, Luxembourg 222 211 5% 11 51 Total, by market area 16,764 14,958 12% 1,806 3,404 Group Number of customers Net customer intake (thousands) Dec. 31, 2002 Dec. 31, 2001 change 2002 2001 Mobile telephony 5,039 3,710 36% 1,329 1,151 of which, cash cards 3,363 2,179 54% 1,184 — Fixed telephony and Internet 11,452 11,182 2% 270 2,187 Cable-TV 273 66 314% 207 66 Total, by business area 16,764 14,958 12% 1,806 3,404 Effective 2002, the number of active customers in Sweden and Denmark complies fully with the Group’s definition of an active customer. As a result of this adjustment and the effect of the merger with Optimal Telecom, the number of customers in Sweden for fixed telephony and Internet has been aligned by a one-off adjustment of –197,000 and the number of mobile telephony customers has been adjusted by +80,000. In addition, the num- ber of Cable-TV customers was reported for the first time in 2002, which has resulted in an adjustment of +189,000. In the case of Denmark, a one- off adjustment has been applied to fixed telephony and Internet during 2002 in an amount of –461,000. During 2001, the acquisition of Tele2 Russia and the Levicom Group meant that the number of customers rose by a total of 296,000. Net customer intake in 2002, before the above one-off adjustment, amounted to 15%, corresponding to 2,195,000 (2001: 3,108,000) customers. 75
  • 78.
    Note 37 Number of employees Group 2002 2001 Average number of employees Total of whom, men Total of whom, men Nordic 1,169 70% 1,126 70% Eastern Europe and Russia 1,456 52% 602 49% Central Europe 116 59% 122 61% Southern Europe 95 65% 81 65% Luxembourg 231 68% 189 83% Branded products & services 48 83% 52 73% Total, by market 3,115 61% 2,172 65% The average number of employees in the Parent Company is 3 (2001: 2), all of whom are men. The average number of employees for each year for acquired companies is reported in relation to the period of time they have been part of the Tele2 Group. Tele2 Russia was acquired in December 2001. Note 38 Personnel costs Group 2002 2001 Salaries and Social security of which, pen- Salaries and Social security of which, pen- remuneration expenses sion expenses remuneration expenses sion expenses Board and President 67 20 5 52 13 3 Other employees 995 303 59 870 254 50 Total, personnel costs 1,062 323 64 922 267 53 Parent Company 2002 2001 Salaries and Social security of which, pen- Salaries and Social security of which, pen- remuneration expenses sion expenses remuneration expenses sion expenses Board and President 13 6 1 11 4 2 Other employees 4 1 1 2 1 — Total, personnel costs 17 7 2 13 5 2 Salaries and remuneration for each year for acquired companies is reported in relation to the period they have been part of the Tele2 Group. Tele2 Russia was acquired in December 2001. Note 37 shows the workforce. Pension expenses Group Parent Company 2002 2001 2002 2001 Defined-benefit pension plans 20 4 — — Defined-contribution pension plans 44 49 2 2 Total, pension expenses 64 53 2 2 In the case of defined-benefit plans, the company assumes the risk and responsibility on the pension payout date. In the case of defined-contribu- tion plans, the company is not exposed to risk on the pension payout date. Group 2002 2001 Salaries and remuneration Salaries and remuneration Board of which, Other Board of which, Other and President bonuses employees and President bonuses employees Nordic 27 3 573 22 2 539 Eastern Europe and Russia 21 2 150 5 — 78 Central Europe 7 1 73 6 — 63 Southern Europe 4 1 54 3 1 50 Luxembourg 1 — 112 9 — 104 Branded products & services 7 1 33 7 1 36 Total, by market 67 8 995 52 4 870 In 2002, provision of SEK 16 million ( 2001: SEK 15 million) was made for bonuses to key personnel in the Group, plus social security expenses of SEK 5 million (2001: SEK 5 million). Distribution of the amount will be decided in 2003. 76 T E L E 2 A N N U A L R E P O R T 2002
  • 79.
    Cont. note 38 Remunerationof senior executives: The group “Other senior executives” consists of 13 people (2001: 13). In addition to the costs below, Tele2 also incurred costs relating to social security expenses. 2002 Basic salary/ Variable Options Other Other Pension Total Board fee remuneration program benefits remuneration costs remuneration Chairman of the Board: Jan Hugo Stenbeck 0.1 6.8 6.9 Bruce Grant 0.2 — 0.2 Group President and CEO: Lars-Johan Jarnheimer 10.0 1.5 1.0 0.0 — 1.9 14.4 Other senior executives 21.8 10.3 13.5 1.3 — 1.3 48.2 32.1 11.8 14.5 1.3 6.8 3.2 69.7 2002 Previous years Allocation for the year Total Options program Warrant program 2002/2005 Market value on Acquisition Number Number issuance price Benefit Number Group President and CEO — 15,000 pcs 1.0 — 1.0 15,000 pcs Other senior executives — 195,000 pcs 13.5 — 13.5 195,000 pcs — 210,000 pcs 14.5 — 14.5 210,000 pcs 2001 Basic salary/ Variable Warrant Other Other Pension Total Board fee remuneration program benefits remuneration costs remuneration Chairman of the Board: Jan Hugo Stenbeck 0.3 — 0.3 Group President and CEO: Lars-Johan Jarnheimer 7.6 1.6 — 0.0 — 1.3 10.5 Other senior executives 18.9 10.4 — 1.1 — 1.0 31.4 26.8 12.0 — 1.1 — 2.3 42.2 Board of Directors: Board chairman Jan Hugo Stenbeck passed away during the year and Board member Bruce Grant was appointed Chairman in August. Total Board fees of SEK 1.9 million were paid compared with SEK 2.1 million decided of the Annual General Meeting of shareholders. During the year, the parent company paid SEK 6.8 million to acompany owned by Jan Hugo Stenbeck, for consultations regarding services that can- not be regarded as Board work. In addition Tele2 Group paid SEK 8.7 million (2001: SEK 17.3 million) to a company partly owned by Bruce Grant, for consultations regarding services that cannot be regarded as Board work. President and CEO: In addition to a fixed salary, Lars-Johan Jarnheimer, President and CEO of Tele2, received a bonus of SEK 1.5 million (2001: SEK 1.6 million). The bonus is based on individualized goals. The pension premium, which is defined-contribution, is paid in the form of 20% of the fixed basic salary. The pension age is 65. The period of notice when served by the company is a minimum 12 and maximum 18 months in the case of the President of Tele2 AB. Salary during a period of notification of 12 months is paid to the President if he serves notice of termination of employment to the com- pany. Salary and remuneration for the President are determined annually by the Board of Directors following proposals by the Chairman of the Board. Other senior executives Variable salary paid to other senior executives includes a bonus of 0% –35% based on profit benchmarks, with the remainder being based on indi- vidualized goals. Other benefits pertain primarily to car benefits. Pensions are paid in accordance with the public pension plan, of which SEK 1.1 million (2001: SEK 0.2 million) represents a defined-contribution plan and SEK 0.2 million (2001. SEK 0, 2 million) is a defined-benefit plan. The pension age is 65. The period of notice when served by the company is a minimum 6 and maximum 12 months. Salary during a period of notifica- tion of six months is received if the person serves notice of termination of employment to the company. Not other remuneration is paid. 77
  • 80.
    Cont. note 38 Incentiveprogram 1997–2006 At the Annual General Meeting in 1997, it was decided to undertake an incentive program for a number of the senior executives employed at that time and future senior executives in the Group. Through a company established for this purpose, NC Intressenter AB, these persons were provided with the opportunity to acquire 100,000 shares per year during 1999–2003, up to a maximum total amount of 500,000 Series B shares. In October 2000, 200,000 shares were issued and three convertible-debenture notes corresponding to 300,000 shares were issued to NC Intressenter to ful- fill the offer. At December 31, 2002, NC Intressenter held 400,000 Series B shares and a convertible debenture note corresponding to 100,000 Series B shares. The premium for the option amounted to SEK 7 million in 1997. This was based on a Black-Schole evaluation and an exercise price of SEK 150 per share. In their turn, all partners in NC Intressenter made payments to NC Intressenter based on the Black-Schole evaluations. On December 31, 2002, Invik & Co AB owned 42% of the shares in NC Intressenter. Invik & Co AB is not entitled to sell or transfer these shares without the permission of Tele2 AB. Incentive Program 2002–2007 At the Annual General Meeting in 2002, it was decided to undertake an incentive program corresponding to a maximum of 1,055,000 for current and future key employees of the Group. These persons are to be offered the opportunity, via warrants, to subscribe for Series B shares during a period of three to five years after allotment, at a price totaling the market value of the Series B share plus 10% at the time of allotment, on condition that they remain employed by the Group. No premium is to be paid. At December 31, 2002, allotments corresponding to 663,000 shares had been imple- mented. All of these had a redemption price of SEK 191. In addition, allotments corresponding to 153,700 shares had been made to a wholly owned Group company to secure the future cash flow for social insurance costs. Note 39 Auditors Group Parent Company 2002 2001 2002 2001 Other Other Other Other PWC auditors PWC auditors PWC auditors PWC auditors Audit assignments* 17 4 18 1 1 — 1 — Other assignments 13 4 13 3 6 — 8 2 30 8 31 4 7 — 9 2 Total 38 35 7 11 * Auditing assignments = examination of the annual report and the accounts as well as the administration by the Board and the President. All other is other assignments. 78 T E L E 2 A N N U A L R E P O R T 2002
  • 81.
    Note 40 The United States generally accepted accounting principles (US GAAP) The consolidated balance sheets and income statements are drawn up in accordance with Swedish accounting principles. These differ in certain respects from generally accepted accounting principles in the United States (US GAAP). The following adjustments are required for reporting profit/loss for the year and shareholders' equity in line with US GAAP. Profit/loss for the year: Group 2002 2001 2000 Profit/loss for the year according to Swedish accounting principles: 223 392 –396 Adjustments required for compliance with US GAAP. a) Transactions between companies under common control 9 21 24 b) Amortization of goodwill 1,512 — — c) Lease agreements 1 2 3 d) Tangible fixed assets –81 9 31 e) Stock options 9 5 –196 f) Software development cost — — 80 g) Accounting for step acquisitions — –8 –317 h) Accounting for acquisitions 25 –367 –104 i) Deferred tax liability — 828 — j) Alecta refund — — –8 k) Changes in accounting principles — –156 21 l) Hedge accounting 1 –2 — Net adjustment 1,476 332 –466 Deferred tax effect on above, US GAAP adjustments –7 39 –38 Profit/loss for the year according to US GAAP 1,692 763 –900 Earnings per share: Group 2002 2001 2000 Profit/loss or the year according to US GAAP 1,692 763 –900 Number of shares, weighted average 147,360,175 145,003,847 114,087,366 Earnings per share SEK 11.48 SEK 5.26 SEK –7.89 Profit/loss or the year according to US GAAP 1,692 763 –900 Reversal: interest after tax on convertibles during the year — — — Adjusted earnings for the year after full dilution 1,692 763 –900 Number of outstanding shares after full dilution, weighted average* 147,596,866 145,215,999 114,087,366 Earnings per share after full dilution SEK 11.46 SEK 5.25 SEK –7.89 * In contrast to Swedish accounting principles, US GAAP does not calculate earnings per share after dilution at the present value of the exercise price for the options. Adjusted profit/loss for the year: Group 2002 2001 2000 Profit/loss for the year according to US GAAP 1,692 763 –900 Reversal: amortization of goodwill — 1,845 610 Adjusted profit/loss for the year according to US GAAP 1,692 2,608 –290 79
  • 82.
    Cont. note 40 Adjustedearnings per share: Group 2002 2001 2000 Profit/loss or the year according to US GAAP 1,692 763 –900 Reversal: amortization of goodwill — 1,845 610 Adjusted earnings for the year 1,692 2,608 –290 Number of shares, weighted average 147,360,175 145,003,847 114,087,366 Adjusted earnings per share SEK 11.48 SEK 17.99 SEK –2.54 Profit/loss or the year according to US GAAP 1,692 763 –900 Reversal: interest after tax on convertibles during the year — — — Reversal: amortization of goodwill — 1,845 610 Adjusted earnings for the year after full dilution 1,692 2,608 –290 Number of outstanding shares after full dilution, weighted average* 147,596,866 145,215,999 114,087,366 Adjusted earnings per share after full dilution SEK 11.46 SEK 17.96 SEK –2.54 * In contrast to Swedish accounting principles, US GAAP does not calculate earnings per share after dilution at the present value of the exercise price for the options. Shareholders' equity: Group Dec. 31, 2002 Dec. 31, 2001 Dec. 31, 2000 Shareholders' equity according to Swedish accounting principles 28,728 29,517 26,539 Adjustments required for compliance with US GAAP: a) Transactions between companies under common control –18 –27 –47 b) Amortization of goodwill 1,512 — — c) Lease agreements 14 13 11 d) Tangible fixed assets –21 60 51 e) Stock options –4 –25 –30 g) Accounting for step acquisitions –103 –102 –94 h) Accounting for acquisitions 6,500 6,630 6,592 i) Deferred tax liability — — –828 j) Alecta refund 2 –7 –7 k) Changes in accounting principles — — 156 l) Hedge accounting — –2 — Net adjustment 7,882 6,540 5,804 Deferred tax effect on above US GAAP adjustments –32 –16 –54 Shareholders' equity according to US GAAP 36,578 36,041 32,289 Change in shareholders' equity: Group Dec. 31, 2002 Dec. 31, 2001 Dec. 31, 2000 Opening shareholders' equity, Jan. 1, according to US GAAP 36,041 32,289 5,772 Items reported directly against shareholders' equity Gradual acquisitions — –8 –33 Exchange-rate difference, according to US GAAP –1,181 2,144 785 Total items reported directly against shareholders' equity –1,181 2,136 752 Other changes in shareholders' equity New share issue, acquisition of SEC according to US GAAP — — 26,628 New share issue, acquisition of Tele2 Russia, according to US GAAP — 838 — New share issue, convertibles, according to US GAAP 26 15 37 Profit/loss for the year, according to US GAAP 1,692 763 –900 Closing shareholders' equity, Dec. 31, according to US GAAP 36,578 36,041 32,289 80 T E L E 2 A N N U A L R E P O R T 2002
  • 83.
    Cont. note 40 Deferredtax liability/asset: Group 2002 2001 Deferred tax liability/asset, according to Swedish acc. principles 1,246 1,764 Deferred tax, adjustment according to US GAAP –32 –16 Total deferred tax liability (–)/asset (+) according to US GAAP 1,214 1,748 Extract from consolidated balance sheet: Group Swedish accounting principles Adjustment items US GAAP Dec. 31, 2002 Dec. 31, 2001 Dec. 31, 2002 Dec. 31, 2001 Dec. 31, 2002 Dec. 31, 2001 Fixed assets 36,373 39,692 7,952 6,612 44,325 46,304 Current assets 10,499 9,566 — — 10,499 9,566 Total assets 46,872 49,258 7,952 6,612 54,824 55,870 Shareholders' equity 28,728 29,517 7,850 6,524 36,578 36,041 Minority interest 22 28 — — 22 28 Long-term liabilities 7,927 11,082 97 80 8,024 11,162 Current liabilities 10,195 8,631 5 8 10,200 8,639 Total shareholders' equity and liabilities 46,872 49,258 7,952 6,612 54,824 55,870 Explanation of current differences between Swedish accounting principles and US GAAP: The account below presents a description of the adjustments that must be made to report Tele2 Group’s profit/loss for 2000, 2001 and 2002 and shareholders’ equity as of December 31, 2000, 2001 and 2002 in accordance with US GAAP. a) Transactions between companies under common control In 1993 and 1994, the company acquired Tele2 and Comviq from the Industriförvaltnings AB Kinnevik Group. The acquisition method was used to report the transactions. Accordingly, the difference between the acquisition value and market value of net assets was reported as goodwill. According to US GAAP, acquisitions of operations from “jointly owned companies” should be conducted at historical values. Thus, as a US GAAP adjustment, all re-evaluations of plants, materials and supplies, goodwill, etc. that arise on the transaction date are eliminated and the resulting depreciation/amortization is reversed. b) Amortization of goodwill According to Swedish accounting principles, all intangible fixed assets, including goodwill, must be amortized. Amortization rates are based on the acquisition value of the fixed assets and the estimated utilization period. According to US GAAP, effective 2002, goodwill and certain other intangible assets need not be amortized but may instead be tested, at least annually, to identify any impairment loss. Accordingly, this year’s amort- ization of these assets under Swedish GAAP is reversed and instead a potential write-down based on the completed impairment test is recognized. c) Lease agreements The Group has certain leasing transactions which, according to generally accepted accounting principles in Sweden, have been treated as operat- ing leases, but which, according to US GAAP, are viewed as finance leases. d) Tangible fixed assets Certain costs have been capitalized in accordance with Swedish accounting principles should be expensed according to US GAAP. According to US GAAP, certain costs attributable to installations of networks are capitalized and not expensed. e) Stock options According to US GAAP, as a result of the terms and conditions of the options programs in 1997, a liability is calculated based on the market value of the underlying shares. According to US GAAP, the commitments to employees should not be dissolved. Commitments to others should be val- ued at the value of the option on the date on which the decision was made to settle it through a new share issue and report it directly against shareholders’ equity. f) Software development cost Through 1999, Tele2 has capitalized development costs for software for external sales. According to US GAAP, this should be expensed and depre- ciation attributable to capitalization be reversed until the product is technically finalized. As a result of the sale of 4T Solutions AB in 2000, there is currently no difference vis-a-vis US GAAP. 81
  • 84.
    Cont. note 40 g)Accounting for step acquisitions The gradual acquisitions of OU Levicom and Société Européene de Communications S.A. during 1999–2001 has, according to Swedish account- ing principles, resulted in a restatement of adjustment of shareholders’ equity corresponding to shares in profit of the holdings from the original acquisition date based on the equity method rather than historical acquisition values. According to US GAAP, not only should shareholders’ equity be adjusted against the share in profit/loss but also goodwill and depreciation should be taken into account from the original acquisition date. h) Accounting for acquisitions The acquisition of Société Européene de Communications S.A. in 2000 was conducted via a non-cash share issue, in which newly issued shares in Tele2 were offered in exchange for the outstanding shares in Société Européene de Communications S.A. According to Swedish accounting prin- ciples, the acquisition price is calculated at a value corresponding to the share price of Tele2 on the transaction date. According to US GAAP, the acquisition price should be set at the share price on the date at which the offer was announced. There are also certain differences between acquired net assets according to US GAAP and Swedish accounting principles. i) Deferred tax liability According to US GAAP, deferred taxes should be reported for all temporary differences apart from certain exceptions. The reversal of deferred tax liabilities as a result of changes in circumstances is done restrictively. According to Swedish accounting principles, changes in circumstances can be taken into account in the assessment. In conjunction with the liquidation of Société Européene de Communications S.A. in 2001, there was no longer any differences vis-a-vis US GAAP. j) Alecta refund According to Swedish accounting principles, the value of the refund received by Tele2 from Alecta should be reported via the income statement in 2000. According to US GAAP, only the cash portion received should be reported as income. k) Changes in accounting principles According to Swedish accounting principles, changes in accounting principles are reported through a recalculation of the opening shareholders’ equity as if the new principles had been applied already when the transaction arose. According to US GAAP, the change is reported across the income statement when changes in principles are made. l) Hedge accounting According to US GAAP, to qualify a hedge for accounting purposes, the hedge has to comply with very strict criteria in terms of the documenta- tion of hedge relationship with hedged item and proof of its effectiveness. Swedish accounting principles does not require compliance with this strict criteria. Effective 2002, these requirements are fulfilled and thus there is no difference vis-à-vis US GAAP. Stock options: In accordance with Swedish accounting principles, the option liability for the 1997 incentive program was dissolved in its entirety in 2000 as a result of the decision to settle the option through an issue of convertibles. According to US GAAP, depending on the conditions of the option program, a liability should be calculated based on the difference between the market value of the underlying shares and the exercise price. During 2002, stock options were issued as part of a new incentive program. This program is not reported as an expense in the income statement. A valuation in accor- dance with the Black-Scholes option model would have the following effect on profit/loss according to US GAAP. The calculation is based on a risk- free rate of interest of 4.7% (2001: 5.0%), no dividend (due to the uncertainty as to whether or not the Board will propose a dividend), volatility of 57.9% (2001: 45.5%) and the fact that the options expire on April 20, 2003 and September 1, 2005. Group 2002 2001 2000 Profit/loss for the year, reported as above 1,692 763 –900 Adjusted earnings per share after full dilution SEK 11.46 SEK 5.25 SEK –7.89 Profit/loss for the year, pro forma 1,687 760 –904 Adjusted earnings per share after full dilution SEK 11.43 SEK 5.23 SEK –7.92 Advertising expenses: Total advertising expenses for the year amount to SEK 979 million (2001: 1,031 million and 2000: 630 million). Critical accounting principles according to US GAAP: The presentation below shows the accounting principles that are based on the most cricital assessments and estimates used in drawing up the accounts in line with US GAAP, and which differ from the preparation of financial reports in accordance with Swedish accounting principles: • When assessing the need for future write-down requirements for intangible and tangible fixed assets, Swedish accounting principles indicate that a future discounted cash flow be calculated and compared with the book value. Swedish accounting principles stipulate the application of sched- ule amortization of goodwill. In contrast, according to US GAAP, a non-discounted cash flow is to be calculated. No further amortization of good- will should be applied according to US GAAP as of 2002. 82 T E L E 2 A N N U A L R E P O R T 2002
  • 85.
    Effects of newUS GAAP accounting pronouncements: In June 2001, the Financial Accounting Standards Board (FASB) issued a Statement of Financial Accounting Standards No. 143 (SFAS 143), enti- tled ”Accounting for Asset Retirement Obligations”. SFAS 143 states when and how accounting for liabilities and expenses attributable to the retire- ment o fixed assets should be done. Tele2 will apply SFAS 143 as of January 1 2003. The application of this statement is not expected to have any significant effect on Tele2's earnings and financial position. In November 2002 FASB issued FASB Interpretation No. 45 (FIN 45), “Guarantor’s Accounting and Disclosure Requirements for Guarantees, Including Indirect Guarantees of Indebtedness of Others.” FIN 45 requires that a liability should be reported at the fair value of assumed commit- ments in accordance with certain guarantee agreements on the date on which a company issued a guarantee. The provisions shall be applied with effect for guarantees that were issued or changed after December 31, 2002. Stockholm, February 24, 2003 Bruce Grant Chairman Lars-Johan Jarnheimer Marc Beuls President and CEO Vigo Carlund Sven Hagströmer Håkan Ledin Pelle Törnberg Lars Wohlin Our auditors’ report was submitted on March 3, 2003 Pål Wingren Carl Lindgren Authorized Public Accountant Authorized Public Accountant 83
  • 86.
    Audit report To theAnnual General Meeting of the shareholders in Tele2 AB (publ) Corporate registration number 556410-8917 We have audited the annual accounts, the consolidated financial statements, accounting records and the adminis- tration of the Board of Directors and the President of Tele2 AB (publ) for the 2002 financial year. These accounts and the administration of the Company are the responsibility of the Board of Directors and the President. Our respon- sibility is to express an opinion on the annual accounts, consolidated financial statements and the administration based on our audit. We conducted our audit in accordance with generally accepted auditing standards in Sweden. Those standards require that we plan and perform the audit to obtain reasonable assurance that the annual accounts and the con- solidated financial statements are free of material misstatement. An audit includes examining, on a test basis, evi- dence supporting the amounts and disclosures in the accounts. An audit also includes assessing the accounting principles used and their application by the Board of Directors and the President, as well as evaluating the overall presentation of information in the annual accounts and consolidated financial statements. To support our opinion in regard to freedom from liability, we have examined significant decisions, actions taken and circumstances of the Company in order to determine the liability, if any, to the Company of any Board member, or the President. We have also conducted examinations to establish whether any Board member or the President has in any other way acted in contravention of the Swedish Companies Act, the Annual Accounts Act, or the Company’s Articles of Association. We believe that our audit provides a reasonable basis for our opinion set out below. The annual accounts and consolidated financial statements have been prepared in accordance with the Annual Accounts Act and thus provide a true and fair picture of both the Company’s and the Group’s earnings and position in accordance with generally accepted auditing standards in Sweden. We recommend that the Annual General Meeting adopt the Income Statements and Balance Sheets of the Parent Company and the Group, that the profit in the Parent Company be dealt with in accordance with the proposal in the Board of Directors’ Report, and that the members of the Board and the President be discharged from liability for the financial year. Stockholm, March 3, 2003 Pål Wingren Carl Lindgren Authorized Public Accountant Authorized Public Accountant 84 T E L E 2 A N N U A L R E P O R T 2002
  • 87.
    Personnel and environment Strictenvironmental requirements Tele2’s operations have only a limited mentally sound manner and purchasing standards, but that it keeps abreast of impact on the environment. The company decisions must take the environment into research in Sweden and abroad. The Group has drawn up an environmental policy that consideration. Tele2 is particularly con- is an active participant in public discus- permeates all operations. The policy insists scious of environmental safety issues when sions about health, safety and the envir- that environmentally approved products be it comes to mobile telephony. It is of the onment. used. Office waste and other scrapped utmost importance that Tele2 does not materials should be treated in an environ- only comply with prevailing environmental Personnel and skills development Tele2 pursues an ongoing skills develop- A number of new college graduates are The Group had an average of 3,115 ment effort to ensure that its employees chosen for a trainee program each year. employees in 2002, compared with 2,172 possess the kind of know-how that will The program is primarily devoted to on-the- in 2001. Tele2 is active in 22 European enable us to keep pace with the evolution job training in various parts of the organi- countries. of the market and the needs of customers. zation and abroad. There is also a 12- All new employees complete a basic course month, multi-phase leadership project for that covers Tele2’s operations, goals, prin- the Group’s managers. ciples, and quality assurance objectives. 85
  • 88.
    Board of Directors Fromleft: Marc J. A. Beuls, Vigo Carlund, Lars-Johan Jarnheimer, Pelle Törnberg, Håkan Ledin, Lars Wohlin and Bruce Grant. Marc J. A. Beuls Pelle Törnberg Bruce Grant (Born 1956) holds a B.Sc. in Economics. He has (Born 1956) President of Metro International since Chairman of the Board been with Millicom International Cellular S.A. since 2000. In 1987, he started the TV production com- (Born 1959) Chairman and Managing Partner of 1992 and has been President & CEO since January pany Strix. From 1993, he was responsible for all Applied Value LLC. Member of the Board of Industri- 1998. In 1997 he was appointed President of media companies in what was formerly Kinnevik, förvaltnings AB Kinnevik, Korsnäs AB, Metro and Banque Invik S.A. in Luxembourg. Marc Beuls pre- currently MTG. Chairman of the Board of MTG and Transcom. viously held executive positions at Generale Bank in P4 Radio Hele Norge. Member of the Board of Invik, Belgium. He has been member of the Board of Tele2 MediaCorp and Millicom. Member of the Board of Sven Hagströmer since 1998. Tele2 since 2001. (Born 1943) President and Board Chairman of Holding: 4,100 B shares. Hagströmer & Qviberg from start in 1980 to 1995. Vigo Carlund Board Chairman of Investment AB Öresund, AB (Born 1946) has worked for Kinnevik companies Håkan Ledin Custos and since 2001 also Acando. Member of the since 1968. He is President of Industriförvaltnings (Born 1937) MSc Eng and MSc Econ. Worked many Board of LGP Telecom Holding AB, Avanza AB and AB Kinnevik. Chairman of the Board of Transcom years at Ericcson prior to becoming President of HQ Fonder. Member of the Board of Tele2 since WW and Korsnäs. Member of the Board of Millicom, Millicom in 1987, where he serves as Board 1997. Metro and Viking Telecom. Member of the Board of Chairman as of 2002. He served as President of Holding: 130,000 B shares. Tele2 since 1995. NetCom Systems in 1995–1996. Member of the Holding: 379 B shares Board of Tele2 since 1994. Holding: 30,000 B shares. Lars-Johan Jarnheimer President and CEO (not a member of the Board). Lars Wohlin (Born 1960) MBA. President and CEO of Tele2 AB (Born 1933) PhD Econ. Head of the Industry since March 1999. Mr. Jarnheimer has held various Research Institute 1973–1976, Undersecretary in positions at IKEA, Hennes & Mauritz and SARA Finance Ministry 1976–1979 and Governor of the Hotels, and was President of ZTV for a short time Central Bank 1979–1982. Served as President of before coming to Comviq as Vice President in 1992. Stadshypotek 1983–1996. Board Chairman of the President of Comviq during 1993–97. Member of Drott real-estate company since 1998. Member of Group management at Saab Automobiles with the Board of Tele2 since 1996. responsibility for the Nordic countries, Russia and Holding: 1,100 B shares. the Baltic States, and was President of Saab Opel Sverige AB during 1997–98. Board assignments: MTG, Arvid Nordquist Handelsaktiebolag, Millicom and Invik AB. Holding: 52,000 B shares and 15,000 options. 86 T E L E 2 A N N U A L R E P O R T 2002
  • 89.
    Senior Executives Lars-Johan Jarnheimer Håkan Zadler Fredrik Berglund Johnny Svedberg Born 1960 Born 1960 Born 1961 Born 1962 President and CEO of Tele2 AB CFO Market Area Director, Nordic Market Area Director, Eastern Europe M.B.A M.B.A President, Tele2 Sverige AB and Russia Employed since 1992 Employed since 2000 BSc in market economics BSc in market economics Holding: 2,000 B shares Holding: 5,000 B shares Employed since 1995 Employed since 1990 and 15,000 options*. and 15,000 options* Holding: 15,000 options* Holding: 1 A-share, 1,240 B shares Holdings through companies**: Holdings through companies**: and 15,000 options* 50,000 B shares 30,000 B shares Holdings through companies**: 8,000 B shares Roman Schwarz Jean-Louis Constanza Jean-Claude Bintz Jeanette Almberg Born 1947 Born 1961 Born 1956 Born 1965 Market Area Director, Central Europe Market Area Director, Southern Europe Market Area Director, Luxembourg Customer Service Director President, Tele2 Switzerland President, Tele2 France Employed since 1989 M.B.A M.B.A M.B.A Holding: 15,000 options* Employed since 1995 Employed since 1991 Employed since 1998 Holding: 15,000 options* Holding: 15,000 options* Holding: 15,000 options* Holdings through companies**: 1,500 B shares Björn Lundström Ib Andersen Roger Mobrin Anders Olsson Born 1965 Born 1955 Born 1968 Born 1969 Network Planning and Network Operations Director Billing Operations and Market Area Director, Branded products Implementation Director M.B.A Coordination Director & services, Marketing coordinator and MSc Engineering Employed since 2000 Technical college engineer President, Tele2 Germany Employed since 1991 Holding: 15,000 options* Employed since 1995 MBA Holding: 15,000 options* Holding: 50 B shares and Employed since 1997 Holdings through companies**: 15,000 options* Holding: 1,056 B shares 1,500 B shares Holdings through companies**: and 15,000 options* 1,500 B shares Karl-Johan Nybell Lars-Erik Svegander Born 1968 Born 1941 *relates to incentive program 2002/2007, see Note 38 Product Management Director Personnel Director ** relates to incentive program 1997/2006, see Note 38 MSc Engineering Employed since 1991 Employed since 1995 Holding 15,000 options* Holding: 15,000 options* Holdings through companies**: 87 Holdings through companies**: 1,500 B shares 1,000 B shares
  • 90.
    The Tele2 share Numberof shares responding to 6,700,000 B shares, thus and a convertible debenture with detach- Tele2’s A and B series shares were listed on increasing Tele2’s shareholders’ equity by able warrants corresponding to 100,000 B the O-List of Stockholmsbörsen (Stockholm SEK 335 M. shares. Exchange) on May 14, 1996 in conjunction During the second quarter of 1998, all Series A shares carry 10 votes, while B with the distribution of the Company to the outstanding debentures were converted into shares carry one vote. shareholders of Industriförvaltnings AB 755,555 B shares. Kinnevik. Following the distribution, At the Annual General Meeting in May Ownership structure Kinnevik owned no shares in Tele2 but held 2000, the Board of Directors was authorized At year-end 2002, Tele2 had about 61,000 a convertible debenture corresponding to to settle an option commitment through a shareholders, compared with about 64,000 25,555,555 shares. During 1996, new share issue. In October 2000, 200,000 one year earlier. The proportion of institu- Kinnevik sold portions of the debenture, new B series shares were issued, as well as tional owners corresponded to about 88% after conversion to shares, to institutions three convertible debentures with detach- of the share capital and about 92% of the and Invik & Co. AB. able warrants with rights to new subscrip- voting rights on December 31, 2002. To promote interest in the Company’s tion of a total of 300,000 B shares. share in the US and to increase its liquid- At an Extraordinary General Meeting of Analysts who followed Tele2 during 2002 ity, the Tele2 share was listed on the Nasdaq Tele2 AB on August 25, 2000, a proposal ABG Securities Henrik Wikström exchange in the US on January 22, 1997. was approved to issue at most 40,901,585 Alfred Berg Lena Glader A few months later, a new issue of two mil- series A and series B shares in Tele2 to Carnegie Fredrik Danielsson lion B shares was implemented. With this shareholders and holders of depository EVLI Matti Riikonen issue, Tele2 sought to broaden the receipts in Société Européenne de Enskilda Securities Per Trygg Company’s international ownership interest Communication S.A. (SEC) in exchange for Hagströmer & Qviberg Johan Broström and to support the Nasdaq listing. The pro- shares and depository receipts in SEC. By Handelsbanken Peter Warleus ceeds for the share issue, which amounted the end of the issue period, a total of HSBC Securities Viking Kjellström to SEK 220 M, were primarily used for ongo- 40,784,480 shares had been issued. Julius Baer Lena Hansson ing investment requirements, in particular At the end of 2001, all shares in FORA JP Nordiska Fondk. Håkan Persson for the development of Tele2’s Danish and Telecom B.V. were acquired in exchange for Öhman Fondkomm. Stefan Billing Norwegian operations. 2,461,449 newly issued Tele2 B shares. In Swedbank Henrik Sandell In conjunction with the new issue, 2001, 100,000 B shares were newly sub- UBS Warburg Jeremy Taylor Industriförvaltnings AB Kinnevik sold the scribed. During 2002, 100,000 shares Schroder Salomon major portion of its remaining convertible were newly subscribed, which was submit- Smith Barney Christian Kern debenture in Tele2 after conversion to ted to PRV, the Swedish Patent and 6,000,000 B shares. Registration Office, for registration. By the end of the first half of 1997, Invik As of December 31, 2002 there were a & Co. AB had converted its debenture, cor- total of 147,360,175 shares in Tele2 AB Ownership structure, December 31, 2002 Current ownership structure Share of Share of A shares B shares A+B shares No. of votes capital, % votes, % Invik & Co AB 9,891,787 2,825,579 12,717,366 101,743,449 8.6 29.7 Industriförvaltnings AB Kinnevik 6,498,880 24,611,021 31,109,901 89,599,821 21.1 26.1 Emesco 3,205,379 75,100 3,280,479 32,128,890 2.2 9.4 Millicom International Cellular S.A. 0 10,012,543 10,012,543 10,012,543 6.8 2.9 Stenbeck, Jan (Estate) 914,157 0 914,157 9,141,570 0.6 2.7 SEB 0 9,067,781 9,067,781 9,067,781 6.1 2.6 Nordea 834 6,720,828 6,721,662 6,729,168 4.6 2.0 Swedish Fourth Pension Fond 0 5,251,500 5,251,500 5,251,500 3.6 1.5 ROBUR 0 5,037,730 5,037,730 5,037,730 3.4 1.5 AMF Pension 0 4,218,000 4,218,000 4,218,000 2.9 1.2 Total, ten largest shareholders 20,511,037 67,820,082 88,331,119 272,930,452 59.9 79.6 Other shareholders 1,178,767 57,950,289 59,129,056 69,737,959 40.1 20.4 Total 21,689,804 125,770,371 147,460,175 342,668,411 100.0 100.0 88 T E L E 2 A N N U A L R E P O R T 2002
  • 91.
    Share trend ofStockholmsbörsen Tele2’s closing price each week AFGX Share turnover 000s (incl. off-floor trading) 900 800 700 600 500 400 300 30,000 25,000 200 20,000 15,000 100 10,000 5,000 60 96 97 98 99 00 01 02 03 Share trend on Nasdaq Tele2’s closing price each month, USD Nasdaq composite index Share turnover 000s (incl. off-floor trading) 100 90 80 70 60 50 40 900 800 30 700 600 500 20 400 300 200 100 10 97 98 99 00 01 02 03 89
  • 92.
    Addresses Tele2 AB Norge Eastern Europe Skeppsbron 18 Box 2094 Tele2 Norge AS and Russia Ulvenveien 75A SE-103 13 Stockholm, Sweden NO-0581 Oslo, Norway Estonia Phone: +46 8 5620 0060 Tele2 Eesti AS Phone: +47 21 31 90 00 Fax: +46 8 5620 0040 Joe 2a, Fax: +47 21 31 91 00 EE-10151 Tallinn, Estonia Investor Relations Datametrix AS Phone: +372 6888 866 30 St James’ Square Grenseveien 95 Fax: +372 6866 877 GB-SW1Y 4JH, London, England NO-0663 Oslo, Norway Phone: +44 20 7321 5010 Phone: +47 23 03 59 00 Latvia Fax: +44 20 7321 5020 Fax: +47 23 03 59 01 SIA Tele2 Kurzemes Prospectus 13 Nordic Danmark Riga LV-1067, Latvia Sweden Tele2 A/S Phone: +371 960 99 99 Gammel Køge Landevej 55 Fax: +371 709 01 76 Tele2 Sverige AB Borgarfjordsgatan 16 DK-2500 Valby, Denmark Box 62 Phone: +45 77 30 10 01 Lithuania SE-164 94 Kista, Sweden Fax: +45 77 30 10 00 UAB Tele2 Phone: +46 8 5626 4000 Sporto g. 7a Fax: +46 8 5626 4200 Datametrix A/S LT-20 51 Vilnius, Lithuania Customer Service Private: Gammel Køge Landevej 55-57 Phone: +370 2 366 300 0200-25 25 25 (Internet) DK-2500 Valby, Denmark Fax: +370 2 366 301 0200-25 25 25 (fixed telephony) Phone: +45 77 30 10 60 0200-22 20 40 (mobile telephony) Fax: +45 77 30 10 61 Poland Optimal Telecom A/S Tele2 Polska Comviq Karl Jacobsen vej 20 ul. Poste-pu 15 Box 62 DK-2500 Valby, Danmark PL-02-676 Warszaw, Poland SE-164 94 Kista, Sweden Phone: +45 77 30 12 90 (switchboard) Phone: +48 (22) 549 50 60 Phone: +46 8 5626 4000 (switchboard) Fax: +45 77 30 00 56 Fax: +48 (22) 549 50 61 Fax: +46 586 53 444 Customer Service: 0200-22 20 40 (private customers) Finland Czech Republic 0200-22 40 50 (corporate customers) Tele2 Finland Tele2 s. r. o. Sentnerikuja 3 Vinohradská 184, Praha 3, Kabelvision FI-00440 Helsingfors, Finland CZ-130 00, Czech Republic Box 62 Phone: +358 9 74 22 12 45 Phone: +420 267 13 22 38 SE-164 94 Kista, Sweden Fax: +358 9 74 22 12 46 Fax: +420 274 77 82 40 Phone: +46 8 5626 4352 (switchboard) Fax: +46 8 5865 4840 Russia Customer Service: Tele2 Russia Telecom +26 2000-22 55 00 B. Gnezdnikovsky Per.,1str.2, 7 tr RU-103 009, Moscow, Russia Optimal Telecom AB Phone: +7 095 797 21 61 Box 62 Fax: +7 095 797 21 62 SE-164 94 Kista, Sweden Phone: +46 8 5626 2500 (switchboard) Fax: +46 8 5626 2525 Sweden X-source AB Datametrix AB Box 416 Box 20078 SE-129 44, 129 04 Hägersten, Sweden SE-161 02 Bromma, Sweden Phone: +46 8 5222 3500 Phone: +46 8 5220 0200 Fax: +46 8 5222 3552 Fax: +46 8 5220 0290 90 T E L E 2 A N N U A L R E P O R T 2002
  • 93.
    Central Europe Southern Europe Other Branded Products Germany France & Services Tele2 Telecom Services GmbH Tele2 (France) S.A. In der Steele 39a, 14 Rue des Frères Caudron Tele2 UK Communications Ltd DE-40599 Düsseldorf, Germany FR-78143 Vélizy cedex, France Kingstons House 15, Phone: +49 211 7400 4600 Phone: +33 1 39 45 44 44 Coombe Road Fax: +49 211 7400 4611 Fax: +33 1 39 45 44 00 GB-London RG2 OSY, England Phone: +44 208 957 1900 Fax: +44 208 957 1901 Netherlands Italy Tele2 Nederland B.V. Tele2 Italia SpA Everyday.com Ellermanstraat 19 Via Cassanese 210 Box 17041 NL-1099BX Amsterdam, IT-20090 Segrate Milano, Italy SE-104 62 Stockholm, Sweden Netherlands Phone: +39 02 269 571 Phone: +46 8 5889 8400 Phone: +31 207 020 202 Fax: +39 02 269 204 37 Fax: +46 8 5889 8401 Fax: +31 207 020 222 Spain Alpha Telecom Communications Ltd Switzerland Tele2 Telecommunication Ryde House 391 TELE2 Telecommunication Services S.L. Richmond Road Services AG Francisco de Ricci,3, GB-Twickenhan TW1 2EF England Postfach 49 ES-28015 Madrid, Spain CH-8037 Zürich, Switzerland Phone: +34 91 540 28 00 C3 Calling Card Company Phone: +41 1 524 24 24 Fax: +34 91 540 28 01 1 Mill Street Fax: +41 1 524 47 78 GB-London SE1 2DE, England Phone: +44 207 232 4949 Luxembourg Austria Luxembourg Tele2 Telecommunication Tango S.A. Services GmbH 177, rue de Luxembourg, Schönbrunnerstr. 213-215, 4tr LU-8077 Bertrange, Luxembourg AT-1120 Vienna, Austria Phone: +352 27 777 101 Phone: +43 181 101 300 Fax: +352 27 777 888 Fax: +43 181 101 100 Liechtenstein Irland Tele2 AG Tele2 Telecommunication 75 route de Longwy, Services Ltd LU-8080 Bertrange, Luxembourg Office 4, O'Duffy Centre, Main Street, Phone: +352 27 750 101 Carrickmacross, Fax: +352 27 750 250 Co Monaghan, Irland Phone: +353 42 969 2946 Fax: +353 42 969 2947 Belgium Tele2 Belgium N.V. 75 route de Longwy, LU-8080 Bertrange, Luxembourg Phone: +352 27 750 101 Fax: +352 27 750 250 3C Communications S.A. 75 route de Longwy LU-8080 Bertrange, Luxembourg Phone: +352 27 750 101 Fax: +352 27 750 250 Transac S.A. 3, rue de l'Abattoir LU-3409 Dudelange, Luxembourg Phone: +352 27 754 101 Fax: +352 27 754 300 91
  • 94.
    2002 History 2000 – Comviq celebrates 10th Anniversary, breaks Swedish record with more than – NetCom is awarded UMTS licenses 2 million prepaid card subscribers. in Norway and Sweden. – Tele2 is world’s fourth fastest-growing listed telecom/IT company. – Netcom acquires Latvia’s next – MVNO launched in the Netherlands and MVNO agreements signed in Norway largest mobile operator, and Austria. Baltikom GSM. – Jan Hugo Stenbeck, Tele2’s founder and Chairman, dies at 59 years of age. 2000 2001 – NetCom becomes the first mobile virtual – Acquisition of FORA Telecom. network operator (MVNO) in Denmark. – Joint UMTS company with Telia. – NetCom acquires Société Européenne – NetCom changes corporate identity to Tele2. de Communication S.A. 1999 – NetCom increases its holding in Ritabell to 94.8%. – Pre-selection initiated in Denmark, Norway and Sweden. Year-end – NetCom AB sells its holding in NetCom ASA to Société Européenne de 1997/1998 Communication S.A., SEC. In exchange, receives newly issued shares in SEC. – The Norwegian telecom market After transaction, NetCom AB owns 17.8% of capital in SEC. is deregulated. 1998 1997 – Operations are extended to the Baltic States through – NetCom Systems is the acquisition of 48% in the mobile operator Ritabell. listed on Nasdaq. – NetCom Systems AB changes corporate identity to 1996 NetCom AB. – The shares in NetCom Systems are distributed to shareholders in Kinnevik. Meanwhile, NetCom Systems is listed on the O-List of the Stockholm Stock Exchange. – NetCom Systems, via the subsidiary Tele2 1990 1993 A/S, becomes the first competitor to Tele – Tele2 AB is established. – NetCom Systems starts the Danmark in the Danish telecom market, (Currently Tele2 Sverige AB). predecessor to Tele2 Norge. breaking a 100-year old monopoly. 1992 1993 – Comviq GSM starts up its own – Deregulation of the market for fixed telephony. GSM-network. – NetCom Systems is established in order to own and develop the Kinnevik Group’s telecom companies in the Nordic region. – Kinnevik and Orkla form the Norwegian company, NetCom ASA. NetCom Systems owns 25% of the company. 1989 1980s – Agreement with the Swedish Rail 1986 – Kinnevik complete the preparations Administration (Banverket) covering – A satellite connection for for providing conventional investment in a joint fiber-optic network. data traffic is opened. telecommunications in voice and data. 1988 1981 Late 1970s – Comviq received – Comvik AB launched its – Industriförvaltnings AB a GSM license. own analog network for Kinnevik decides to mobile telephony. undertake a venture in the telecommunications market. 92 T E L E 2 A N N U A L R E P O R T 2002
  • 95.
    Definitions Definitions (Text in parentheses refers to financial ratios after full conversion.) Liquidity Capital employed Shareholders’ equity per share Cash and cash equivalents, including unutilized Total assets less provisions, minority interests Shareholders’ equity (including convertible credit facilities granted. and non-interest bearing liabilities. debentures) less minority interests, divided by the weighted average number of shares out- Net borrowing Return on capital employed standing during the fiscal year (that would Interest-bearing liabilities (less convertible Profit/loss after financial items less items result from full conversion of convertible debentures) less interest-bearing assets. affecting comparability and financial costs (less debentures). interest expense for convertible debentures) Investments divided by average capital employed. Cash flow per share Acquisition and divestment of fixed assets, in- Based on cash flow from operating activities cluding investments through financial leases, and Average interest expense before investment and financing activities. investments not qualifying as cash equivalents. Interest expense (less interest expense for con- vertible debentures) divided by average interest- Dividend per share Equity/assets ratio bearing liabilities (less convertible debentures). Based on the dividend distributed or proposed Shareholders’ equity (including convertible each year. debentures) divided by total assets. Earnings per share Profit/loss for the period (less interest expense ARPU Debt/equity ratio on convertible debentures, and less tax deduc- Average monthly revenue per customer. Interest-bearing net debt divided by share- tions) divided by the weighted average number holders’ equity at the end of the period. of shares outstanding during the fiscal year MoU (that would result from full conversion of con- Minutes of monthly usage per customer. Return on shareholders’ equity vertible debentures). Profit/loss after tax less items affecting compar- ability, minority interests after tax deductions (and interest expense for convertible debentures after tax deductions) divided by average equity (including convertible debentures). Glossary CRM - Customer Relationship Management, MVNO – Mobile Virtual Network Operator. VOIP – Voice Over Internet Protocol. often supported by computer-based systems. MVNO’s have greater network resources than Telephony that uses Internet Protocol. Service Providers with which to offer their own DSL - Digital Subscriber Line. telecom services to subscribers. But they do VPN – Virtual Private Network. Generic name covering several different tech- not have radio access network capacity, which A service that links a company’s local and tele- nologies for datatransmission over fixed phone must be purchased from a network operator. com networks with the computers and phones lines. of employees who work remotely, forming a NMT – Nordic Mobile Telephone. telecom or data communications network that GPRS – General Packet Radio Service. Ordinarily identified as the 1st-generation looks to users like a single business network. A technology that permits high-capacity data mobile telephony. An analog technology transmission using mobile phones. developed in the Nordic region. WAN – Wide Area Network. A network of computers on different locations. GSM – Global System of Mobile. SMS – Short Message Service. Often consists of several LANs linked together. Communications or Groupe Spécial Mobile. Enables the transmission of short text messages 2nd-generation mobile telephony system. between mobile phones or between a computer WAP – Wireless Application Protocol. Digital, as opposed to analog NMT. that is connected to the Internet and a mobile An industrial standard for Internet-based phone. data communications over mobile networks. IP – Internet Protocol. Developed by the WAP Forum, consisting of A series of rules for communication among SP – Service Provider. big corporations like Ericsson, IBM, Motorola computers over the Internet. A company that purchases capacity from net- and Nokia. work operators with which it can sell telecom LAN – Local Area Network. services to its subscribers. WLL – Wireless Local Loop. Local network of computers, often in the same Wireless broadband access via radio networks. room or building. UMTS – Universal Mobile Telecommunications System. MMS – Multimedia Messaging Services. A ser- A technology for 3rd-generation mobile tele- Sources: Computer Sweden, Mobiltelebranschen, vice that makes it possible to send text, video phony intended to handle, text, images, and Svenska Datatermgruppen and Tele2. and audio messages between mobile phones or video. UMTS has greater capacity than GSM. between Internet-connected computers and a mobile telephone. 93
  • 96.
    TELE2 AB Skeppsbron 18 P.O.Box 2094 SE-103 13 Stockholm Phone +46 8 5620 0060 Solberg. Print: Göteborgstryckeriet. Fax +46 8 5620 0040 E-mail info@tele2.com www.tele2.com Corporate identification No.: 556410-8917