Download to read offline
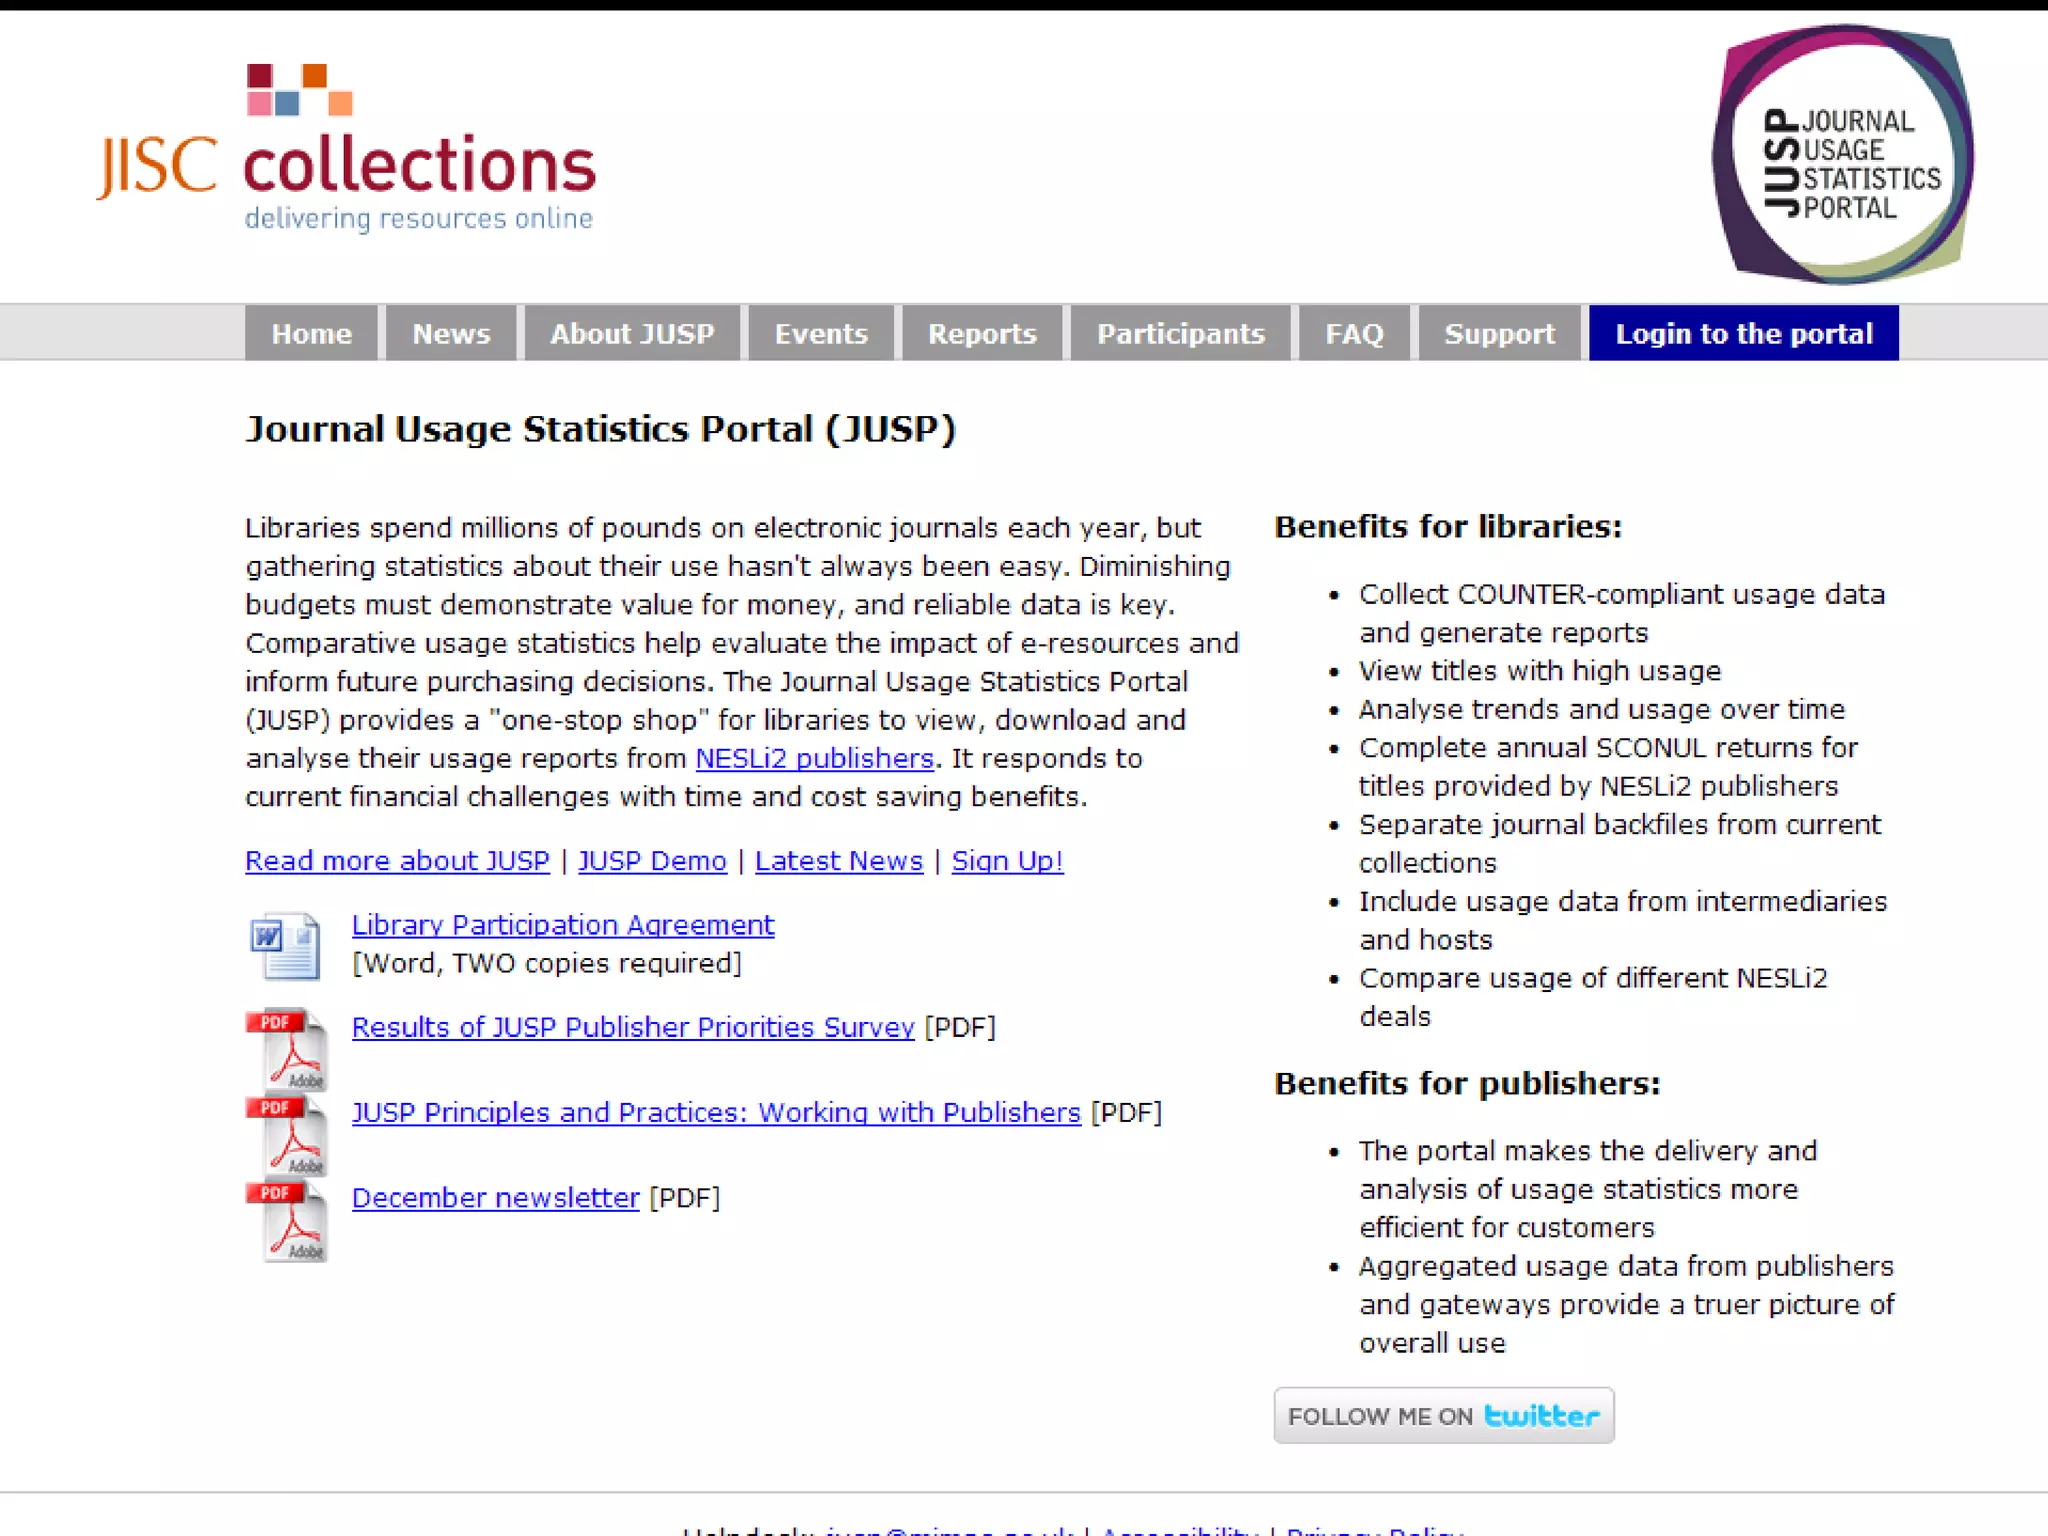

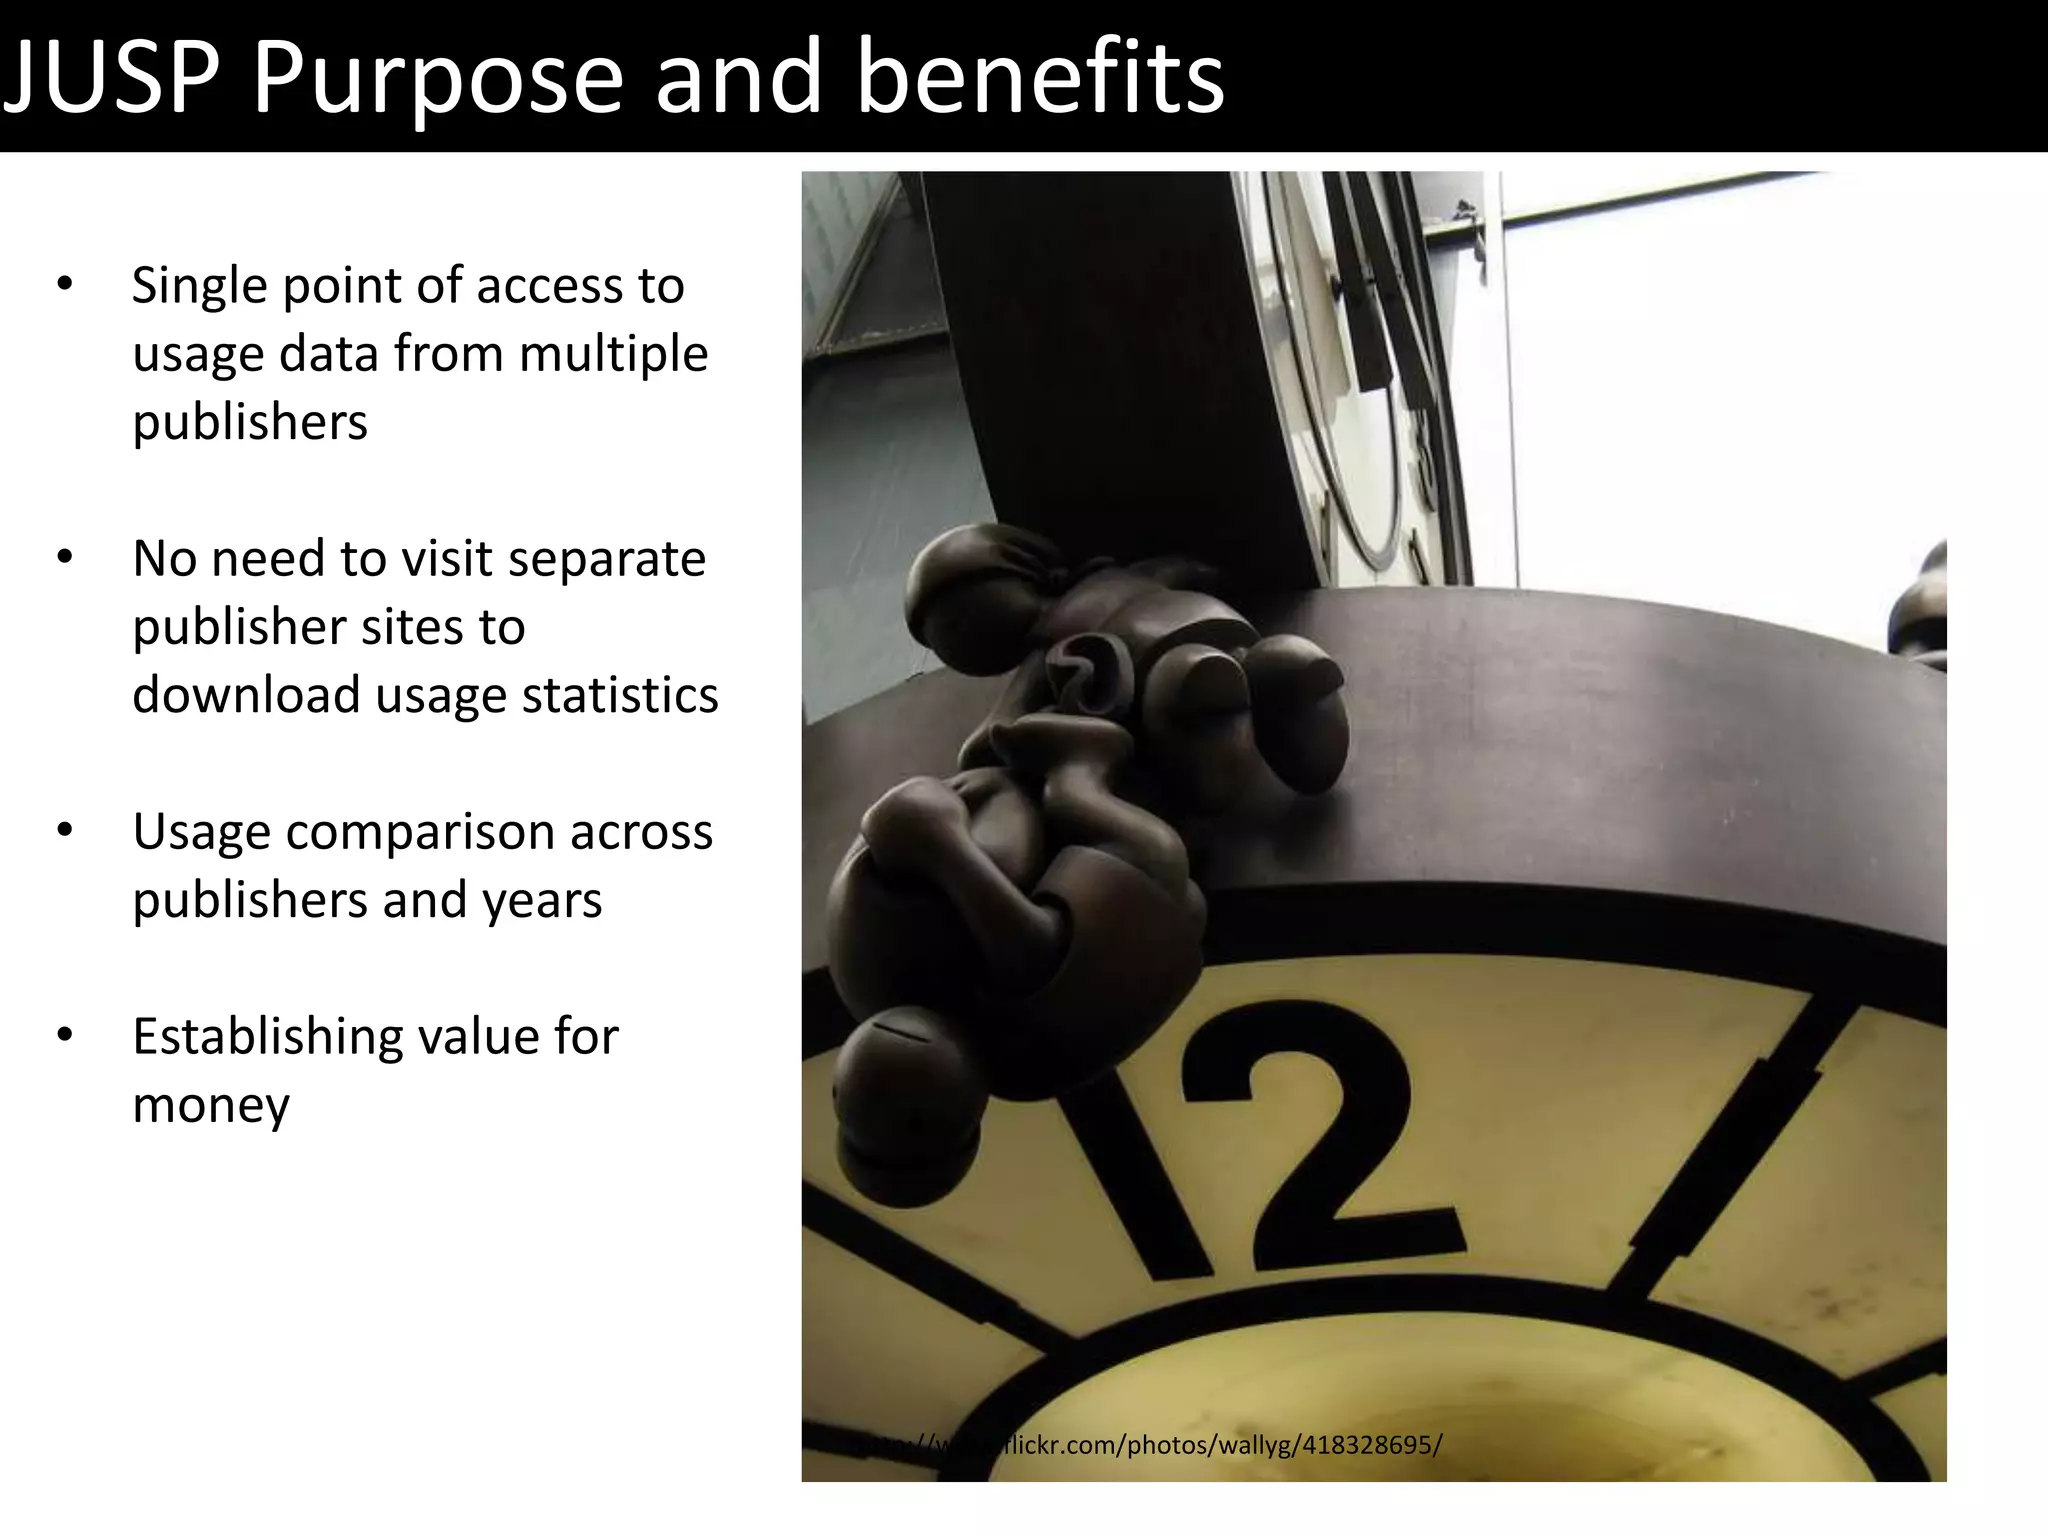
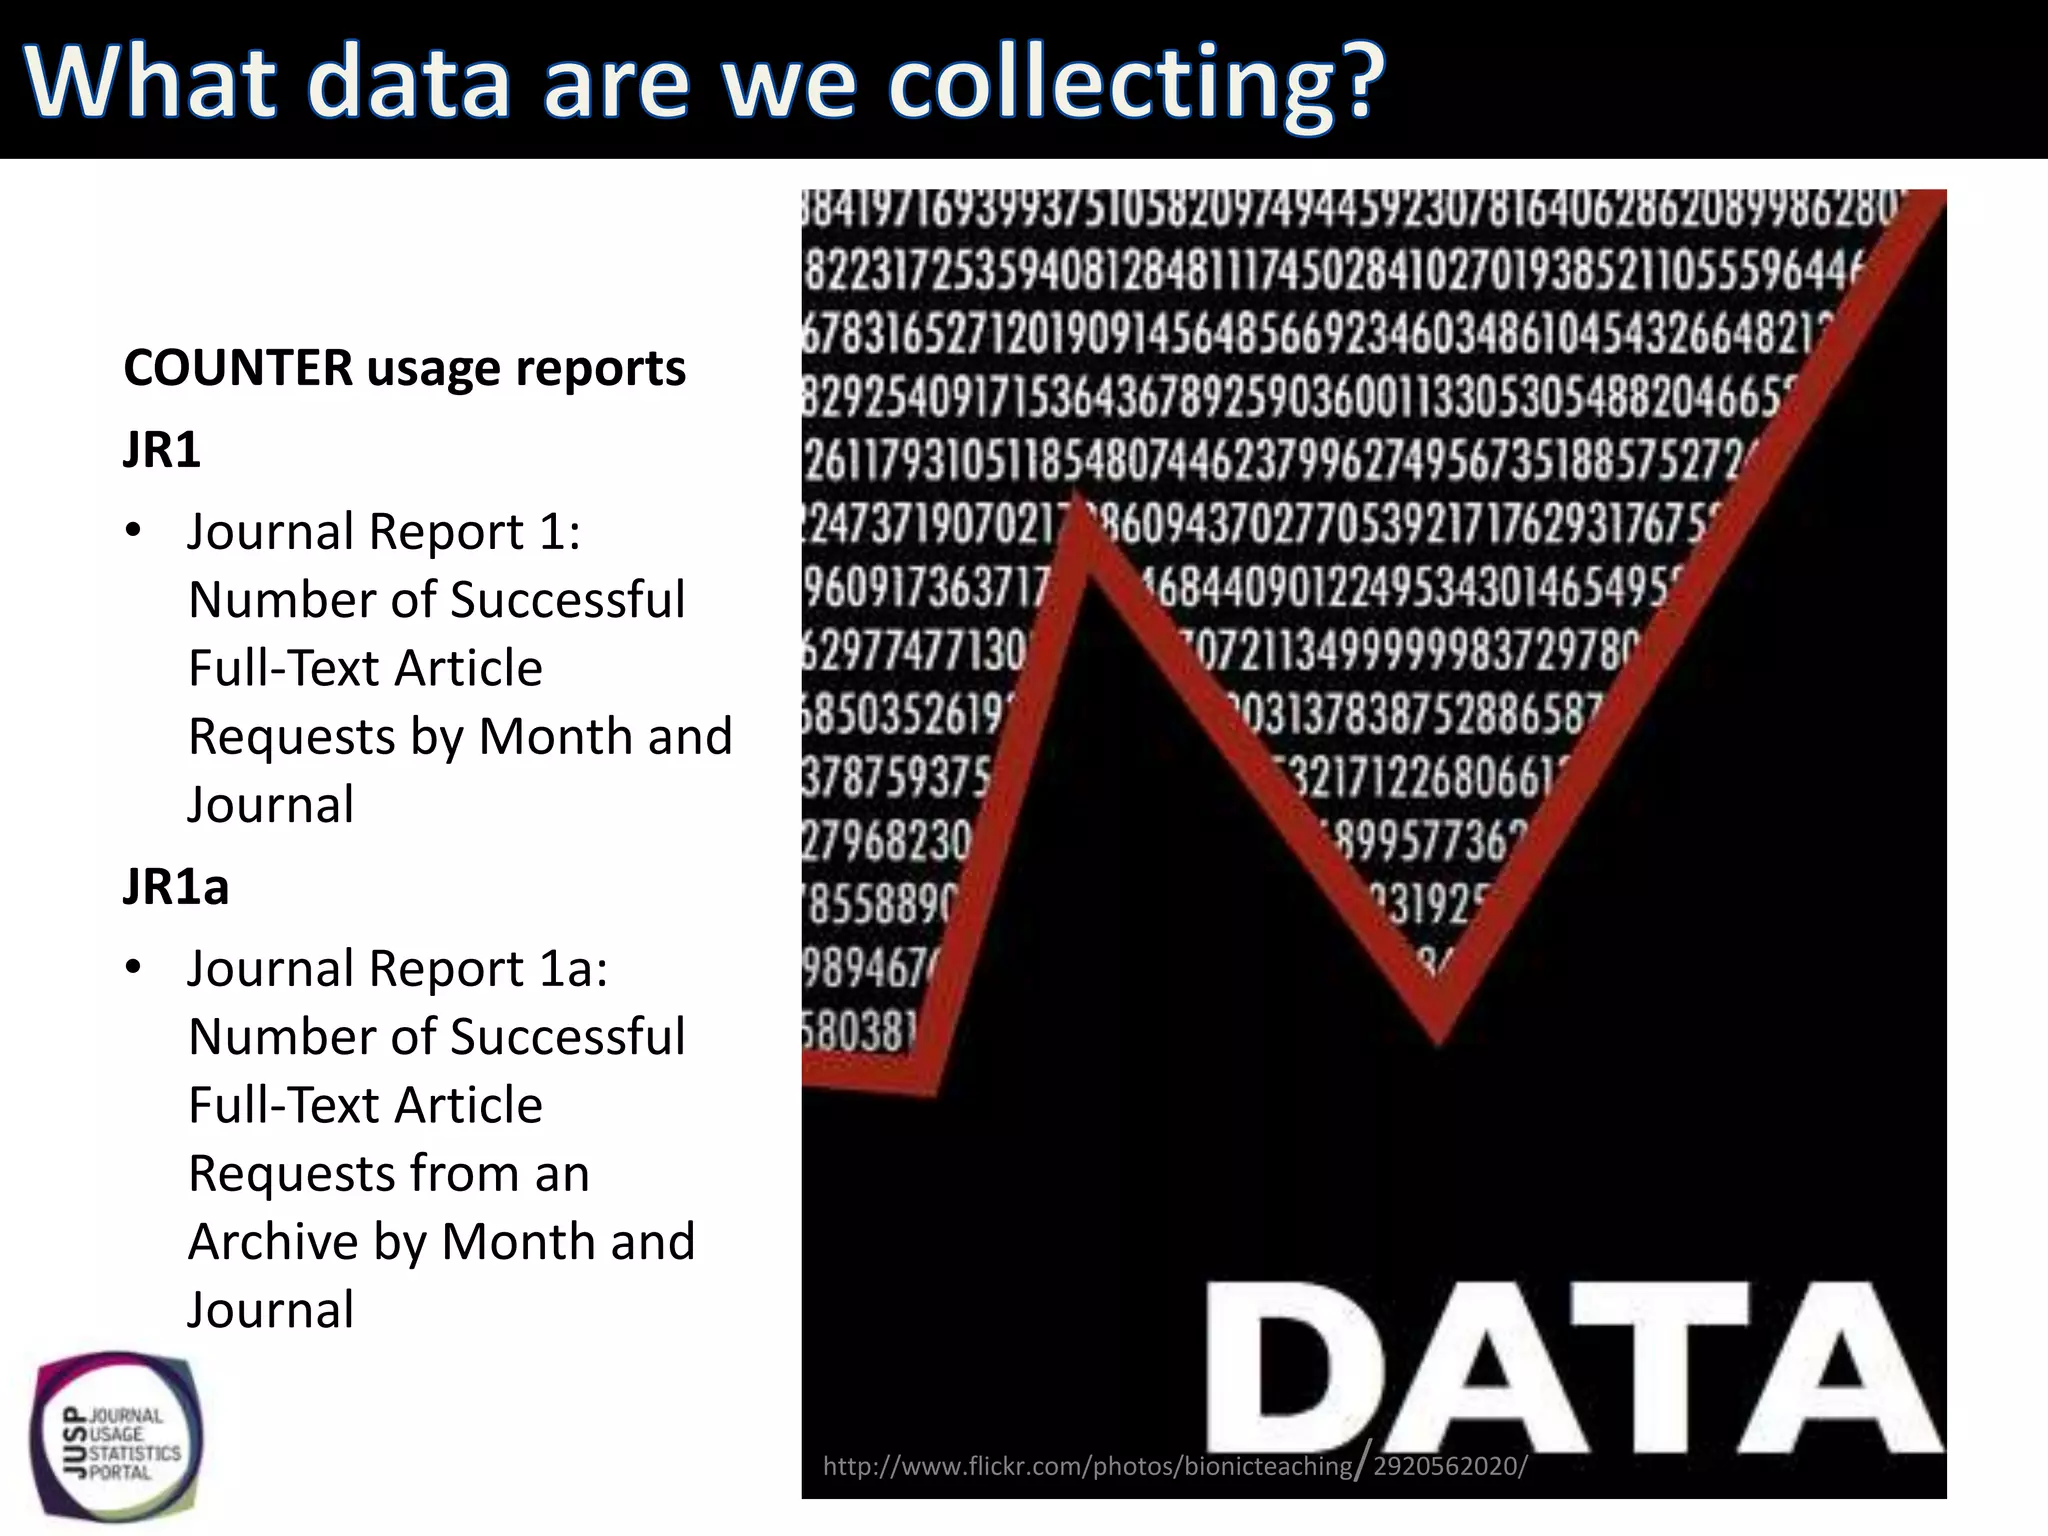
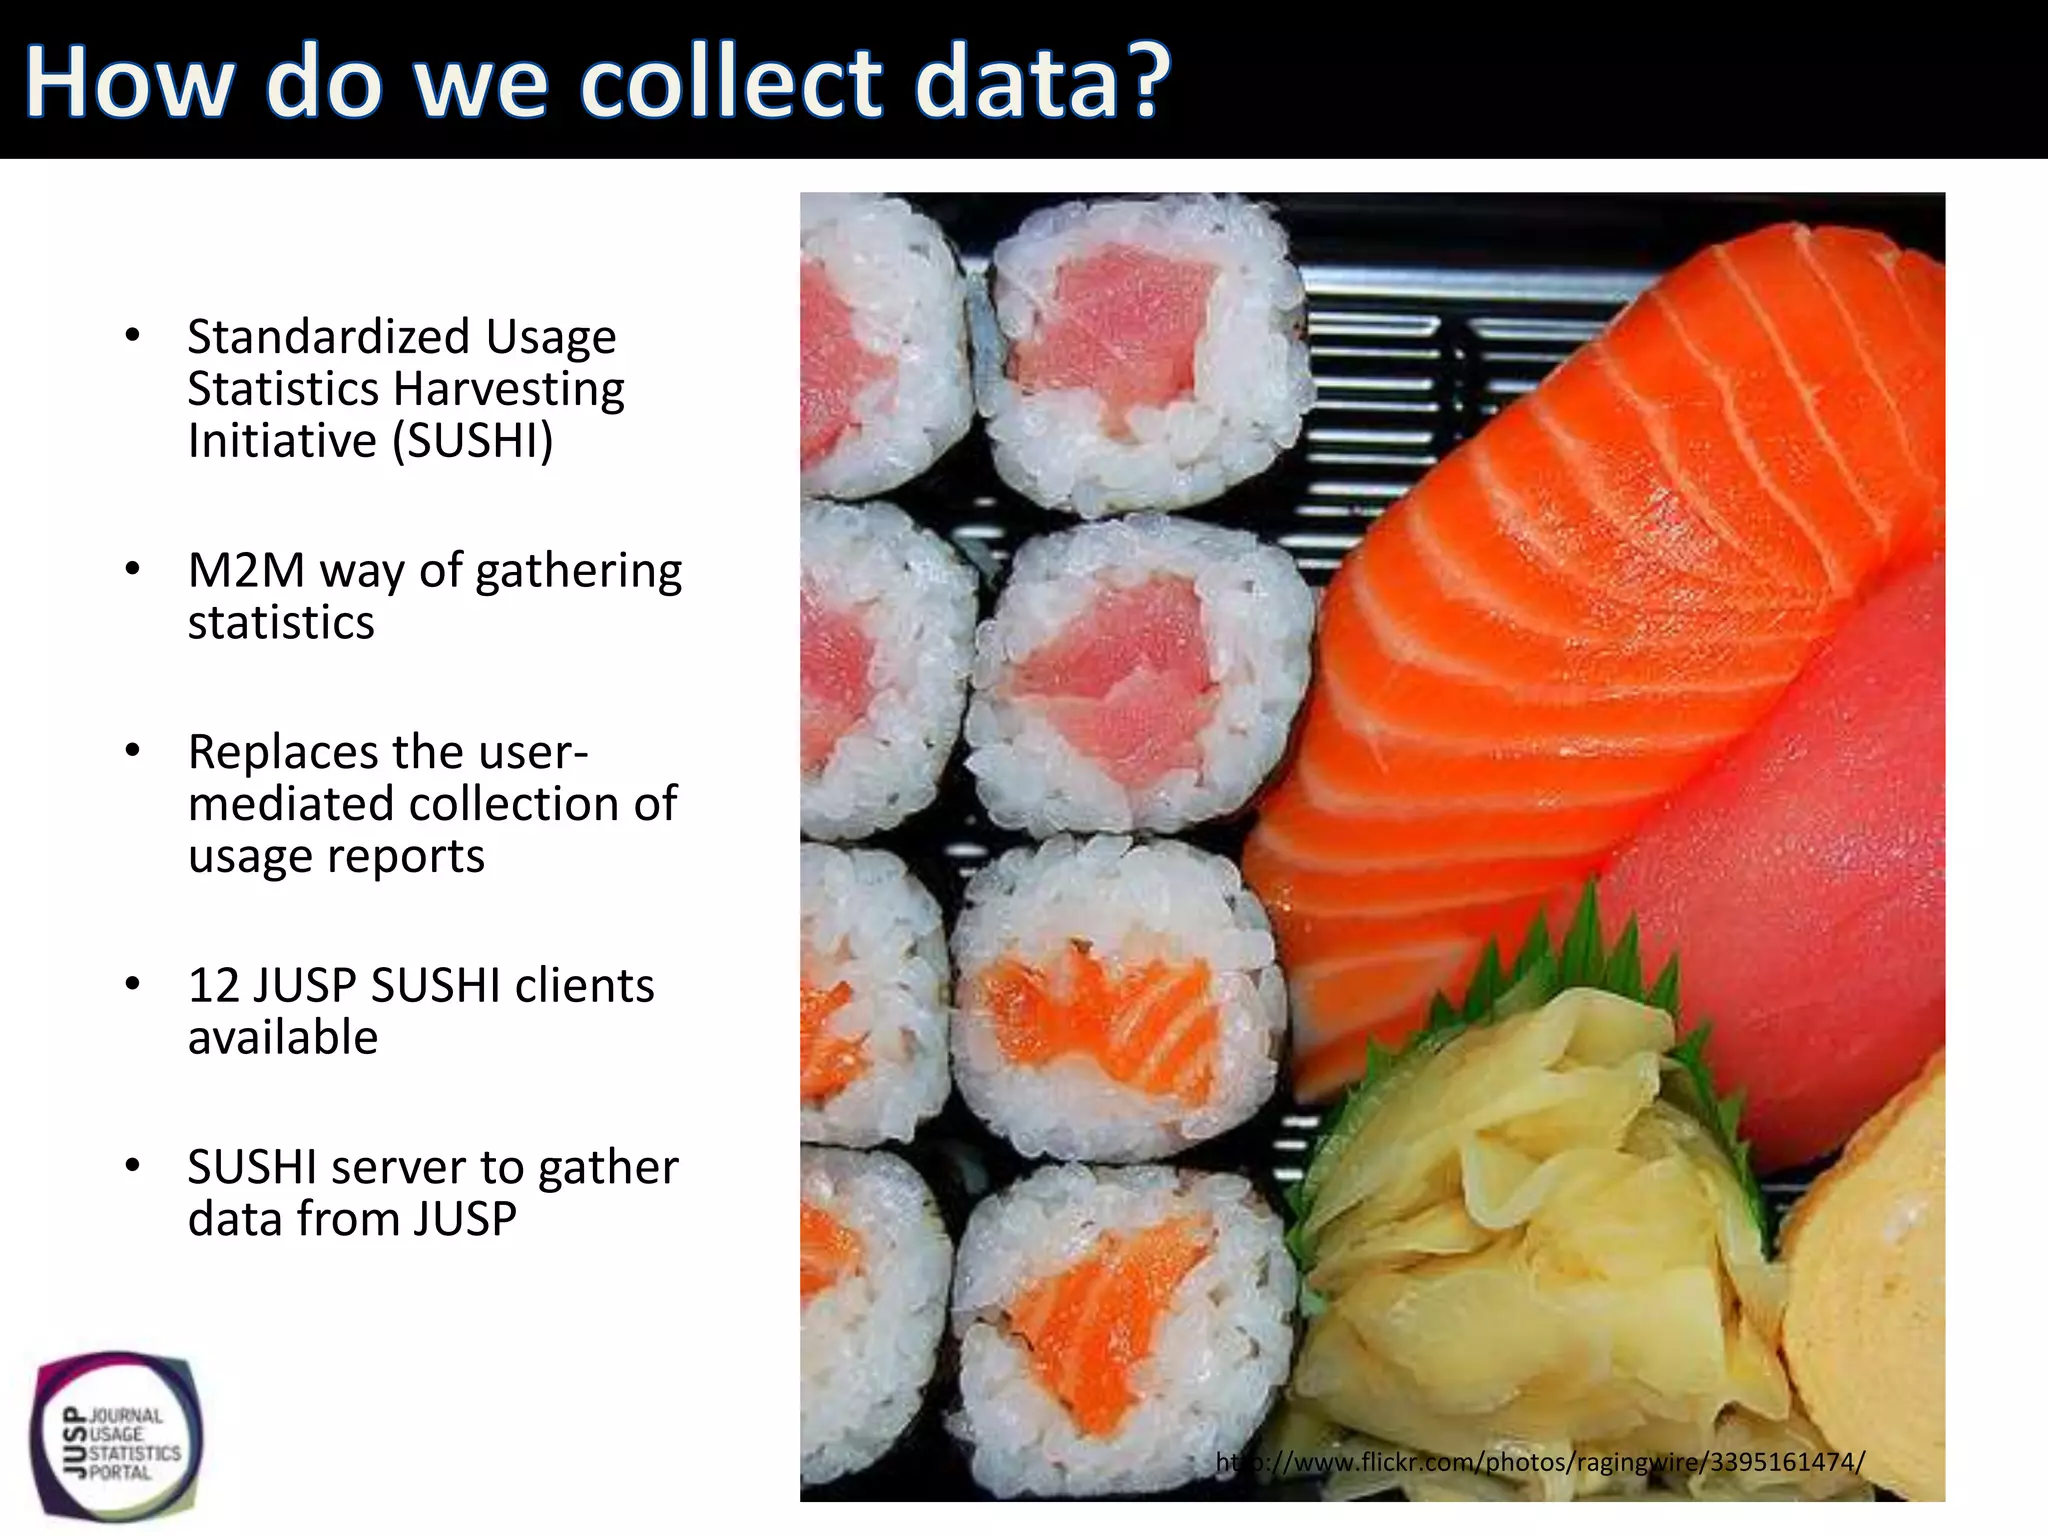
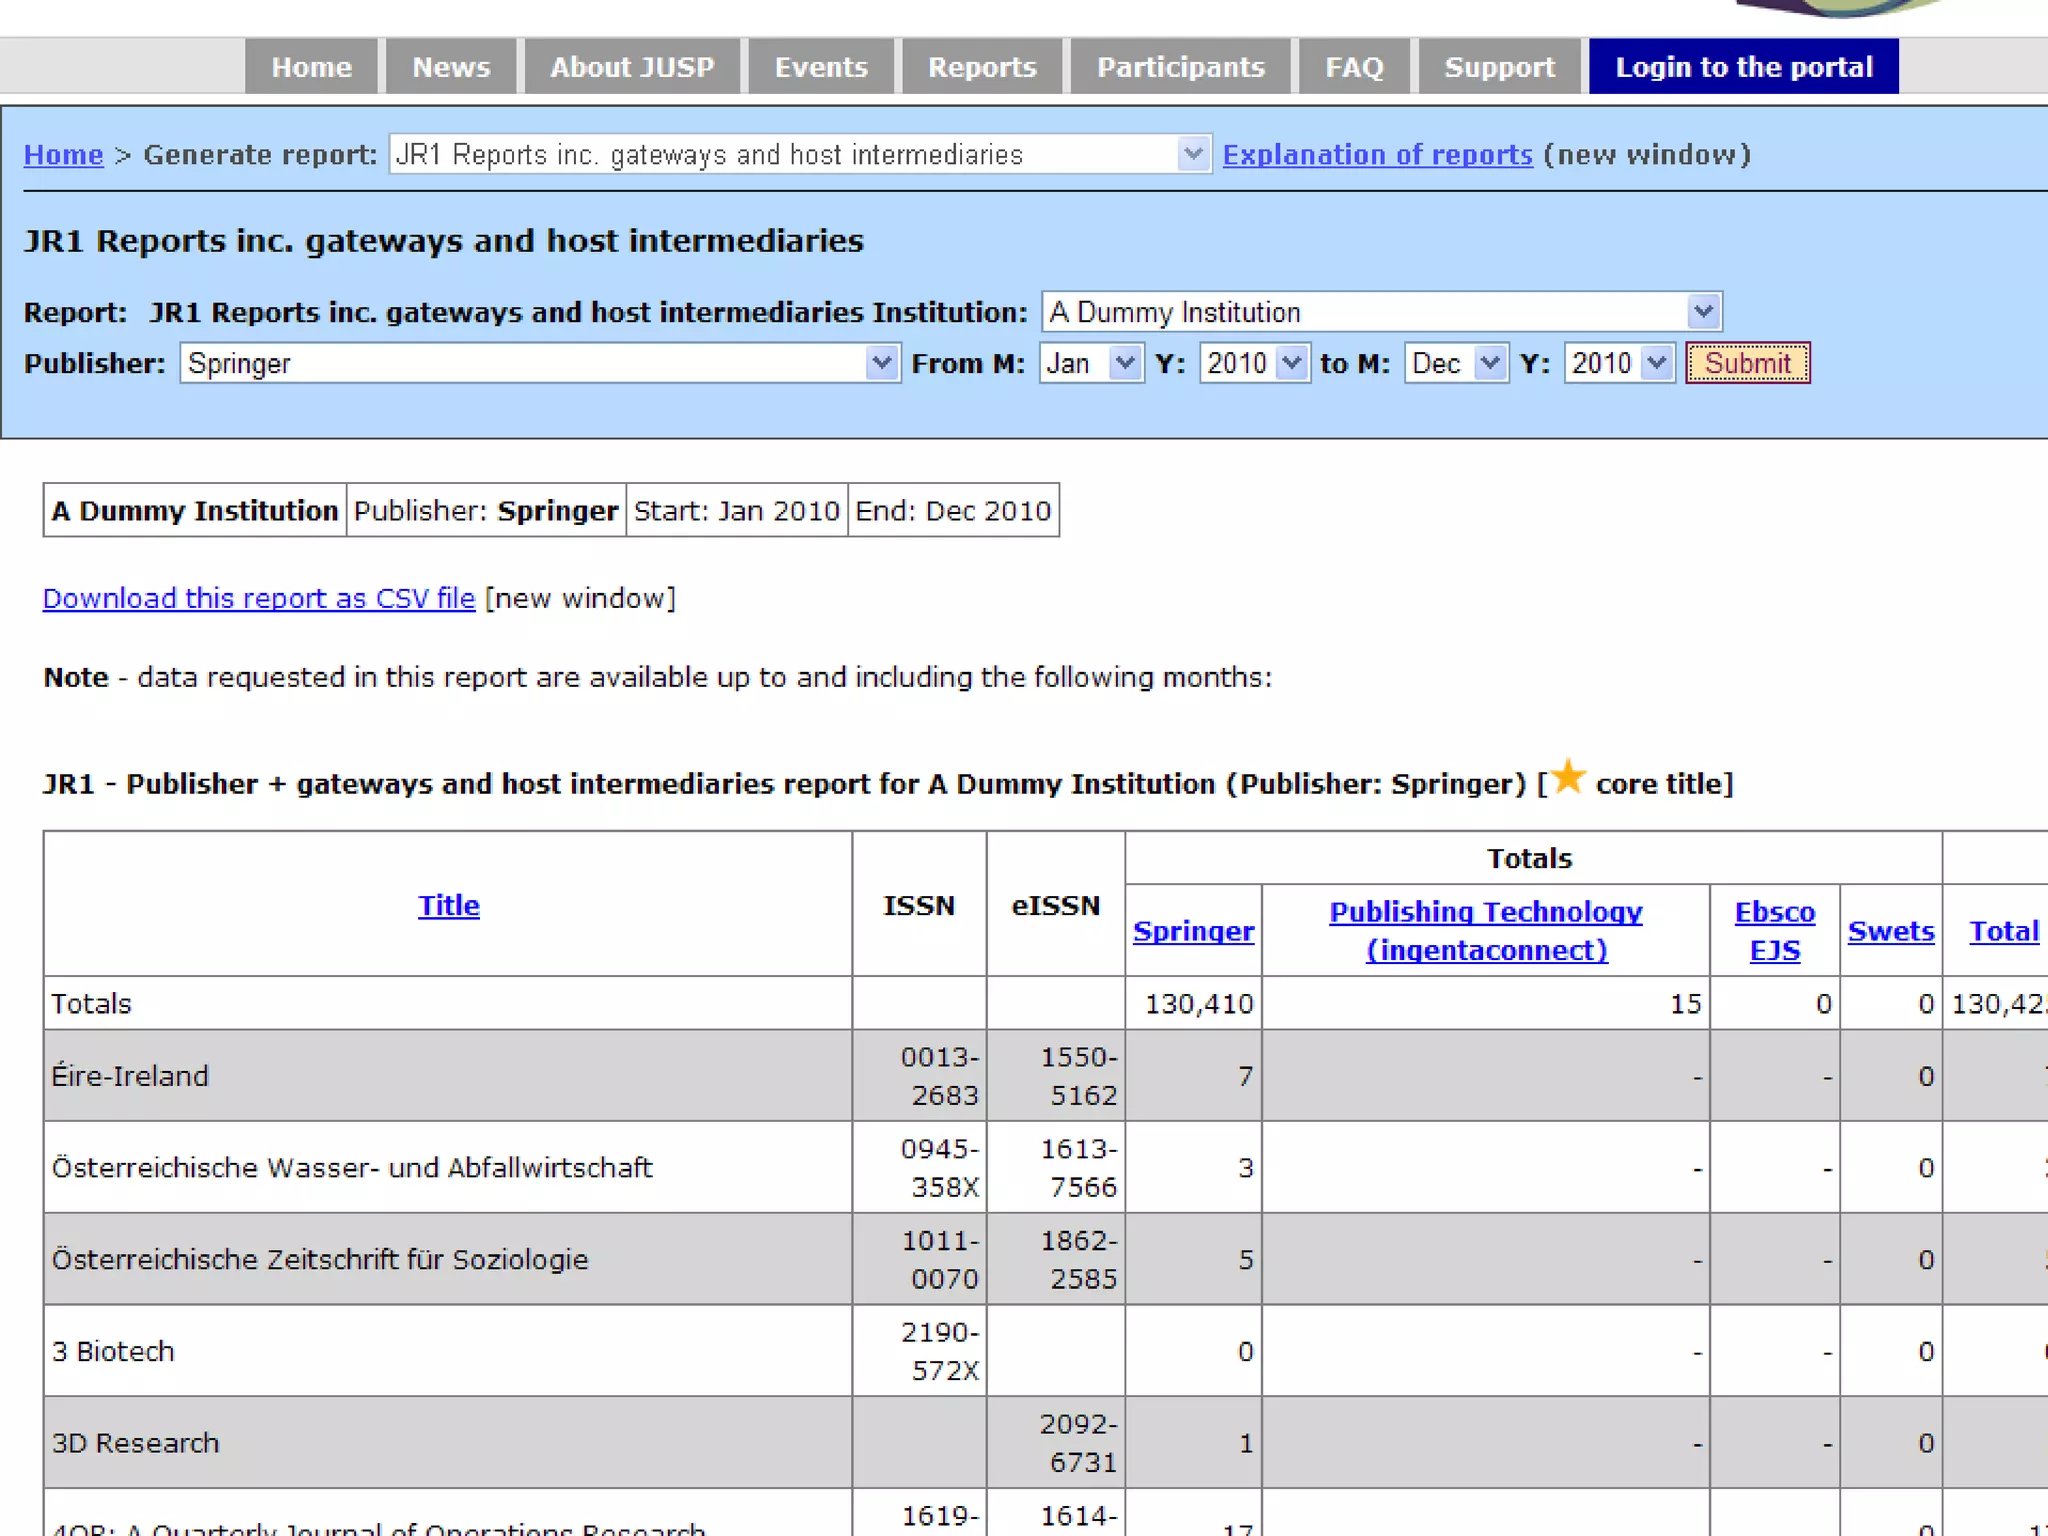
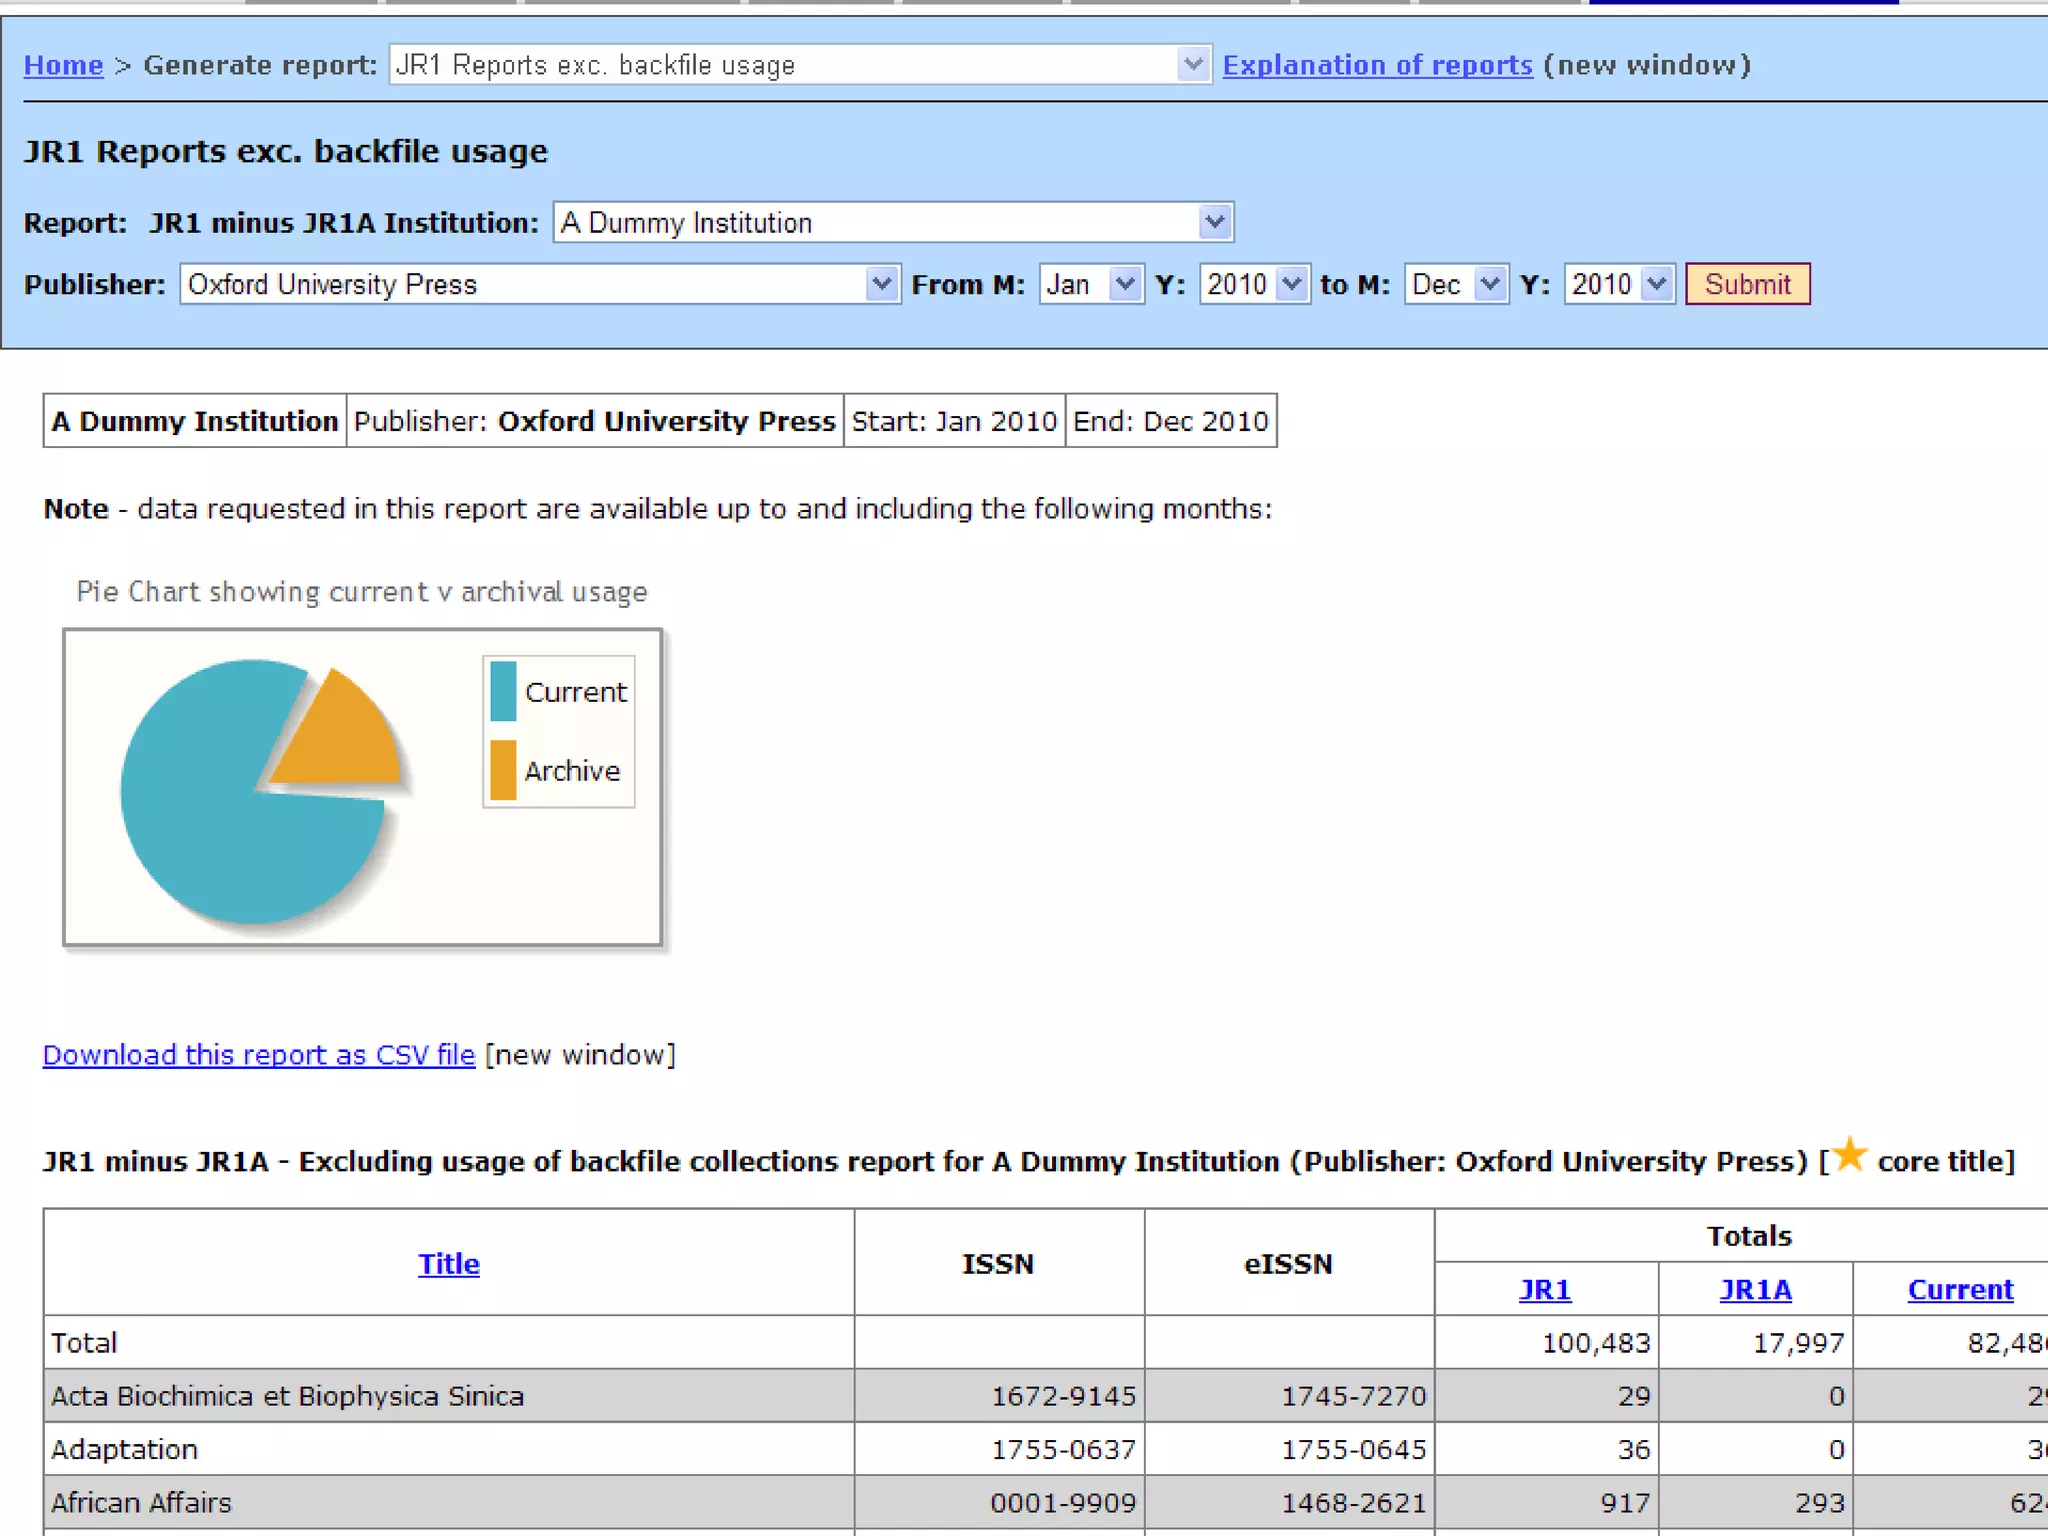
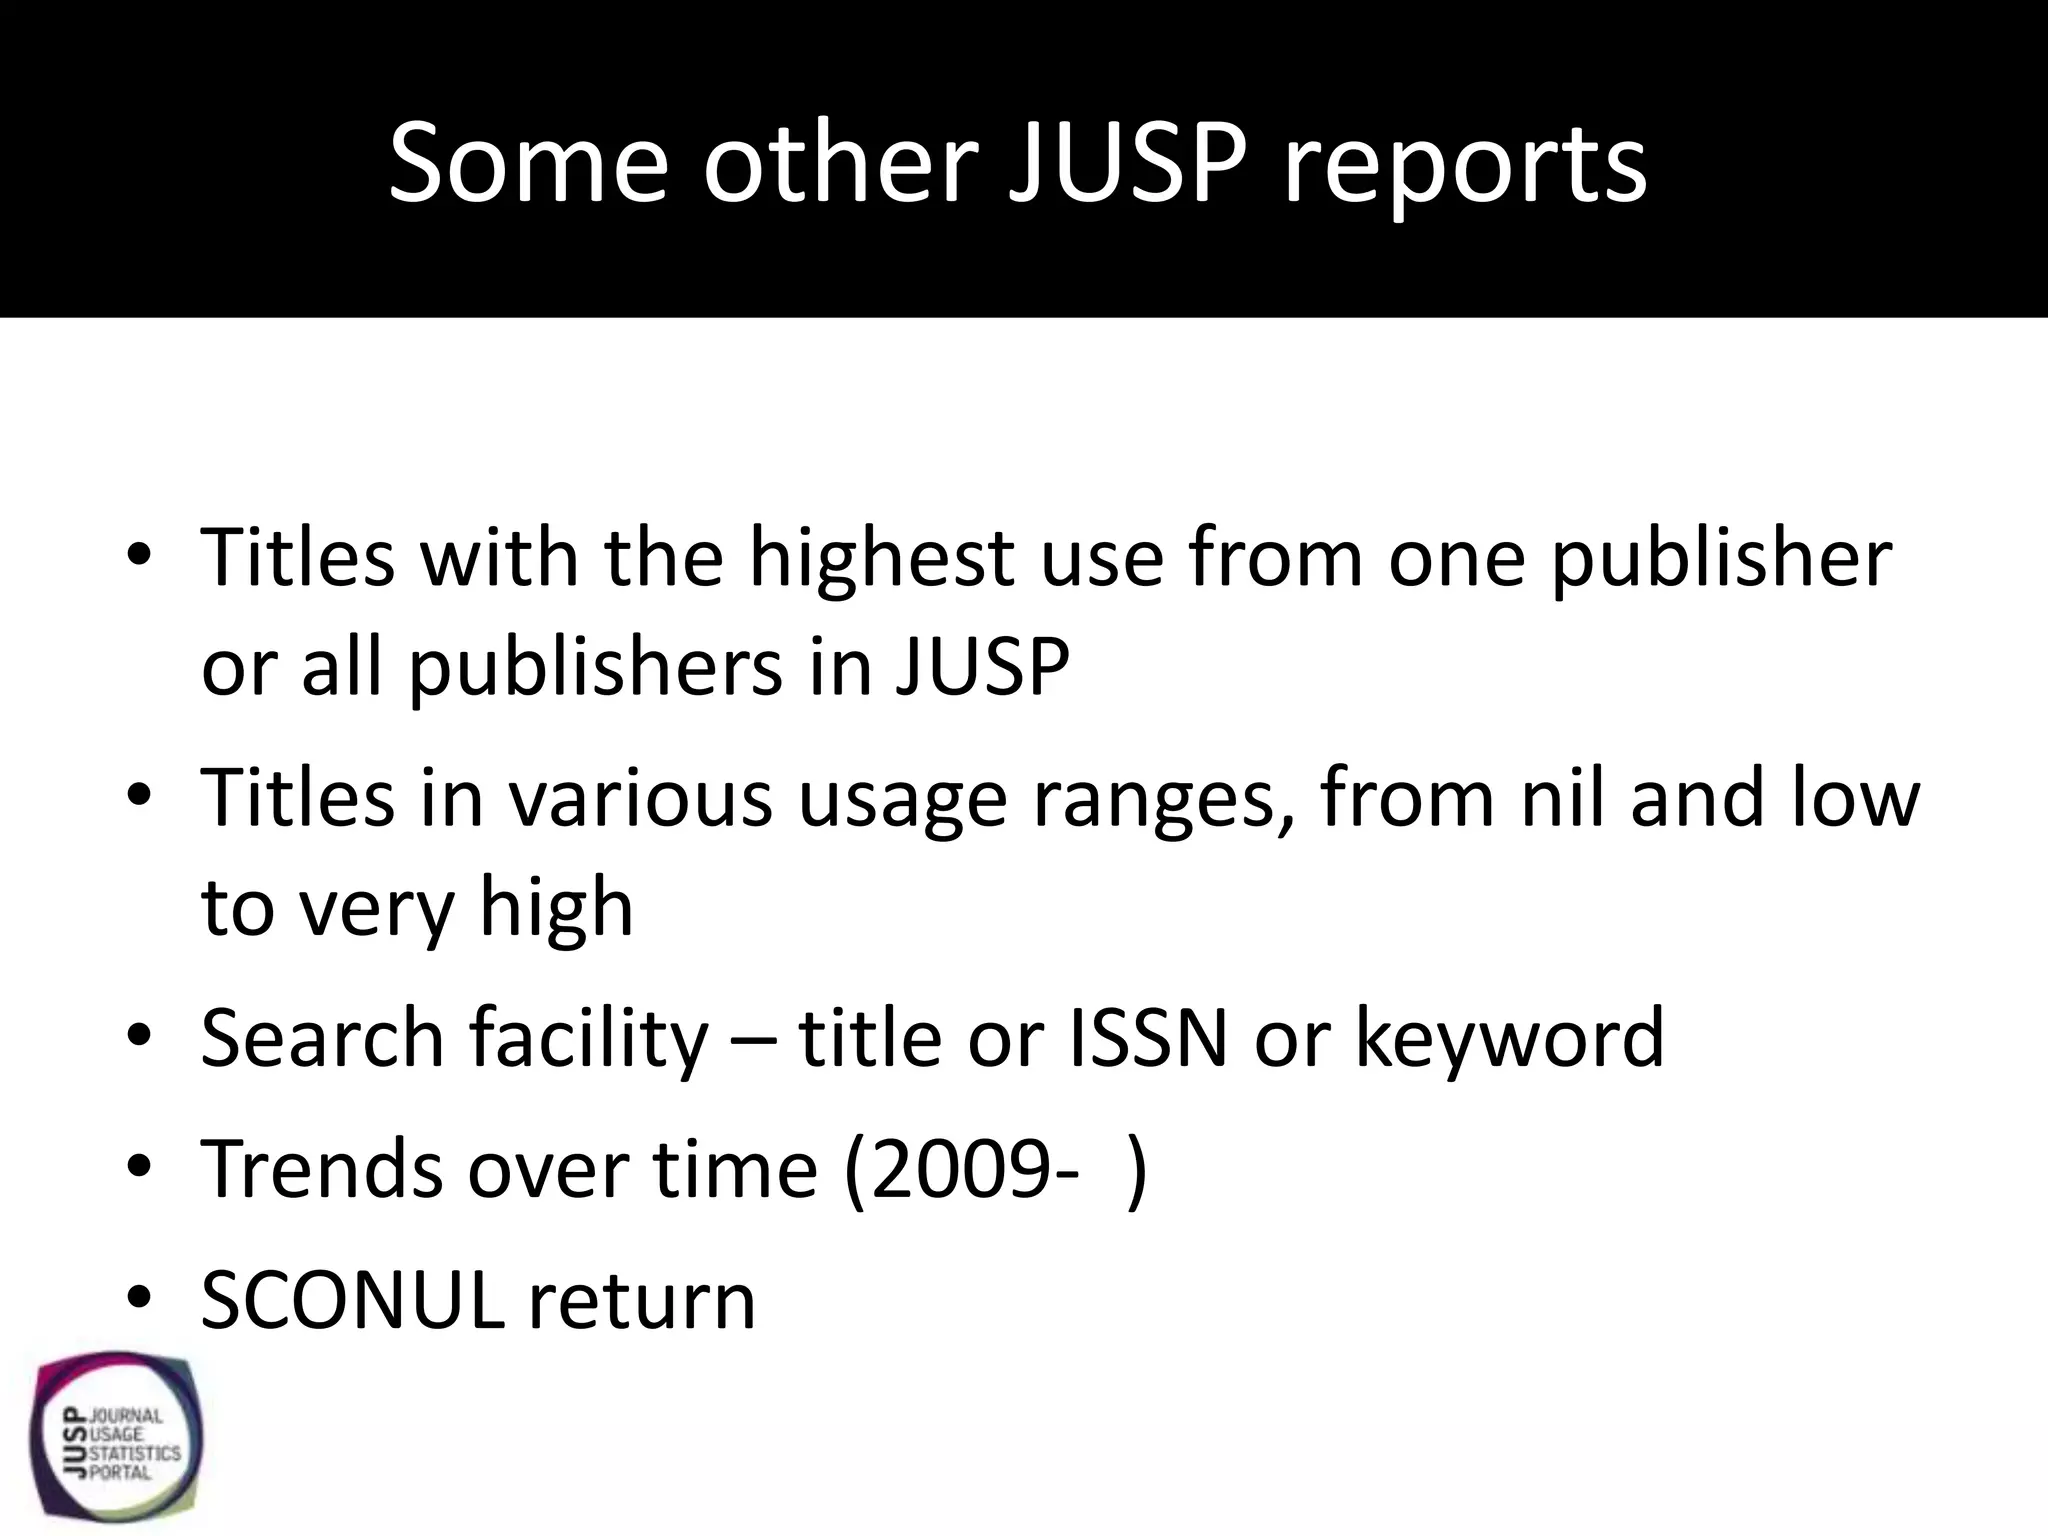
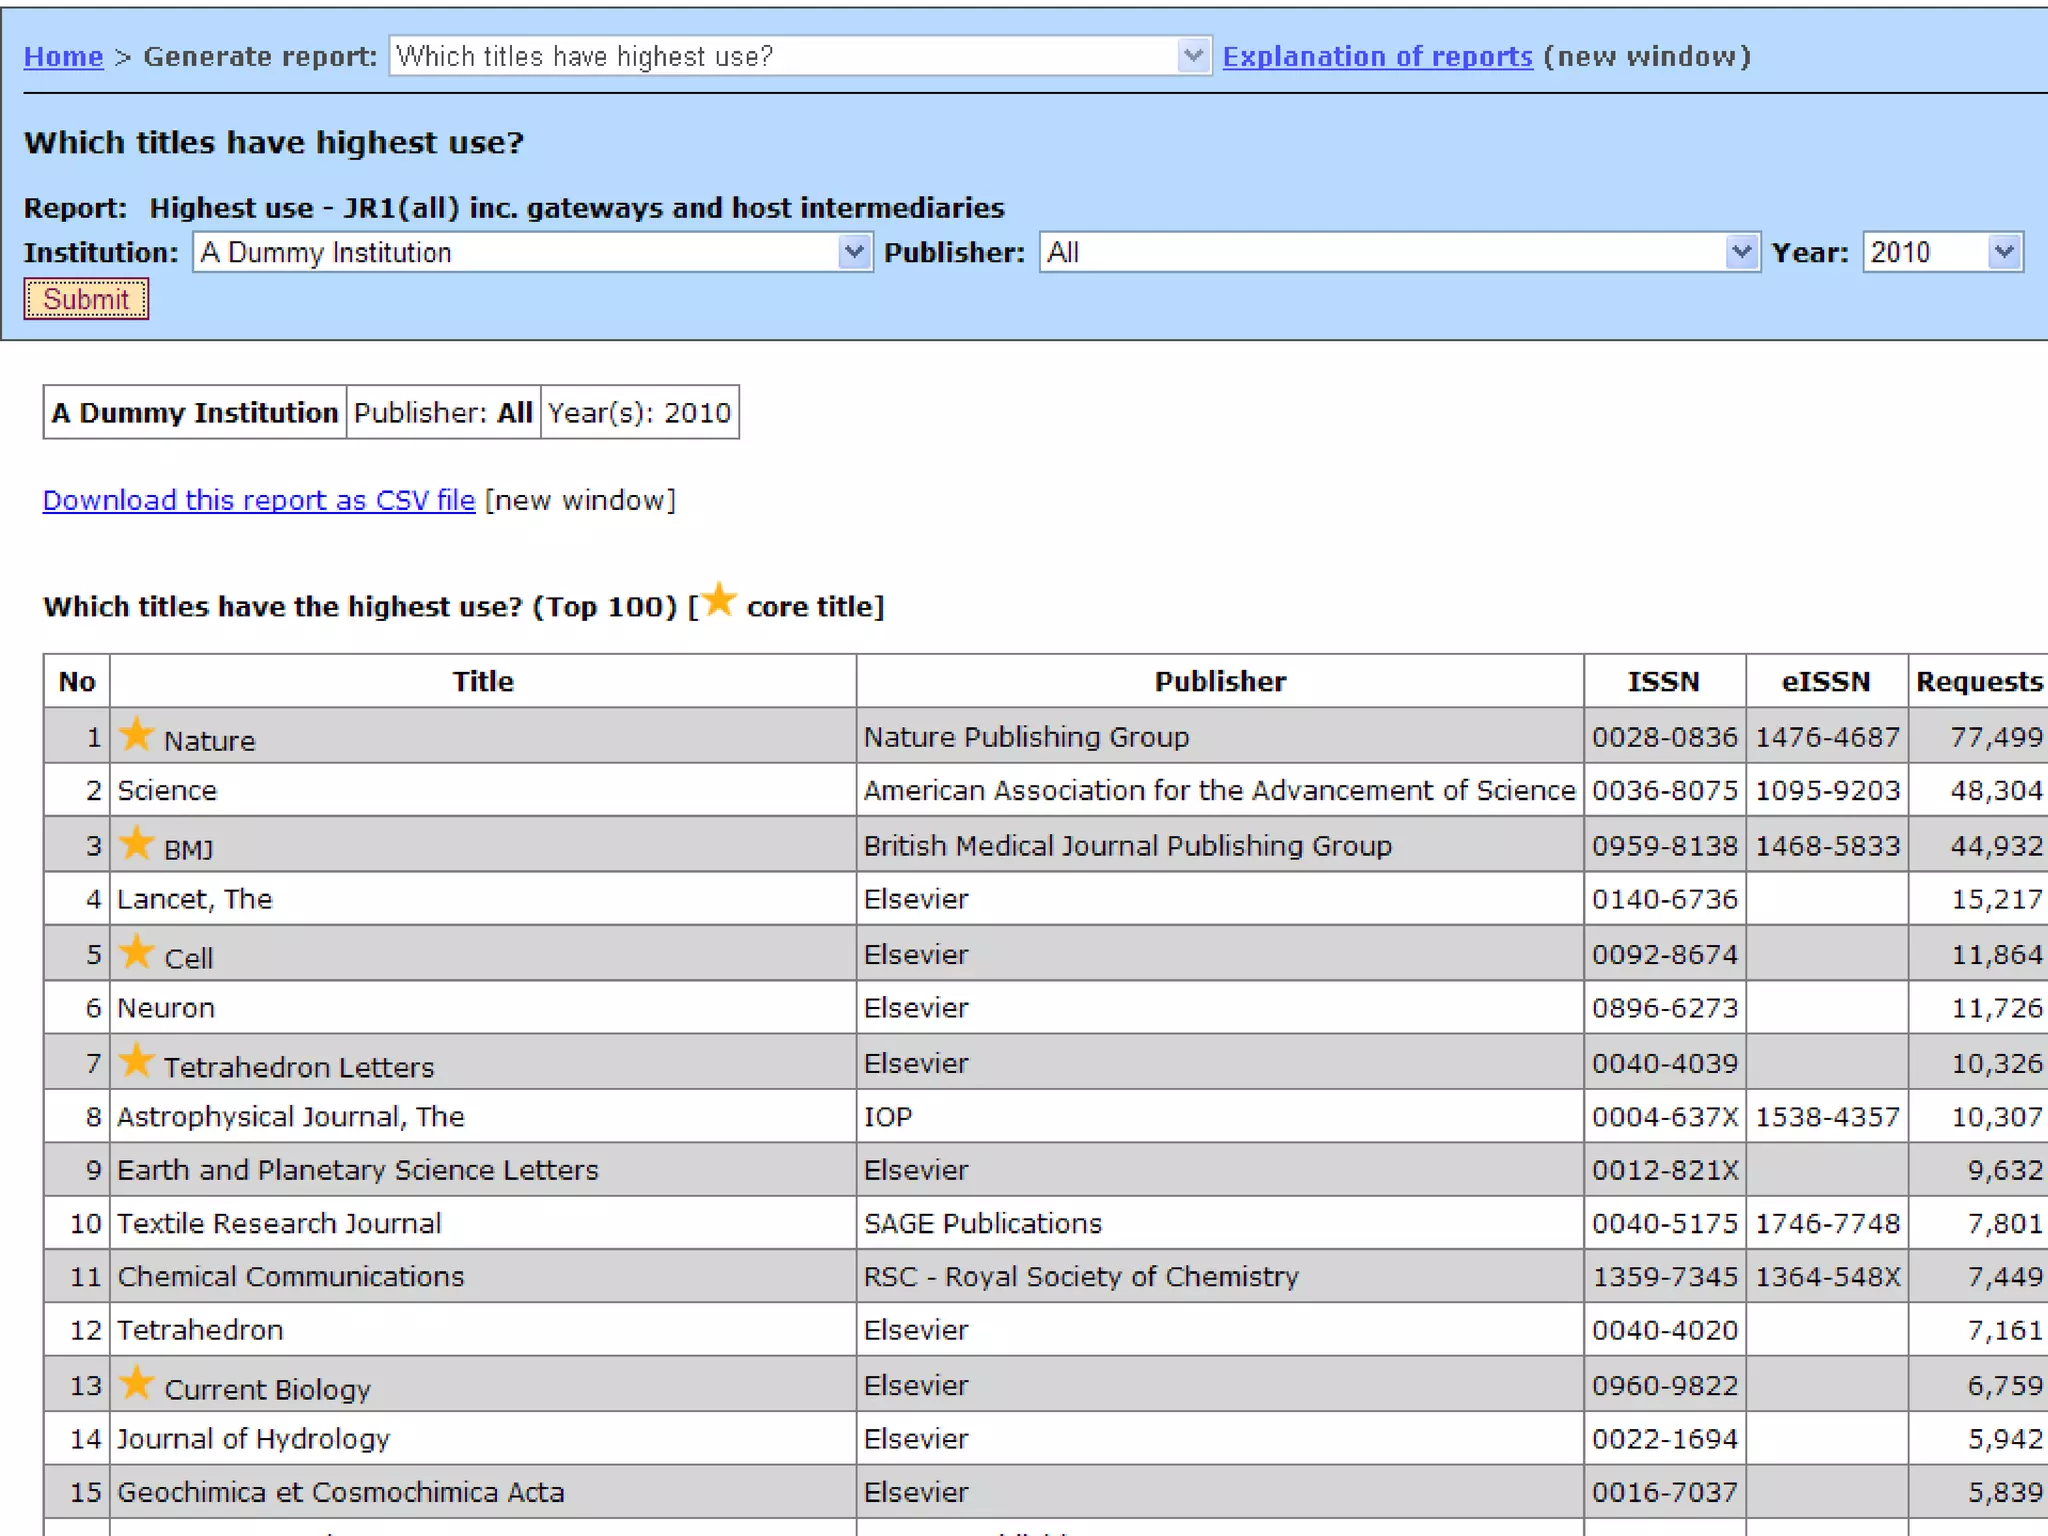
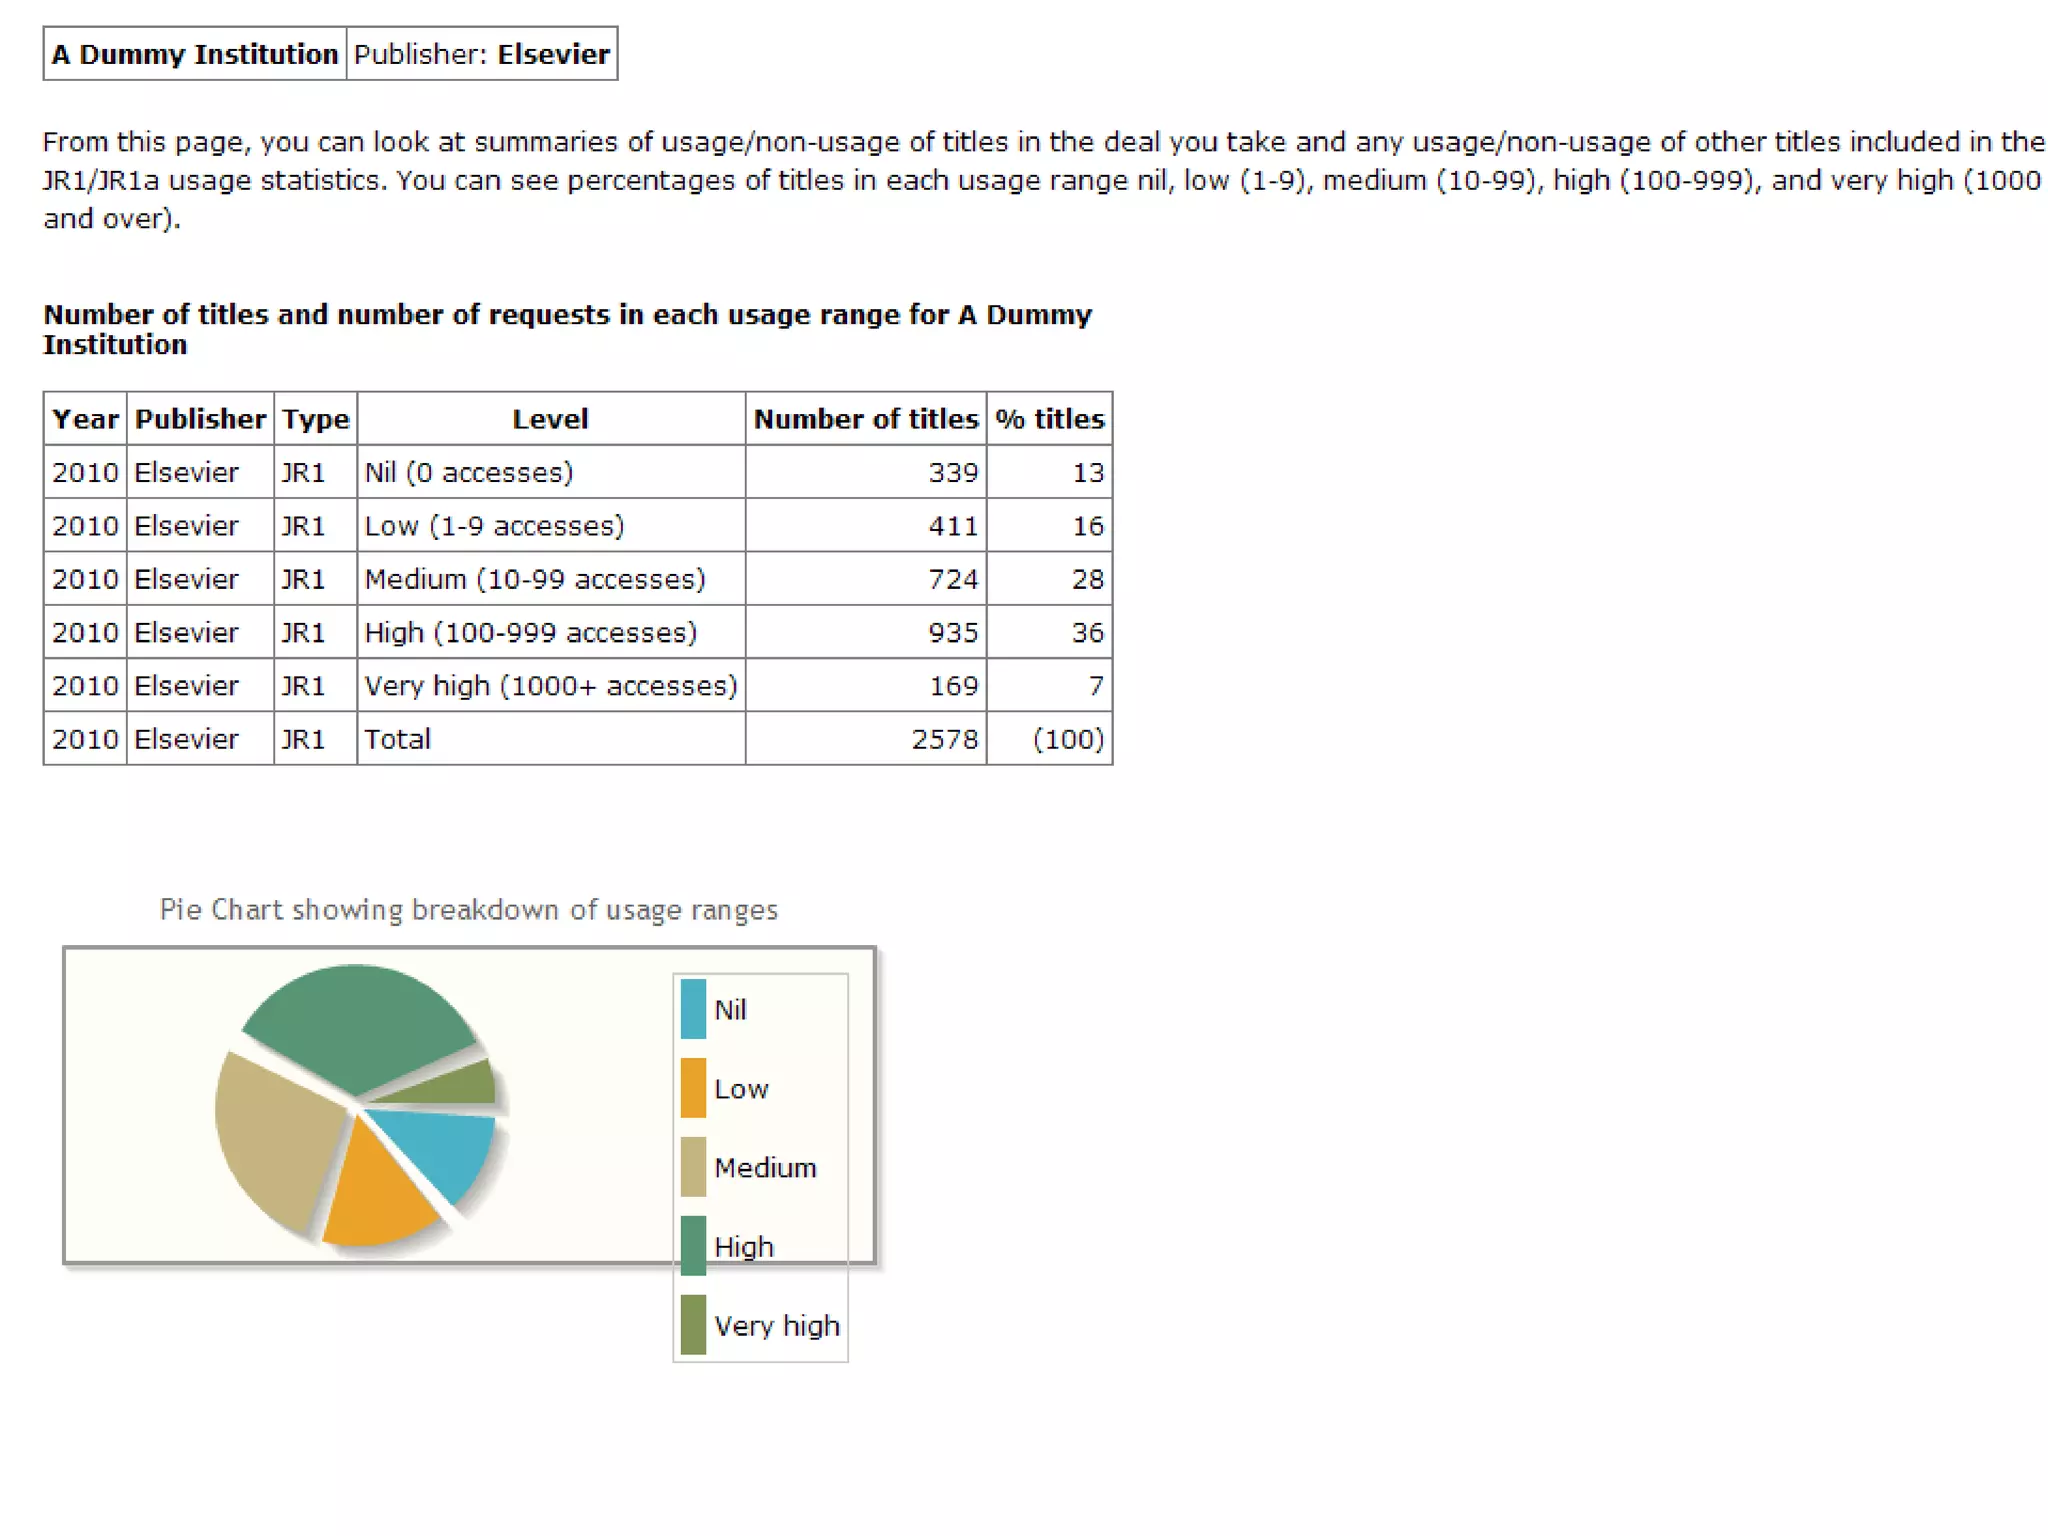
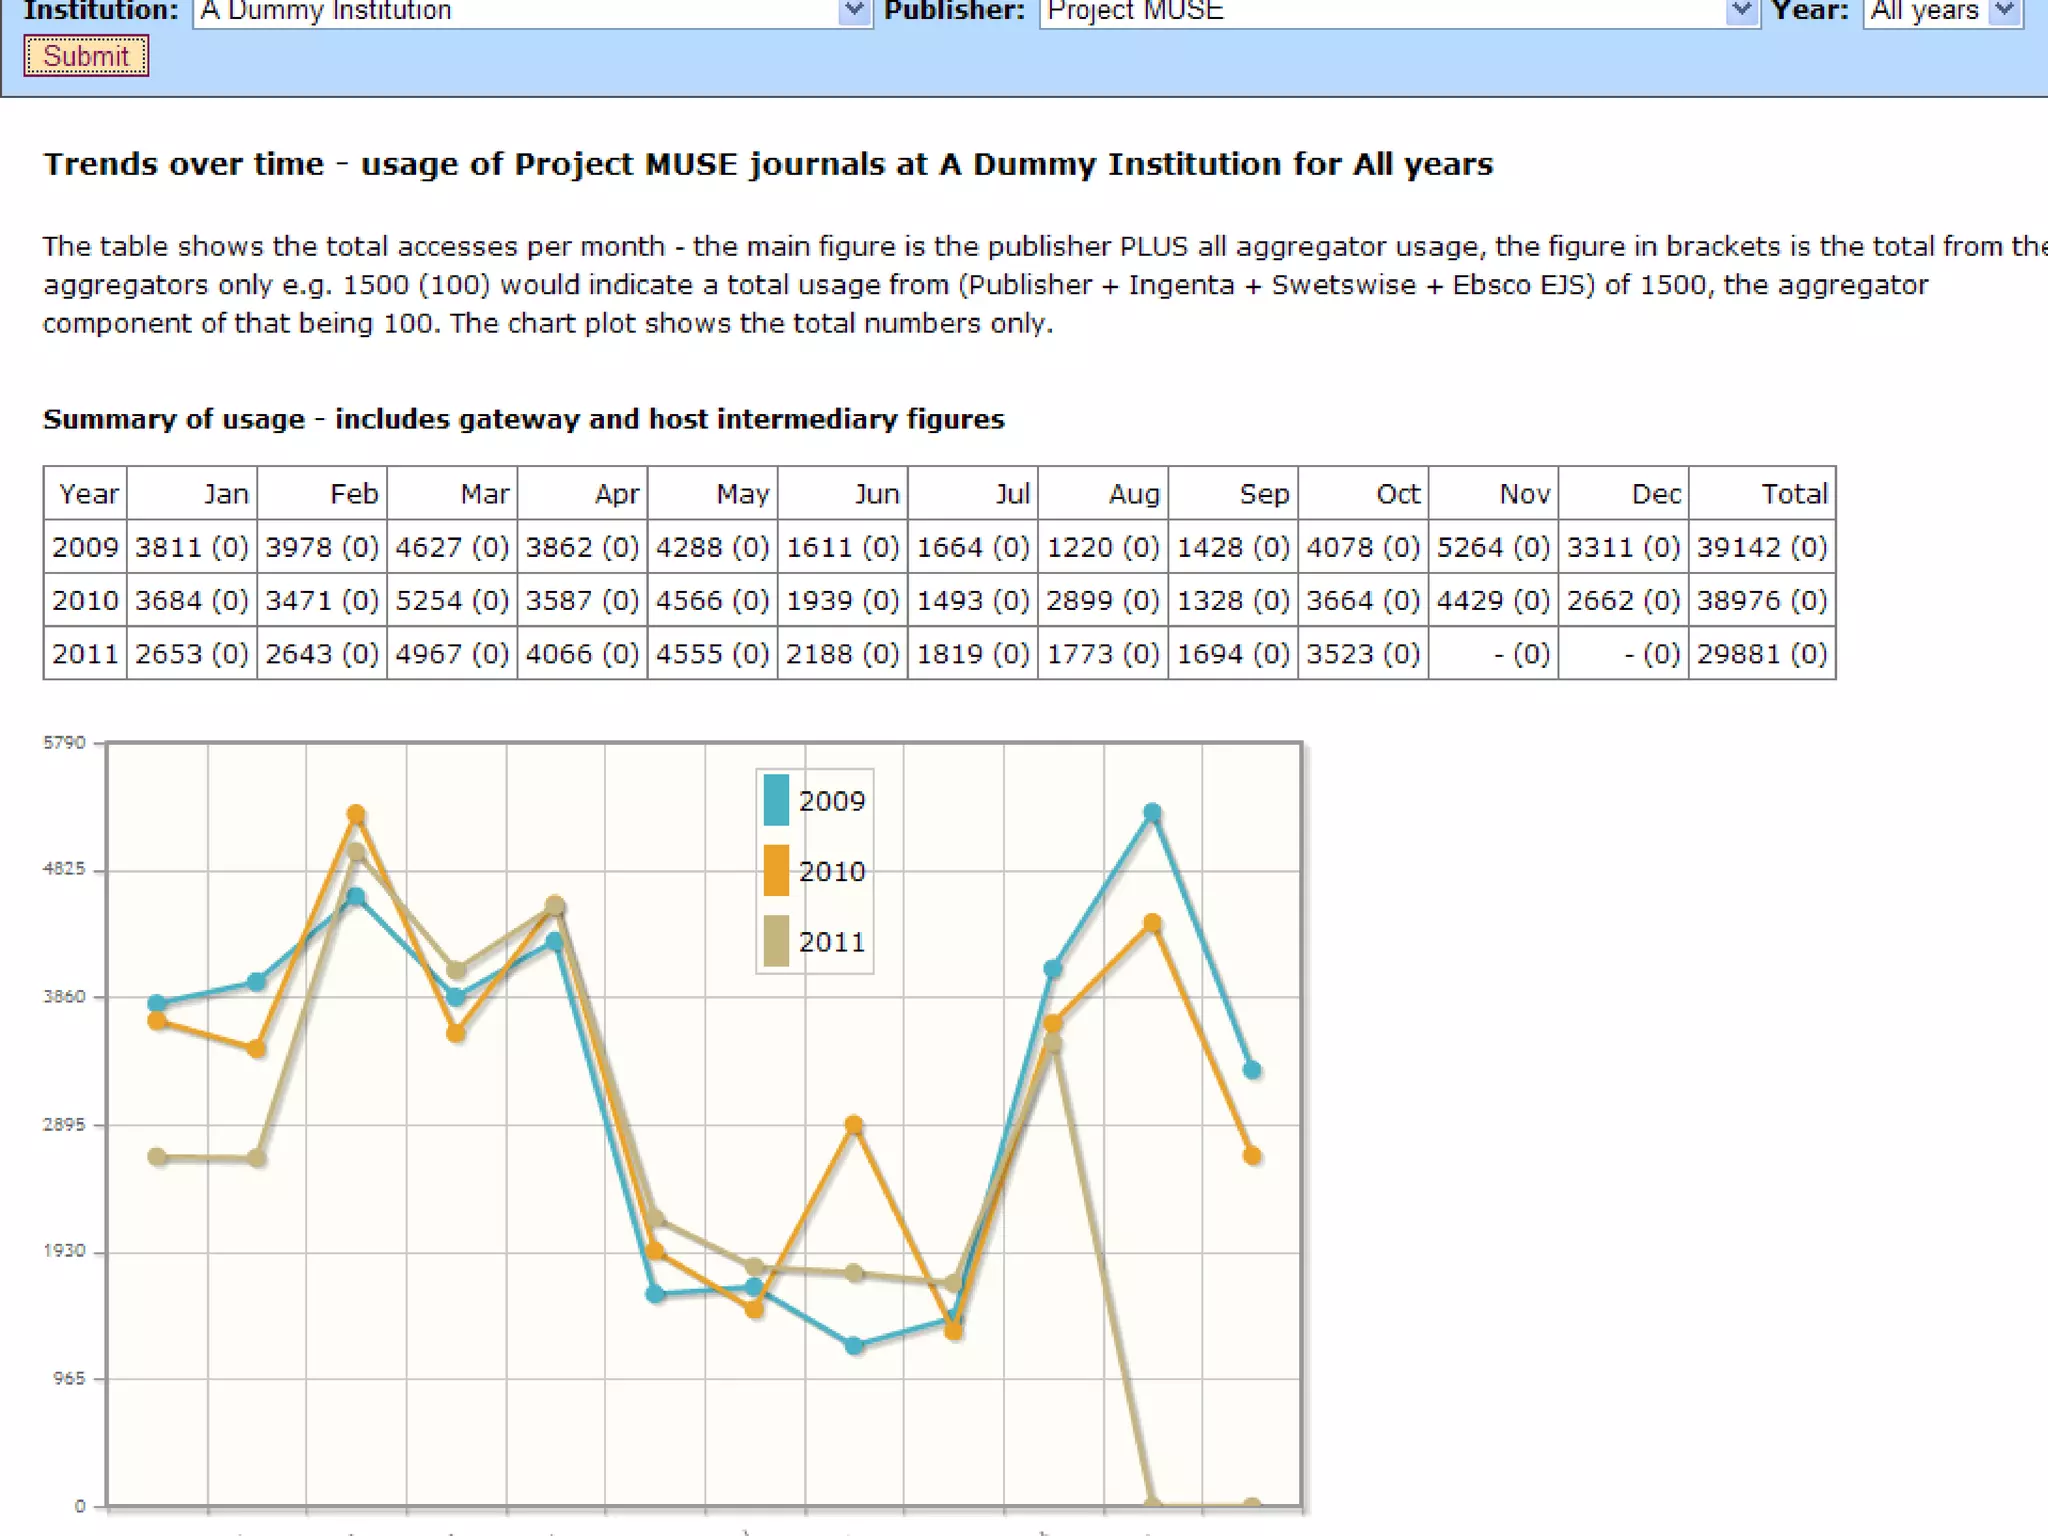
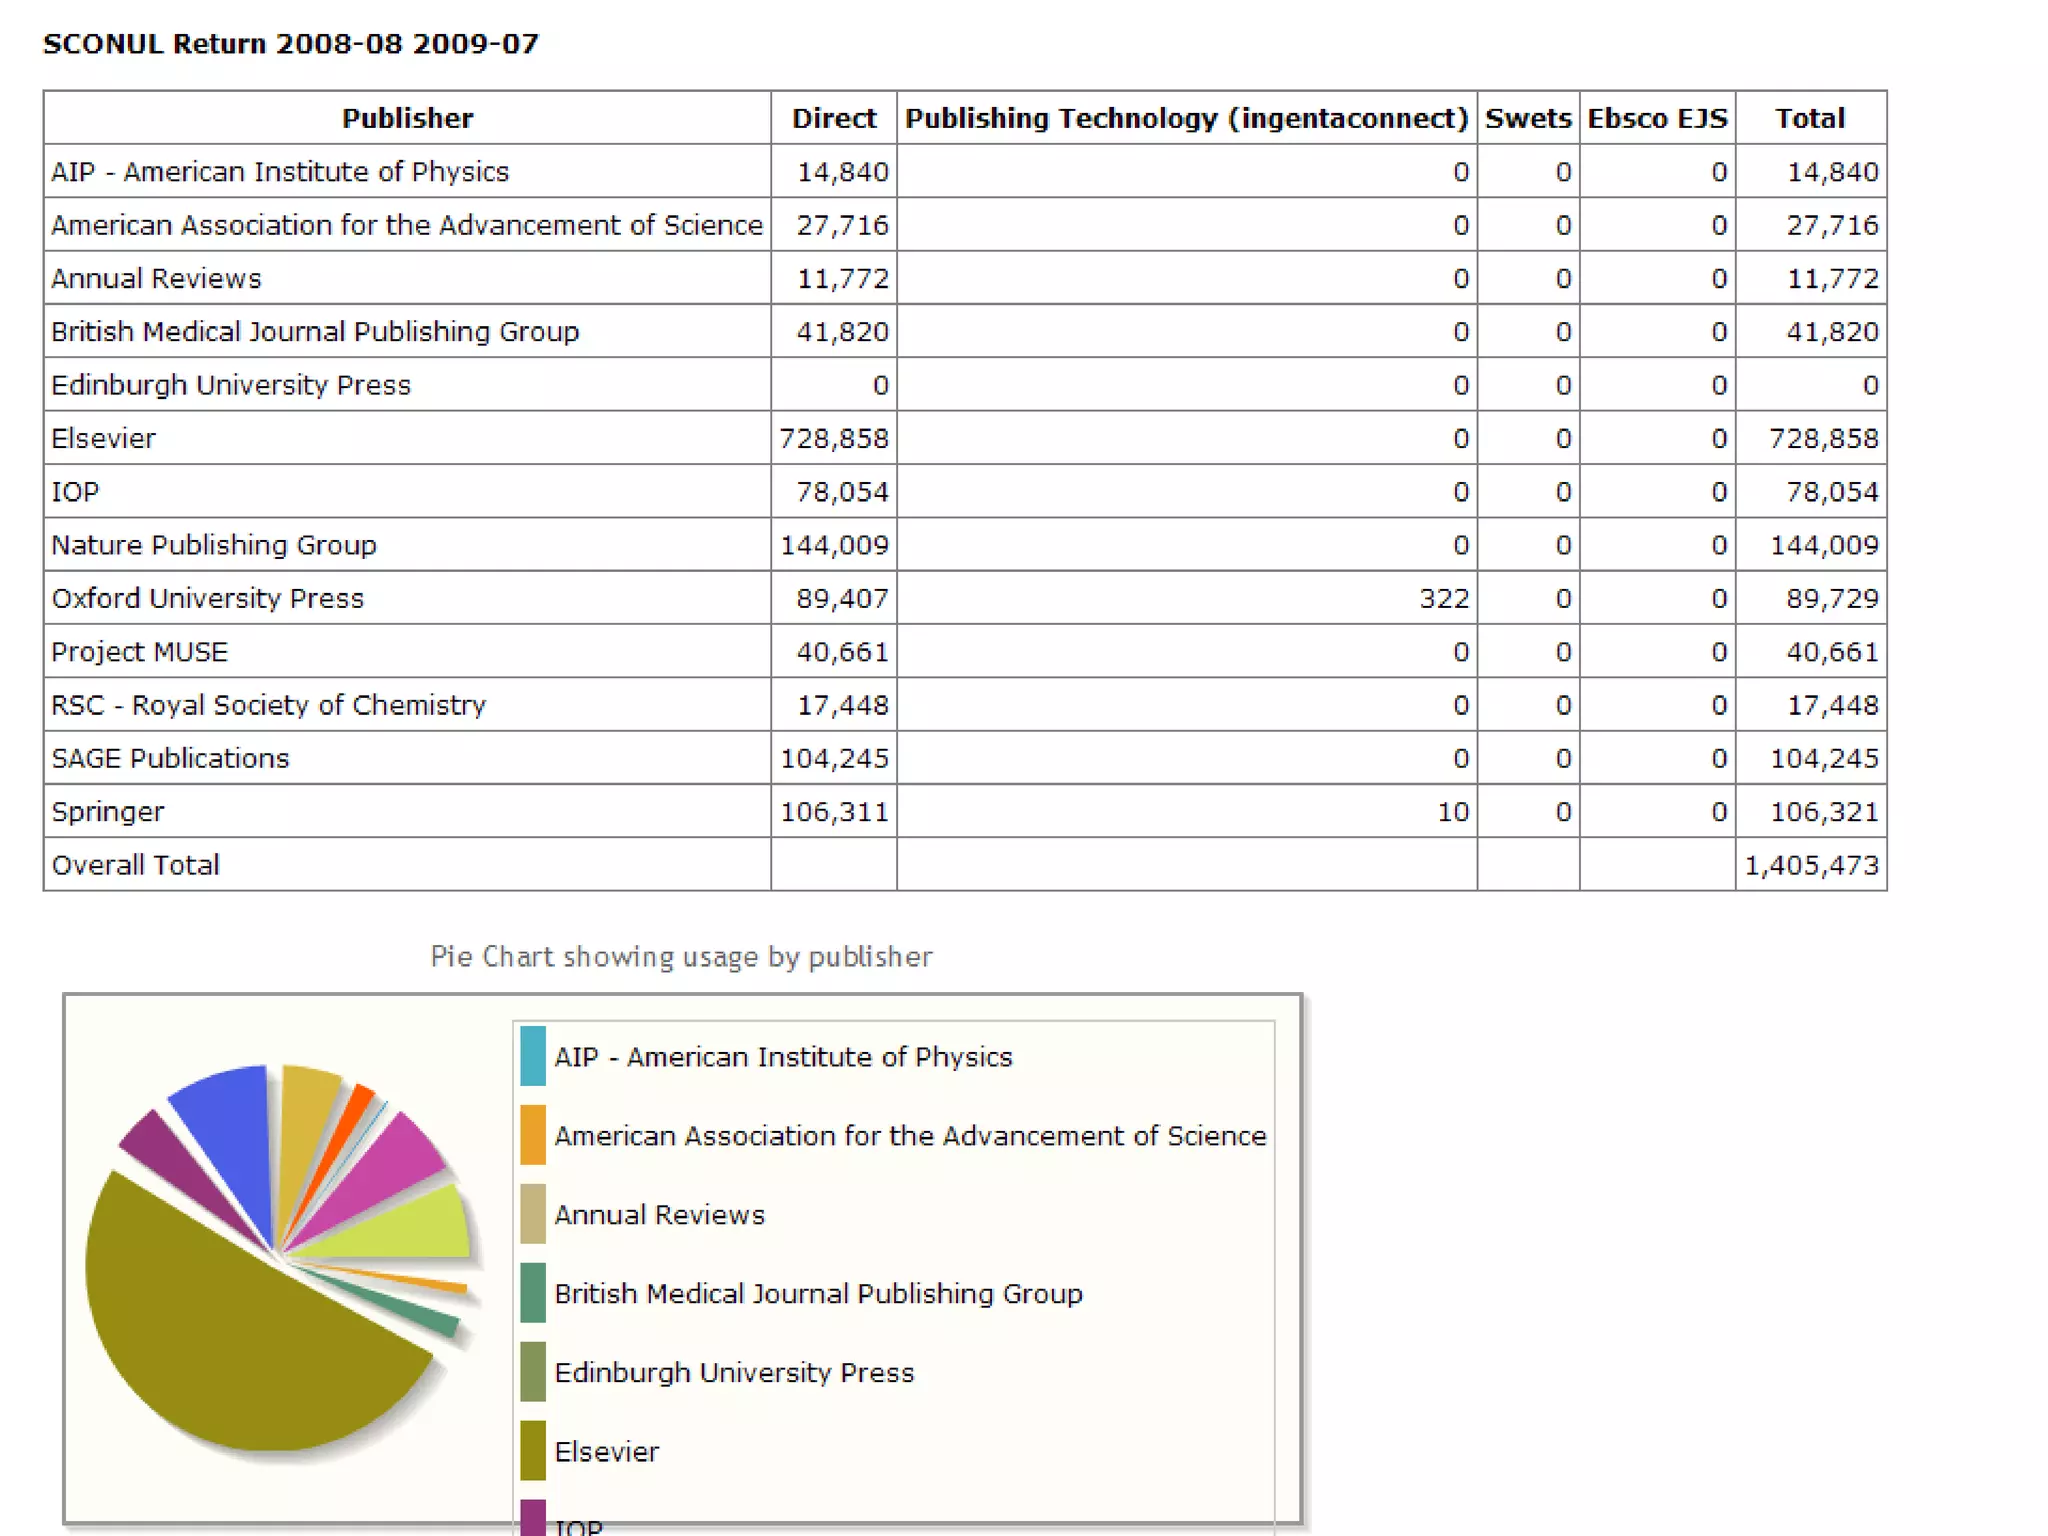


This document discusses the role of usage statistics in collection management. It explains that usage statistics provide essential evidence to show how e-resources are being used, look at trends over time, and inform renewal/cancellation decisions. Different audiences for usage statistics include library directors, academic staff, and subject librarians. The document also discusses standards like COUNTER for collecting usage statistics and initiatives like JUSP that provide a single point of access to usage data from multiple publishers.


