SlideShare a Scribd company logo
1 of 35
Download to read offline
Chapter Three
Spectrophotometry Instruments
If a beam of white light, passes through a glass cell (cuvet), filled with a clear liquid, the
intensity of emergent light (I) is less than that of the incident light (Io). The loss of
intensity is generally different for different wavelengths and hence the liquid appears
colored. This loss of intensity is mainly due to absorption in the liquid and the cell and
partially due to reflection at the two surfaces of the cell. In colloidal solutions, an extra
loss of intensity is due to scattering on suspended particles present, as shown in figure (3-
1).
Io
I
Figure (3-1) Loss of Intensity in a cuvet filled with a Colloidal Solution
There are three Methods used for chemical analysis, applying the spectrum, namely:
1) Absorptiometry: in which spectrographs and holographic films are used to measure
absorption of radiation caused by different materials.
2) Colorimetry: in which colorimeters are used in the visible region of Spectrum.
3) Spectrophotometry: in which spectrophotometers are used in any region of
spectrum.
3.1 Mathematical Theory of Absorption of Radiation by Solutions Beer's Law:
It deals with quantitative "treatment of absorption of radiant energy by solutions.
Consider a glass cuvet, with plane parallel surfaces, filled with a solution; consisting of
absorbing material (solute) dissolved in a nonabsorbing solvent. Neglecting reflections at
the surfaces and absorption in the glass cell itself, and using a monochromatic beam of
78
radiation of wavelength (λ), it was found generally that the loss of intensity of the beam is
directly proportional to the number of absorbing molecules in its path.
Beer's Law states that the fraction of radiant energy of monochromatic radiation
absorbed (dI/I) is proportional to the increment in the number of identical absorbing
molecules (dNs), traversed by the beam per unit area. Figure (3-2) shows successive
parallel layers of the absorbing solution normal to the incident beam. Applying Beer's law
on any of these layers, we get the following differential equations
= sK-
I
dI
Νδλ (3-1)
where:
(dI) is the element intensity absorbed by the element of absorbing molecules
(dN) in the layer
(I) is the Intensity of the incident beam, and (kλ) is a constant depending on the absorbing
molecules and wavelength (λ) of radiation. The (-ve) sign in the R.H.S. shows that (dl)
represents a decrease in the intensity.
Io It(I – dI)I
b
δNs
Figure (3-2) Loss of intensity in a Clear Solution
Integrating both sides of equation (3-1) for the whole quantity of solution in the cell, we
get,
s
NI
I
dNK
I
dI st
o
∫∫ −=
0
λ
s
t
NK)
I
I
(n λ−=
0
l (3-2)
where,
79
(Io) is the Initial Incident Intensity of the Beam of Radiation.
(It) is the Final Transmitted Intensity of the Beam of Radiation.
(Ns) is the Total Number of Molecules causing the Absorption per unit cross section area.
If the mass (m) of solute in the solution of cross sectional area (S), breadth (b), its
concentration is (C), then,
m = (Sb)C (3-3)
but,
The number of molecules of solute N = (No/M)m
= (No/M) (S bC) (3-4)
where (No) is Avogadro's number (number of molecules in the molecular weight of any
substance) which is the same for all substances (M) is the molecular weight of solute. So,
the number of molecules of solute per unit cross section area is,
NS = (No/M) (bC) (3-5)
And from equation (3-2), the Absorbance of the Solution (Aλ) defined by, )(
t
o
I
I
ogA l=λ ,
can be written in the form:
=
)(
)(
==
M.
)bC(NΚ
og
I
Ι
n
)/Iog (IA ot
o
to
3210
λ
l
l
l
bCabc}
M.
NK
A λ
o
={=
32
λ
(3-6)
The Absorbance of the Solution (Aλ) is characteristic of solution, depending on its
dimensions (breadth b), and its concentration (C), and varies with wavelength λ of the
monochromatic radiation used.
aλ is a constant called the absorptivity of the solution. It is characteristic of solution, and
varies with wavelength (λ). Equation (3-6) is the general form of Beer's law.
The Absorbance A λ is dimensionless and hence has no units.
The Absorptivity a λ = A λ /b C have the units given by:
[a λ] = [A λ,/bC] = [1/cm (gm/cm3
)] = cm2
/gm
80
Molar Absorptivity is defined as ξλ = aλ M , Its unit is (cm2
molecular weight/gm =
cm2
/mole).
Equation (3-6) can be rewritten in the following form:
cb
M
c
bMaA )()( λλλ ξ== (3-7)
Where,
M
C
c = is the molecular concentration.
Absorptivity (aλ) is used if the nature of the absorbing material and hence its molecular
weight is not known. Molecular Absorptivity ( λξ ) is preferred when comparing
quantitavely absorptions of different materials of known molecular weights. The
Transmittance is defined as,
nt beamthe incideofIntensity
beamdtransmottetheofIntensity
I
I
T
o
t
==
Then, )
1
(
T
ogA l= .
Theoretically, , but practically, , So, 3< A <0.00>>∞ A oto III <<−3
10
Beer's Law indicates that the absorptivity (aλ) is a constant independent of the
concentration (C) of the solution and the optical path length (b) through it and the
intensity of incident radiation (Io). It gives no hint of the effect of the temperature, the
nature of the solvent or the wavelength of radiation.
The effect of temperature is negligible, especially when the absorption of an unknown
solution is direct1y compared with a reference (solvent of the same solution of known
concentration), at room temperature.
When the temperature is varied over a wide range, it has a secondary effect as a result of
the slight variation of concentration with temperature due to the expansion of the
solution.
Effect of changing the solvent, cannot be predicted in any general way. The Analyst is
frequently limited to a particular solvent in which the material is soluble.
If Beer's law is not obeyed exactly for all values of concentrations, then the absorptivity of
81
a solution at constant temperature and the same solvent, may vary with concentration, to
either greater or smaller values. According to Beer's Law, the relation between
absorbance (Aλ) and concentration (C) must be a straight line through the origin as shown
in case figure (3-3) case (1), yet positive or negative deviations may be found as shown in
cases (2) and (3). Once the curve is obtained experimentally, it could be used as a
calibration curve from which the concentration of the solution could be obtained when its
absorbance is measured.
Absorbance
Concentration
1
3
2
Figure (3- 3) Beer's law (a) obeyed, (b)
positive deviation and (c) negative deviation
3.2 Applications of Beer's Law:
The logarithmic form of Beer's law allows the following important applications:
1- The total absorbance (AT) due to a series of solutions Transmitted by the beam of
radiation one after the other, as shown in Fig. (3-4), is given by,
)
I
I
.....().........
I
I
)(
I
I
(og)
I
I
(ogA
n
1n
2
1
1
o
n
o
T
−
== ll
)
I
I
(og.................)
I
I
(og)
I
I
(og
n
1n
2
1
1
o −
+++= lll
but the absorbance (A) of any solution, as shown in Beer's Law, given by:
82
CbaA λ=
then,
∑ ∑
= =
==+++=
n
r
n
r
rrrrnT CbaAA..............AAA
1 1
21 (3-8)
A1 A2 An
Io I1 I2 In-1 In
Figure (3-4) Absorbance due to (n) Solutions,
transmitted by Radiation one after the other
2- The Total Absorbance (AT) of a mixture of solutions which do not interact with each
other and contained in one cuvet:
Each solution, behaves as if it were the only solution present in the cuvet, therefore, the
total absorbance (AT) of the mixture of solutions can be explained as due to the
absorbance of each one of these solutions, taken one after the other, as in the last case:
(3-9)∑ ∑= =
==
n
1r
n
1r
rrrT CabAA
3- The absorbance of any solution can be considered as due to that of solvent and Solute,
so that,
Asolution = Asolvent + Asolute (3-10)
4- In the case of an impure solution, the absorbance can be considered as due to
absorbances of pure solution and impurity.
Aimpure solution = Apure solution + Aimpurity (3-11)
Therefore, the spectral absorbance distribution curve of the impurity, can be derived
83
from the corresponding curves of the impure solution and pure solution (obtained
experimentally), simply by subtraction of their Absorbances at each wavelength. Since
this curve is characteristic of its material, the material of the impurity can be deduced, as
well as its concentration can be calculated.
In the case of a certain mixture of (n) different solutions, which do not interact with each
other, at different concentrations, Beer's Law can be applied to determine the
concentration of each solution in the mixture, as follows: The spectral absorbance
distribution curves of each of these solutions at known concentrations, and that of this
mixture can be obtained experimentally. Applying Equation (3-9) at (n) different
wavelengths, we can formulate (n) simultaneous equations, from which the concentrations
of these solutions in this mixture can be determined, as shown in the following example.
Example (1):
Table (3-1) shows the values of the absorbance (A) of aqueous solutions of 3 samples at
given concentrations (C) in (mg/100 ml) and that of a certain mixture of these solutions at
certain wavelengths (λl), (λ2) and (λ3). Find the concentration of each of these samples in
this mixture.
Sample First Second Third Mixture
Concentration
(C) In Mg/100ml
2 3 4
ABSORBANCE (Λ)
at λ1
0.4 0.3 0.0 1.1
at λ2 0.6 0.0 0.4 1.4
at λ3 0.0 0.9 0.8 1.3
Table (3-1)
Solution:
To solve this problem, the following conditions must the satisfied:
(1) The ingredient solutions must not interact with each other i.e. each solution must have
84
its own entity in the mixture.
(2) The ingredient solutions must obey Beer's Law at the ranges of concentration under
consideration.
(3) The cuvets used for measuring the absorbance of each solution and that of the
mixture must have the same breadth (b).
Applying Beer's law for the Mixture and its ingredient solutions, at the given wavelength
(i) , we get:
i,3i,3i,2i,2i,1i,1i bCabCabCaA λλλλλλλ ++= and
i,r
i,r
i,r
C
A
ba
λ
λ
λ =
where,
i,rA λ is the absorbance of the solution (i) at wavelength λi
is the absorpitivity of the solution (i) at wavelength λi,ra λ i
obtained from table for each solution at the given concentration i,rc λ in the table.
Substituting the data given in Table (3-2), we get three equations:
1.1 = (0.4/2)Cl +(0.3/3)C2+(0.0/4)C3 = 0.2Cl +0.1C2 (a)
1.4 = (0.6/2)Cl +(0.0/3)C2+(0.4/4)C3 = 0.3Cl +0.1 C3 (b)
1.3 = (0. 0/2) C1 + (0. 9/3) C2 +(0.8/4)C3.= 0.3C2+0.2C3 (c)
Subtracting Equation (c) from Equation (b) multiplied by 2; we get:
(2 ×1.4 -1.3) = 2 × 0.3C1 - 0.3C2 + (2 × 0.1-0.2)C3
1.5 = 0.6 C1 – 0.3 C2 (d)
Fro (a) and (d),
Cl = 4 mg/l00 ml = 4(10-3
g/102
cm3
) = 4 × 10⁻⁵
gm/cm3
C2 = 3 mg/100 ml = 3 x 10⁻⁵
gm/cm3
Substituting into Equation (c) we get:
1.3 = 0.3 × 3 + 0.2 C3
C3 = (1.3 - 0.9)/0.2 = 2 mg/l00 ml = 2 × 10⁻⁵
gm/cm3
85
3.3 Detailed Spectral Absorption Distribution Curve:
It is clear that, for colored solutions, the absorbance varies with wavelength, and hence
absorptivity varies with spectral bandwidth used for its calculation. For example, figure
(3-5) shows the spectral molecular absorptivity (ξλ) distribution curve of Potassium
Permanganate Solution in water as obtained by Beckman spectrophotometer.
0
400
800
1200
1600
2000
2400
2800
400 440 480 520 560 600 640
A
B
CD E F
Wavelength, nm
ξλ
Figure (3-5) Absorption spectrum of Potassium Permanganate
in water solution; as determined on a Beckman DU spectrophotometer.
It appears purple due to its wide distribution of absorption. If an absorption
measurement on this solution using a green glass filter with transmission limits between
lines (A) and (F), the details of ups and downs of the absorption curve is averaged to ξλ =
1700 cm2
/mole. If the wavelength range was limited to the spectrum region, between lines
(B) and (E), the average ξ=2300 cm2
/mole. Reducing the wavelength band width to
spectral region between lines (C) and (D), the value of ξ = 2500 cm2
/mole. That is why, in
order to determine true absorption curve with full details, a spectrophotometer whose
86
monochromator isolates very narrow spectral wavelength bands of radiation must be
used.
Sometimes the shape of the spectral absorbance distribution curve, changes with
concentration. This means that such solution does not obey Beer's law, as for Potassium
Chromate Solution (K2Cr2O7).
3.4 Photometric Accuracy:
Even for a solution which shows no deviation from Beer's Law, the concentration range
over which accurate photometric analysis is useful, is limited at both high and low levels.
At high concentrations of absorbing material, little radiant energy will penetrate to the
detector, so that the photometer becomes less sensitive.
At low concentrations, the error in reading the meter or recorder, becomes large
compared with the measured quantity (the concentration).
In photometric instruments, the recording is proportional to the intensity of radiation
falling on the detector.
In measuring absorbance, (∆A/A) must be minimum for greater accuracy. Figure (3-6)
shows relative absorbance error (∆A/A) as related to transmittance (T= I/Io). Minimum
value of relative absorbance error (∆A/A) occurs at T = 0.368.
Practically the small range around this value is considered suitable for best photometric
accuracy, i.e. 0.15 < T < 0.65 or 0.8 > A > 0.2.
0
0
20 40 60 80 100
2
4
6
8
10
Percentrelativeerror
Percent transmittance
Figure (3-6) Relative error (∆A/A) as
a function of transmittance(%T)
87
3.5 Instrumentation In The Ultraviolet and Visible Regions of Spectrum:
As previously shown, the emission and absorption of the ultra violet and visible radiation
are due to electron transitions in the outermost orbits of the atoms, ions or molecules of
the absorbing substances.
For white light, the color of the liquid is usually the complement of that absorbed by the
liquid. Hence the color of the Liquid is important to the analytical chemist, since the
absorbed radiation is characteristic to the absorbing liquid.
White light (W) can be matched by (i.e appears to the eye as equivalent to) a certain
mixture of Red (R), Green (G) and Blue (B) Lights. This is shown by the following
symbolic equivalence:
(W) ≡ (R) + (G) + (B)
≡ (r + r) + (g + g) + (b + b)
where (r), (g) and (b) are parts of Red (R), Green (G) and Blue (B). Also the complement
of any color is defined by the following symbolic equivalence:
(White) = (Color) + (Its Complement)
This explains the symbols and hence the color names, given in the following Table (3-1)
showing the wavelength ranges and complements of the familiar colors known in our
everyday life.
Wavelength
Range (nm)
Color Complement
400-465
Violet (r+B)
Yellow Green
(r+g)+(g)
465-482 Blue (B) Yellow (R)+(G)
482-498 Blue Green (B)+(G) Red (R)
498-530 Green (G) Red Purple (r)+(r+B)
530-576 Yellow Green (r+g)+(g) Violet (r+B)
576-587 Yellow (R+G) Blue (B)
587-617 Orange (r+g)+(r) Greenish Blue (g+B)
617-800 Red (R) Blue Green (B+G)
Table (3-1):
Familiar Colors
and their
Corresponding
Wavelength
Ranges and
Complements
88
We are going now to discuss samples of different types of Instruments, namely:
(A) Visual Colorimeters.
(B) Filter Photometers.
(C) Spectrophotometers.
3.5.1 Visual Colorimeters:
In which eye is used to detect difference between samples. They are less expensive
and of adequate precision (absolute accuracy + 5%).
3.5.1.1 Nessler's Tubes:
It consists, of two similar tubes (A) and (B) of about 30 cm height, their lower ends are
closed by plane windows and illuminated by a uniform diffuse lamp. Tube (A) contains
the solution under test to a certain marked height, and tube (B) can be filled to the same
height by a series of the same solution of standard concentrations and small differences.
The two halves of the field of view are compared visually until the transmittance of the
sample in tube (A) is bracketed between two standard solutions (CR1) and (CR2) in tube
(B) of small difference in concentration corresponding to slightly darker and slightly
lighter appearance than that of tube (A). The concentration of the sample can be
estimated by interpolation between the corresponding values of concentrations of these
standard solutions.
3.5.1.2 Dubosco Comparator:
In which Nessler's tubes are used, but the height of standard solution of known
concentration is varied until the transmitted intensity of samples(S) and standard
reference (R) are equal as compared visually. This means that their absorbances are
equal, i.e.
AS = AR i.e. asbsCs = aRbRCR
But as = aR (the same solution), then Cs = CR (bR/bS)
89
3.5.2 Filter Photometers:
3.5.2.1 Photoelectric Colorimeter:
As shown in figure (3-7), Two identical light beams from an incandescent tungsten lamp
at the centre of curvature of a spherical concave mirror (M) and focus of a converging
lens (L), are reflected on (M), then collimated by (L), then pass through a Filter (F), then
focused by 2 small similar lenses (Ll) and (L2) on two matched Photo-Voltaic Cells (Pl)
and (P2), one beam through a cuvet (S) containing the sample, the other through a slit (S)
of adjustable width. The 2 Photo Voltaic cells, give potentials strictly proportional to the
Intensity of the light beams incident on them. They are shunted by 2 low value resistors
(R1) and (R2). The Resistor (R2) across the Reference cell (P2) is provided by a sliding
contact, connected to a sensitive galvanometer (G) to the upper end of Resistor (Rl). The
other two ends of Resistors are connected together.
Operation:
1-The cuvet (S) is first filled with the solvent, the sliding contact is adjusted to the Top
end of Resistor (R2) , corresponding to Maximum Voltage (V) representing 100%
Transmittance, and the width of Slit (S) is adjusted to balance the potentiometer system
giving zero reading of the galvanometer (G).
working
photocell PlFilter F
L L1
Figure (3-7)
2-The solvent is then replaced by the solution, so, the extra absorption due to the solute
decreases the potential difference across the shunt (Rl) across the Working Photo Voltaic
Reference
photocell P2
S
R1
R2
M
Lamp
L2
G
-cuvet
+
+
-
90
cell and hence disturbs the balance of the galvanometer. The sliding contact across the
reference Photo Voltaic Cell is adjusted to restore the balance of the galvanometer (G).
The reading of the linear scale of the slider gives directly the percent transmittance, i.e.
Io α Vmax and I α V
then T = I/Io = V/Vmax =L/Lmax
3-The filter (F) is changed, and the procedure is repeated for different wavelengths across
the visible spectrum. The filter (F) may be colored glass (giving wide spectral band), or
interference filter (giving narrow spectral band), as suitable.
The photoelectric colorimeter is used in clinical laboratories. Its best precession is ± 3%.
3.5.2.2 Dupont 400 Photometric Analyzer:
It consists of a system of building block compartments that can be-arranged in different
schemes.
The arrangement shown in figure (3-8), is used to compare absorbances of two different
samples at same wavelength.
A beam of parallel rays of light, from a uniform diffuse light source passes through the
interference filter at wavelength (λ), which is varied to scan the visible spectrum, and is
then split into 2 beams, by a semisilvered glass plate at 45° to the direction of incident
beam, transmitting half of the incident intensity of light and reflecting the other half, at
right angles to each other.
One beam passes through the reference sample (R), the other beam passes through the
measuring sample (S). The two beams then fall on 2 similar vacuum photo cells whose
outputs (strictly proportional to the intensities falling on them [Ir] and [Is]), are amplified
logarithmically (by operational amplifiers), then feed an electronic difference circuit so
that the meter reads directly the difference of absorbances;
rs
r
o
s
o
sr AA)
I
I
og ()
I
I
og ()og (I)-og (I −=−= llll ;
91
Half-silvered
mirror
Interference
filter
Lamp
Reference
Difference circuit
Logarithmic
amplifiers
Measuring
sample
Sample
photocell
Reference
photocell
Figure (3-8) Schematic representation of the Du Pont 400
Photometric Analyzer
If the reference contains solvent and the sample contains the solution, the meter reads the
absorbance of the sample as referred to the solvent. It can be calibrated to read directly,
the concentration of the solution, if it obeys Beer's law.
3.5.3 Spectrophotometers:
There are two types of Spectrophotometers:
(a) Single Beam, and (b) Double Beam.
3.5.3.1 The Single Beam Spectrophotometers:
The single beam type requires interchange of sample and reference liquids at each
wavelength, and hence is more suitable to manual operation.
1. Bausch and Lomb Spectronic 20:
It is widely used for visible spectrum (wavelength range from 340 to 625nm which can be
extended to 950 nm, by changing the photocell).
92
Figure (3-9) shows the optical Design of the spectrophotometer. It is not a Littrow Type,
since the lens is not traversed twice.
A divergent beam from the lamp is condensed by lens (L1) on the entrance slit (Sl). A
divergent beam from (Sl) is made slightly convergent by lens (L2) to fall on plane
reflection grating (G) of 600 Lines /mm, through to focus on the exit slit (S2). This gives
less degree of monochromaticity (spectral wavelength band about 20 nm = 200 A). The
reference and the sample are placed alternately in the path of the beam after the exit slit,
before falling on the measuring gas filled photoelectric cell whose output is passed in a
special amplifier compensated to reduce its nonlinearity. Lamp intensity fluctuations due
to instability of voltage of power supply, give varying deflections causing inaccurate
results. This can be corrected by an electronic voltage regulator by using an auxiliary
photocell to monitor the lamp directly. Overlapping orders due to diffraction grating is
corrected by using a blocking filter (used only with the infrared phototube) placed in
between the exit slit (S2) and the cuvet containing the sample or reference.
Spectronic 20 is an easily operated spectrophotometer, and relatively inexpensive and is
used where a filter photometer would serve equally well.
L1
L2
G
Blocking filter
Sl
S2
Measuring
Photoelectric cell
Reference
Photoelectric cell
Sample
Mask
Lamp
Figure (3-9)
Optical diagram of the Bausch & Lomb Spectronic-20 spectrophotometer.
(2) Beckman Model Du Spectrophotometer:
It is very widely used for visible and ultra violet regions in both theoretical and analytical
93
purposes.
Carriage bearing
for cuvets
M1
P
S
M2
Lamp
Semisilvered
plate
Photoelectric
cell
Figure (3-10) Optical system of the Beckman DU spectrophotometer
Its optical system, as shown in figure (3-10), is of the classical Littrow type using a 30°
silvered back prism. It has interchangeable Tungsten and Hydrogen (or Deuterium)
lamps for visible and ultra violet spectral regions and suitable photo tubes as required to
cover this complete range of spectrum. A photo multiplier is available to increase the
sensitivity of the spectrophotometer.
Semi silvered glass plate reflects the incident beam, deflecting it through 90° and
transmitting the dispersed beam into the Detector through the sample or reference.
The spectrum extends down to a lower limit of 210 nm by using natural Quartz prism,
and this is opened down to 165 nm by using optical quality vitreous Silica prism. The
upper limit of spectrum extends to about 650 and 1000nm.
The fluctuations which appear in the intensity of the source of radiation due to lack of
regulation in the voltage of the power supply, and aging of the lamp and other
components, cause error in single beam spectrophotometer. This can be reduced by using
voltage regulating transformer or by using a photocell to monitor the intensity of the
lamp.
3.5.3.2 The Double Beam Spectrophotometer:
In the double beam type, one beam crosses the reference, the other crosses the sample
simultaneously and is hence more suitable for automatic recording. Also, the double beam
94
design is the most effective way to eliminate the effects of source variations. An example is
the type Jasco /V-560, (range 109 – 900 nm), as shown in figure (3-11). Radiation from
Halogen lamp (W) (for Visible and near Infra Red Region) and Deuterium Lamp (D2)
(for ultra violet spectral region) enters the double grating monochromator through the
entrance slit -(S1). The dispersed monochromatic beam from the exit slit (S2) is directed to
rotating (mirror-opening) sector disk (RS) for splitting and chopping. The two time
alternating beams are reflected alternately via plane mirrors (m4), (m5). One beam passes
through reference cuvet (R) contains the solvent and the other through sample cuvet (S)
containing the sample. Mirrors (m), (m), and (m) and the alternating mirror (AM) are
used to combine the two beams on the photomultiplier detector (PM). The pulses of
radiation from the two paths are out of phase, so that the photomultiplier tube receives
radiation from one beam at a time. The Electronic system receives the output from the
photomultiplier and split it into two electrical signals of intensities corresponding to the
two optical beams through reference (Io) and Sample (I), fed into a comparator giving
their ratio (I/Io), either directly as Transmittance (T) or logarithmically [Log (Io/I)] as
Absorbance (A). An A/D card and a computer system is used to built in data and plots for
either spectral transmittance (T) or Absorbance (A) distribution Curve against (λ)
direct1y.
Since the radiation is dispersed before incidence on the samples, photochemical
decomposition is avoid when operation is in the ultra violet spectral region, also, this
minimizes fluorescence effects.
Chopping the radiation into successive pulses has the advantage that the electronic system
sort out-signals to the two channels excluding unwanted signals (unchopped radiation) by
tuning the amplifier to respond only to signals modulated at the chopping frequency.
The V-560 has the advantages of reduced stray radiation (below 0.0003%) and high
resolution (bandwidths up to 0.1 nm).
There are double beam spectrophotometers with only single stage monochromator (only
one grating). These are less expensive, but suffer from stray radiation (overlapping
orders) which passes from the monochromator to the exit slit but is not within the
wavelength band for which the monochromator is adjusted.
95
PM
AM
m10
G1
S1S2
G2
W
D2
RS
m4
m3 m2
m1
m7
m9
m8
m5
m6
SR
Figure (3-11) double beam spectrophotometer
Type Jasco/ V-560
Let (Io) be the intensity of the two similar beams falling on the cuvets containing the
sample(S) and reference(R), (IS) and (IR) are the intensities transmitted from the sample
and reference, respectively, then,
The Absorbance of the sample = AS = Log (Io/IS)
The Absorbance of the reference = AR = Log (Io/IR)
96
AS- AR= Log (Io/IS)- Log (Io/IR)= Log (Is/IR)
If the reference is the solvent and the sample is the solution, then, A = (AS - AR) is the
corrected absorbance of the sample with respect to the solvent. Since (Io) is the same for
the two beams which in this case is not the intensity of the incident beam from the source,
then, reasonable changes in the lamp intensity do not affect the measured absorbance
value.
3.5.3.3 The Double Wavelength Spectrophotometer:
In which two beams of radiation of different wavelengths can be used. Figure (3-12)
shows a recent optical design of a double wavelength spectrophotometer. Radiation from
Halogen lamp (W) (for Visible and near Infra Red Region) and Deuterium Lamp (D2)
(for ultra violet spectral region) is brought to focus at the Entrance Slit(S1) by concave-
mirror(Ml), after being divided into two identical parts (I1) and (I2) by a mask (M) with 2
identical and symmetrical windows. These two parts are collimated by concave mirror
(M2), whose focus is at (S1), and then fall on two separate gratings mounted on two
independent turn tables. The two diffracted parts at different wavelengths (λ1) and (λ2)
are brought to focus by a concave mirror (M3) on the exit slit (S2) at its focus. They are
then split into two paths by plane mirrors (m1), (m2) and (m3), through the sample (S), or
mirrors (m'
l), (m'
2) and (m'
3) through the reference (R), then combined and brought to
focus, by concave mirrors (M4) and (M4) on the Photo Multiplier Detector (PM). The
Rotating Chopping Disc (CD) allows the two beams of different wavelengths to pass
alternately in the two optical paths to the Detector. An A/D card and a computer system is
used to built in data and plots for different outputs.
97
PM
G1
S1
S2
G2
m'
2
m3m2
M2
S
R
M4
M5
m'
3
m1
m'
1
M3
M1
Mask
D2
S
PM
F
Figure (3-12) Double wavelength spectrophotometer
(a) First arrangement (b) second arrangement
There are two optional positions of the sample cuvet:
1. The primary position: A Blocking Filter (F) and the sample (S) are in contact with the
photomultiplier, which is used when the two wavelengths are to pass through a single
cuvet. The blocking filter is used to correct for overlapping orders due to each of the two
gratings
2. The secondary position: which is shown in the main figure, in which double beam
passing in the two cuvets, one containing the sample (S), and the other containing the
reference (R).
Uses of the double wavelength spectrophotometer:
1- It can be used to measure two components of different wavelengths (λ1) and (λ2),
without scanning, recording their variation with time. In this case the rotating chopping
98
disc and the reference and sample cuvets are removed. The detector receives the sum of
the two beams (Il and I2) at wavelength (λ1) and (λ2); simultaneously, or separately using a
blocking filter.
2-One Wavelength (λ1 = λo) is fixed at a point of negligible (minimum) absorption for the
sample under test, while the other (λ2 = λ) scans the spectrum, thus used as double beam
operation with single cuvet only.
3-For Colloidal solutions of heavy turbidity, it can be used in the same procedure as in
case (2). Since the optical path in the solution is uncertain due to scattering of rays on
suspended matter and its Brownian motion, this arrangement ensures that both beams
follow the same path, whatever, it may be.
4-It can be used as a derivative spectrophotometer. In this case the two wavelengths (λl =
λ) and (λ2 = λ + ∆λ) scan the spectrum in the same time, such that (∆λ) is a small constant
wavelength difference. The resulting spectrogram gives (∆A/∆λ) versus (λ), where (∆A) is
the difference between the absorbances of the sample at these wavelengths and (λ) is their
mean wavelength.
5-It can be used as an ordinary double beam spectrophotometer, for the sample and the
reference. This can be done by adjusting the 2 turn tables of the gratings to scan the
spectrum such that λl = λ2 = λ and using the secondary (sample – reference) arrangement.
This arrangement corrects for the fluctuations of the source intensity.
In all these uses, except the first, the rotating chopping disc feeds the Photomultiplier,
alternately with 2 Light Signals I1 and I2. The electronic system splits the output from the
photomultiplier into two corresponding separate signals, feeding a comparator and then a
computer system, which gives their ratio (T = I1/I2) or logarithmically as Absorbance (A)
or as Absorbance Increment (∆A).Also, different plots for any of these functions versus
the wavelength (λ) can be obtained.
3.5.4 Sources OF Radiation In The Ultraviolet and Visible Regions of Spectrum
(a) Tungsten Lamp:
Tungsten Filament Incandescent Lamp is an excellent spectrophotometric source through
the Visible and adjacent parts of Ultra Violet and Near Infra Red.
99
(Wavelength Range:320 ≤λ≤3500nm).
Its life time at high temperature can be extended by filling the lamp with Iodine vapor at
low pressure. Iodine reacts with vaporized tungsten such that tungsten atoms redeposit on
the hot filament rather on cooler parts of the bulb. The envelope of the lamp is made of
quartz to permit operating the lamp at higher temperature and to allow transmission of
the Radiation in the Ultra Violet and Infra Red Spectral Regions.
(b)Hydrogen and Deuterium lamps:
Hydrogen (1H1) and Deuterium (1H2) discharge lamps are universally employed for ultra
violet region of Spectrum, giving wavelength range 160 < λ < 360 nm. The Deuterium
lamp gives higher intensity and longer lifetime expectancy than Hydrogen lamp.
3.6 Instrumentation in the infra-red region of spectrum
The absorption in the infra red (I.R) region of spectrum will be treated separately in this
section for the following reasons:
(1) The optical systems are different. There are no spectrophotometers which cover
both infra red and ultra violet & visible regions without modifications.
(2) The physical nature of the absorption of infra red radiation is different from that of
the shorter wavelengths (U.V. and Vis.).
(3) I.R. spectra are usually plotted as percent transmittance in contrast with U.V. and
Vis. spectra shown as absorbance, and hence absorbance bands appear as dips in
the former case and peaks in the latter case.
3.6.1 Origin of I.R radiation:
The absorption of infra red radiation is due to increasing the energy of vibration or
rotation of covalent bonds, which changes the dipole moments of the molecules of
absorbing substances. All molecules containing covalent bonds show some selective
absorption in the I.R region of spectrum. The only exceptions are the diatomic element
gases e.g. Hydrogen (H2), Nitrogen (N2) and Oxygen (O2), since their molecules have no
100
vibrations or rotations which produce changes of their dipole moments.
It is well known that the molecules of covalent bonds consist of equal and opposite electric
charges (+q) and (-q) (since they are neutral), at a short distance (d) which are
represented by electric dipoles (as shown in fig. (4-1), of dipole moment (P), given by:
p =q d (4-1)
As previously shown, the electro magnetic radiation, consists of simple harmonic
oscillations of mutually perpendicular electric (E) and magnetic (B) fields, giving rise to
transverse waves propagating at normal direction to both fields. When the molecular
dipoles are affected by incident radiation in the infra red region of spectrum, they are
acted upon by vibrations and rotations which change their dipole moments (as shown in
figure (4-2), causing selective absorption, which is characteristic of the substance of the
absorbent. Infra red absorption of poly atomic covalent compound is very complex,
consisting of many narrow absorption bands, in contrast with broad band absorption in
the U.V. and Vis. regions of spectrum due to the interaction between absorbing molecules
and their environment.
Figure (4-1) Figure (4-2)
Electric dipole (molecule of covalent bond) oscillations of electric dipole in an
Electromagnetic radiation:
Fv =Vibrational Fr = Rotational
3.6.2 Instrumentation:
Most infra red spectrophotometers have the same basic designs as those used for U.V.
and Vis., modified to allow for the differences in optical materials. There are two other
types based on more complex methods which will be studied later.
-q
d
+
+q
-
E
+
+q
-
-q
F=qE
F=qE
Fv
Fv
F
Fr
r
101
3.6.2.1 Optical materials:
(1) In I.R. spectrophotometers, lenses are usually replaced by concave mirrors (highly
polished metallic surfaces), since, as previously mentioned (in chapter 2), the mirrors do
not suffer from absorption and chromatic aberration, and are easier to manufacture and
mount.
Dispersive prisms, sample cells (cuvets) and radiation windows (protective covers over
slits and detectors), must be made of solid materials, transparent in the wavelength
region of interest, as shown in table (3-2). It is noticed that several of these materials are
soluble in water, and hence when used must be carefully protected from moisture.
A prism of that type, when used must be placed in an air tight compartment, provided
with a desiccant to absorb any moisture.
Aqueous solutions cannot be placed in cells with salt windows. Salt cells must be stored
in a desiccator.
Also water absorbs I.R. strongly so that it cannot be used as solvent.
Material Limiting (λ) in (μm ) Material Limiting (λ) in (μm )
optical glass 0.40 → 2.6 Ge 18.0 → 23
vitreous silica 0.16 → 4.0 Na Cl 0.20 → 25
Li f 0.12 → 9.0 K Br 0.25 → 40
Ca f2 0.13 → 12.0 Cs Br 0.2 → 55
Si 1.20 → 15.0 K Rs 0.55→ 40
Table (3-2): Infra red transmitting solid materials.
3.6.2.2 Sources:
(a) Tungsten filament lamp with iodine vapor filled quartz bulb is satisfactory for near
I.R. Its emission wavelength range is 320 ≤ λ ≤ 3500 nm.
(b) Nernst glower is the most widely spectrophotometric source in the I.R. region of
102
spectrum. It consists of a rod or a hollow tube, about 2 cm long, 1 mm diameter, made of
oxides of such elements as cerium, zirconium and thorium. It is heated electrically to
high temperature, and can be operated in air since it is not subject to oxidation.
(c) Globar: is a rod of silicon carbide of larger dimensions than Nernst glower, operated
at lower temperature; to avoid oxidation, and cooled by forced ventilation, because of
the tendency of over-heating at the terminals. It has greater emissivity than the glower at
wavelengths beyond 30 μm.
(d) Simple coil of nichrome wire: is used if the required wavelength range of interest is
not too high.
3.6.3 Infra-red spectrophotometers:
3.6.3.1 Beckman infra red spectrophotometer:
as shown in figure (4-3), I.R. radiation from source (which may be a Nernst glower or
Nichrome wire), is reflected by two similar sets of mirrors forming two symmetrical
beams, one passing through the sample cell (s) the other through the reference cell (R),
then they are reflected by two further sets of mirrors to be focused alternately on slit (S1)
by means of a mirror driven circular chopping disc (C) (half reflecting and half cut off as
shown in figure. (S1) is the entrance slit of a reflection diffraction grating (G). Anther
version is provided with Littrow monochromator consists of a 60° prism and a mirror
combination instead of the grating.
103
Figure (4-3) Beckman infra red spectrophotometer
S1
S2
D
C
SR
F
N
G
The selected wavelength, by the monochromator, passes through exit slit (S2) and is
brought to focus on the thermocouple detector (D), which receives alternately, two square
waves whose amplitudes correspond to the intensities of the two beams from the sample
104
and reference. Plots for percentage transmittance are obtained using a plotter, or the
output is rooted to an amplifier and a computer to analyze the results.
In modern versions two gratings are used to give the desired resolution over the whole
range of I.R spectrum, the first grating has 3000 lines/cm is slowly rotating to scan the
spectrum between wavelengths 2000 to 5000 nm, when reaching wavelength 5μm the
grating table automatically turns to bring the second grating (1000 lines/cm) into position
resuming scanning the spectrum to cover the wavelength range from 5000 to 16000 nm.
Both gratings are operated in the first order and hence four filters (F) are required to
eliminate higher orders.
4.3.2 Interference spectrophotometer:
Radiation energy consists of trains of electro magnetic waves of different frequencies
superimposed. Instantaneous electric and magnetic fields at any point are the resultant of
these fields at individual frequencies. In principle full information carried by the beam
could be obtained by plotting the response of the detector with time. The frequency of
radiation being of the order of 1014
Hz, is too fast to be followed by any known detector.
This speed difficulty could be overcome by using an interferometer.
Figure (4-4) shows Michelson interferometer used in I.R spectrophotometer. A beam of
light from the source is collimated by lens (L) and then divided into two equal parts by
means of a beam splitter (B.S.) (semi silvered glass plate) at 45° to the beam, reflecting
half of the incident intensity and transmitting the other half at right angles to each other.
The two beams are reflected back by mirrors (m1) and (m2) perpendicular to them, and
then partially transmitted and reflected by the B.S. to fall finally on the detector (D) as
one beam. If the two mirrors (m1) and (m2) are at the same distance from the B.S., the
detector will receive the same original time varying electromagnetic fields (without the
interferometer), but at half its intensity. If mirror (m2) is moved to the down, the phase
difference between the two beams reaching the detector will change and interference
results. The change in phase due to a given change in the path depends on the wavelength
of the radiation and is shown by the detector in the form of maxima and minima.
105
Figure (4-4) Michelson interferometer, as used in a Fourier transform spectrophotometer.
m2
IR Source
m1
M
B.S
To detector (D)
Mirror (m2) is moved to and fro at a constant speed, for distances of few mms (much
longer than wavelengths). If the radiation is monochromatic (λ), figure (4-5a) shows the
output to the detector for one scan of mirror m2. Only a line of wavelength (λ), is output
during the scan period at certain position of m2 when the two beams of (λ) interfere
constructively.
Figure (4-5b) shows the output to the detector, when the radiation consists of two colors
(λ1) and (λ2). In general, different frequencies of I.R spectrum produce an output
interferogram, containing all spectral information of original radiation.
λ λ1
λ2
One scan One scan
Figure (4-5a) Figure (4-5b)
Figure (4-6) shows the optical design of the Fourier Transform Infra Red (FTIR)
spectrophotometer. A beam of radiation from the I.R source is collimated by concave
mirror (m1) to fall on Michelson interferometer, where it is split into two beams of equal
intensities by the beam splitter (B.S.), at right angles to each other, and then they are
reflected on their optical paths by plane mirror (m1) and oscillating plane mirror (m2). The
106
two beams are reunited by beam splitter (B.S.), to fall on plane mirror (a), then split into
two alternate parallel beams by oscillating plane mirror (O.M. 1). The two beams are then
focused by concave mirrors (M2) and (M'
2) to fall alternately on sample (S) and reference
(R), then reflected on plane mirrors (m3) and (m'3) to the oscillating plane mirror (O.M. 2),
where the two alternate beams take the same optical path, to be focused by concave mirror
(M3) on the detector (D) to the amplifier and fed to the computer to analyze the results.
m'
3
M'
2
O.M. 1
R
m2
D
IR Source
m1
m3
M2
M3
M1
S
B.S.
computer
O.M. 2
Amp
mA
Figure (4-6) shows the optical design, of a Fourier Transform spectrophotometer,
model FTS-14, simplified. (digilab, inc.)
For one complete scan of mirror (m2), the detector response fluctuates at a rate depending
107
on the speed of motion of the mirror (m2) and wavelength of radiation transmitted from
the sample and reference. The resulting interferogram is a Fourier transform of the
spectrum and can be interpreted by a the computer which gives the inverse Fourier
transform and this shows full details of the radiation at each wavelength.
Interferometric or Fourier transform spectrophotometry has great advantages over
classical techniques, namely,
(1) It uses all frequencies from the source simultaneously, rather than taken them one
after the other as in the classical instruments.
(2) It increases the sensitivity because of the large amount of radiation entering the slitless
instrument.
3.7 Chemical Applications:
The absorption of radiation energy in the ultra violet and visible spectral regions is due to
transitions of the outermost electrons of the absorbing molecules or ions. This depends
primarily on the number of electrons and hence their arrangement in these molecules or
ions.
3.7.1 Qualitative Analysis:
Ultra violet and visible spectral energy absorption provides a useful source of supporting
evidence of structures of organic compounds. Selective absorption is insufficient to serve
as an identifying finger print for a particular structure, but it may serve to rule out a
number of useful correlations between wavelengths of absorption maxima and the
structures have been determined. The measured absorption maxima for an unknown can
be compared with determined values for various possible structures.
3.7.2 Quantitative Analysis:
(1) Beer's law as expressed by equation (3-6) is widely applied for quantitative chemical
analysis of an absorbing substance which obeys this law, if no other material is present to
interfere or if interfering material can be removed or corrected using the additively
property of absorbance as expressed by equation (3-9).
(2) The absorbance of any solute on knowing the absorbances of the solution and the
108
solvent, using equation (3-10).
(3) The spectral absorption distribution curve of the impurity on knowing that of the
pure solution and obtaining that of the impure solution, using equation (3-11).
(4) The total absorbance due to a series of solutions or filters transmitted by a beam of
radiation one after the other by using equation (3-8).
(5) The analysis of certain mixtures of different solutions, which obey Beer's law and do
not interact with each other, leading to determination of the concentrations of the
ingredient solutions in the mixture as in example (1).
109
Problems
(1) a particular sample of colored solution which obeys Beer's law, shows 80%
transmittance when measured in a cell 1.0 cm breadth, find:
(a) The percent transmittance for the .same solution of twice this concentration in the
same cell.
(b) The breadth of the cell giving the same transmittance for a solution of twice the
original concentration.
(c) The percent transmittance of the original solution when contained in a cell of 0.5 of
breadth.
(d) The absorptivity (a) of the solution if the original concentration was 0.005%
[T = 64%, b=0.5 cm, T'= 89.44%, a = 1938.2 cm2
/gm]
(2) The following table, shows the recorded intensities transmitted through solvent (I)
and solution (II) at different concentrations (C) in (mg/l), using a photoelectric
colorimeter, to obtain a reference curve for analysis of this solution. Calculate the
corresponding transmittances and absorbances plots:
(a) the absorbance versus concentration (relation showing if this solution obeys Beer's
law or shows +ve or -ve deviation from it.
(b) Percent transmittance versus the logarithm of the concentration.
(c) Find also the concentration range, along which the solution obeys Beer's law and the
corresponding absorptivity (given that b = 1 cm).
(3) The molar absorptivity of vitamin (D2) (calciferol) at wavelength 364 nm is maximum
and equals (ε = 18200 cm2
/mole). Its solution in alcohol is known to follow Beer's law over
a wide range of absorbance 0.4 ≤ a ≤ 0.9 find:
(a) Its maximum absorptivity.
(b) The range of concentration over which it follows Beer's law, given that its molecular
law is 397 and the breadth of cuvet used is 1 cm.
[a = 45.844 cm2
gm-1
, 8.725 x 10⁻³
≤ c ≤19.63 x10⁻³
gm/cm3
].
110
(4) The following table shows the absorbances of hydrogen peroxide (H2O2) solutions of
molybdenum (mo), titanium (Ti) and vanadium (V) each of concentration C = 4 mg/ 100
ml, at wavelengths 330, 410 and 460 nm, and the corresponding values for a certain
mixture of these solutions at the same wavelengths. Find the masses of these metals in
50.0 ml of this mixture. State the necessary conditions for solving this problem.
[0.5675, 1.9991, 3.1841 mg].
(5) Caffeine (c8h10o2n4h2o) of molecular weight 212.1, has an average absorbance a =
0.510 for a concentration of 1 mg/l00 ml. at wavelength 272 nm. A sample of 2.5 gm of a
particular product of soluble coffee is mixed to a volume of 500 ml, then clarified and
diluted to half its concentration, and a sample of 500 ml of this solution was tested,
showing an absorbance of 0.415 at λ = 272 nm, find:
(a) The molar absorptivity of caffeine, (b = 1 cm).
(b) The mass of caffeine per pound (453.6 gm) of this soluble coffee product.
[1.08171 x 10⁷
cm2
/mole, 1.4764 gm]
(6) The molar absorptivity of the Nitrite ion is 23.3 at wavelength 355 nm, and the ratio of
the absorptivity at 355 to that at 302 nm is 2.5. The molar absorptivity for the nitrate ion
is negligible at λ = 355 and 7.24 at 302 nm. A particular mixture of these ions gave aλ=302 =
1.010 and aλ=355 = 0.730. Calculate the molarities of both ions in the mixture (b = 1.0 cm).
[c1 = 0.0313 and c2 = 0.0992 mole/cm3
]
(7) A 12 dynode photomultiplier is found to deliver an average anode current 0.92 ma
over a period of 4.2 ns as a pulse resulting from a single ejected photoelectron. Calculate
the average multiplication factor of this photomultiplier.
(8) The following table shows the relation between the absorbance (A) and molar
concentration (c) in (mole L-1
) of cyc1ohexanone in cychexane solution at λ = 5.83 μm.
The breadth of the cell = 0.096 mm.
111
c 5 10 15 20 25 30 35 40 45 50
a .190 .244 .293 .345 390 .444 .487 .532 .562 .585
Plot these data:
(a) Over what range is Beer's law followed?
(b) Find the value of molar absorptivity (ε).
[10 ≤ c ≤ 40 mole l-1
, ε = 1 lmole-1
cm-l
]
(8) Find the approximate number of photons of infra red radiation of wavelength λ =
10 μm needed to just be detectable with a bolometer having the following specifications:
gold receptor dimensions 1.0, 0.1 and 0.005 mm, resistance of thermistor 10 kohm (at
25°c), its temperature coefficient of resistance -500o
k-1
, the least measurable change of
resistance ∆R = 0.01ohm, given that 10% of the incident intensity of radiation is lost.
(Density of gold = 19.32 gm/cm3
, and its specific heat = 0.0308 cal gm-1 o
k-1
, electrical
equivalent of heat (J) = 4.186 joule/cal).
[1.3927 x 10⁵
photons].
112

More Related Content

What's hot

First order reaction graph Kinetics
First order reaction graph KineticsFirst order reaction graph Kinetics
First order reaction graph KineticsNorth East ISD
 
Volumetric Analysis ( Titrimetric analysis) or Titration
Volumetric Analysis ( Titrimetric analysis) or TitrationVolumetric Analysis ( Titrimetric analysis) or Titration
Volumetric Analysis ( Titrimetric analysis) or TitrationAman Kakne
 
Stoichiometry exam questions and answers
Stoichiometry exam questions and answersStoichiometry exam questions and answers
Stoichiometry exam questions and answersMartin Brown
 
Volumetric analysis part 1
Volumetric analysis part 1Volumetric analysis part 1
Volumetric analysis part 1Damodar Koirala
 
J030102064073
J030102064073J030102064073
J030102064073theijes
 
Class 11 sbcc part X
Class 11 sbcc part XClass 11 sbcc part X
Class 11 sbcc part XAarti Soni
 
Titration method of analysis
Titration  method of analysisTitration  method of analysis
Titration method of analysisSiham Abdallaha
 
Titrimetric analysis lec
Titrimetric analysis lecTitrimetric analysis lec
Titrimetric analysis lecZainab&Sons
 
Chapter 5 stoichiometric calculations summer2014
Chapter 5 stoichiometric calculations summer2014Chapter 5 stoichiometric calculations summer2014
Chapter 5 stoichiometric calculations summer2014Cleophas Rwemera
 
Sulfapyridine paper
Sulfapyridine paperSulfapyridine paper
Sulfapyridine paperJamal Pratt
 
Systematic Study Multiplicity Production Nucleus – Nucleus Collisions at 4.5 ...
Systematic Study Multiplicity Production Nucleus – Nucleus Collisions at 4.5 ...Systematic Study Multiplicity Production Nucleus – Nucleus Collisions at 4.5 ...
Systematic Study Multiplicity Production Nucleus – Nucleus Collisions at 4.5 ...IOSRJAP
 
C06 concentration of solutions and volumetric analysis
C06 concentration of solutions and volumetric analysisC06 concentration of solutions and volumetric analysis
C06 concentration of solutions and volumetric analysisSatheesha Setty
 
PHYSICAL CHEMISTRY - Relative Molecular Masses in Solutions
PHYSICAL CHEMISTRY - Relative Molecular Masses in SolutionsPHYSICAL CHEMISTRY - Relative Molecular Masses in Solutions
PHYSICAL CHEMISTRY - Relative Molecular Masses in Solutionsshahzadebaujiti
 

What's hot (19)

Volumetric analysis
Volumetric analysisVolumetric analysis
Volumetric analysis
 
First order reaction graph Kinetics
First order reaction graph KineticsFirst order reaction graph Kinetics
First order reaction graph Kinetics
 
Chapter 5&6
Chapter 5&6Chapter 5&6
Chapter 5&6
 
Volumetric Analysis ( Titrimetric analysis) or Titration
Volumetric Analysis ( Titrimetric analysis) or TitrationVolumetric Analysis ( Titrimetric analysis) or Titration
Volumetric Analysis ( Titrimetric analysis) or Titration
 
Chemistry two02
Chemistry two02Chemistry two02
Chemistry two02
 
Stoichiometry exam questions and answers
Stoichiometry exam questions and answersStoichiometry exam questions and answers
Stoichiometry exam questions and answers
 
Volumetric analysis part 1
Volumetric analysis part 1Volumetric analysis part 1
Volumetric analysis part 1
 
Titrations
TitrationsTitrations
Titrations
 
J030102064073
J030102064073J030102064073
J030102064073
 
Class 11 sbcc part X
Class 11 sbcc part XClass 11 sbcc part X
Class 11 sbcc part X
 
Titration method of analysis
Titration  method of analysisTitration  method of analysis
Titration method of analysis
 
Titrimetric analysis lec
Titrimetric analysis lecTitrimetric analysis lec
Titrimetric analysis lec
 
Topicity
TopicityTopicity
Topicity
 
Chapter 5 stoichiometric calculations summer2014
Chapter 5 stoichiometric calculations summer2014Chapter 5 stoichiometric calculations summer2014
Chapter 5 stoichiometric calculations summer2014
 
Sulfapyridine paper
Sulfapyridine paperSulfapyridine paper
Sulfapyridine paper
 
Systematic Study Multiplicity Production Nucleus – Nucleus Collisions at 4.5 ...
Systematic Study Multiplicity Production Nucleus – Nucleus Collisions at 4.5 ...Systematic Study Multiplicity Production Nucleus – Nucleus Collisions at 4.5 ...
Systematic Study Multiplicity Production Nucleus – Nucleus Collisions at 4.5 ...
 
C06 concentration of solutions and volumetric analysis
C06 concentration of solutions and volumetric analysisC06 concentration of solutions and volumetric analysis
C06 concentration of solutions and volumetric analysis
 
Volumetric analysis
Volumetric analysisVolumetric analysis
Volumetric analysis
 
PHYSICAL CHEMISTRY - Relative Molecular Masses in Solutions
PHYSICAL CHEMISTRY - Relative Molecular Masses in SolutionsPHYSICAL CHEMISTRY - Relative Molecular Masses in Solutions
PHYSICAL CHEMISTRY - Relative Molecular Masses in Solutions
 

Similar to Analytical Instrumentation Chapter 3 & 4

Experiment 5: Introduction to Ultraviolet-Visible Spectrophotometry
Experiment 5: Introduction to Ultraviolet-Visible SpectrophotometryExperiment 5: Introduction to Ultraviolet-Visible Spectrophotometry
Experiment 5: Introduction to Ultraviolet-Visible SpectrophotometryAARONAGAWIN
 
8b-EnzymeKinetics-Spec.pdf
8b-EnzymeKinetics-Spec.pdf8b-EnzymeKinetics-Spec.pdf
8b-EnzymeKinetics-Spec.pdfDaud Khan
 
Analical chemistry ok1294986152
Analical chemistry  ok1294986152Analical chemistry  ok1294986152
Analical chemistry ok1294986152Navin Joshi
 
How To Determine The Colour Of Transition Metal Complexes
How To Determine The Colour Of Transition Metal ComplexesHow To Determine The Colour Of Transition Metal Complexes
How To Determine The Colour Of Transition Metal ComplexesDenison Dwarkah
 
Molecular interaction analysis of polar liquids
Molecular interaction analysis of polar liquidsMolecular interaction analysis of polar liquids
Molecular interaction analysis of polar liquidseSAT Publishing House
 
Molecular interaction analysis of polar liquids acetonitrile, aceophenone, 2 ...
Molecular interaction analysis of polar liquids acetonitrile, aceophenone, 2 ...Molecular interaction analysis of polar liquids acetonitrile, aceophenone, 2 ...
Molecular interaction analysis of polar liquids acetonitrile, aceophenone, 2 ...eSAT Journals
 
PickeringEmulsionWriteUp
PickeringEmulsionWriteUpPickeringEmulsionWriteUp
PickeringEmulsionWriteUpErin Blauvelt
 
F.Sc. Part 1 Paper Faisalabad Board 2007 (Malik Xufyan)
F.Sc. Part 1 Paper Faisalabad Board 2007 (Malik Xufyan)F.Sc. Part 1 Paper Faisalabad Board 2007 (Malik Xufyan)
F.Sc. Part 1 Paper Faisalabad Board 2007 (Malik Xufyan)Malik Xufyan
 
Introduction to Colorimetry and basics.ppt.pptx
Introduction to Colorimetry and basics.ppt.pptxIntroduction to Colorimetry and basics.ppt.pptx
Introduction to Colorimetry and basics.ppt.pptxSheelaS18
 
ANALYTICAL METHODS OF INSTRUMENTATION unit-ii-presentation - 1
ANALYTICAL METHODS OF INSTRUMENTATION unit-ii-presentation - 1ANALYTICAL METHODS OF INSTRUMENTATION unit-ii-presentation - 1
ANALYTICAL METHODS OF INSTRUMENTATION unit-ii-presentation - 1Jayashree Sathiyanarayanan
 
Instrumentation, P K MANI
Instrumentation, P K MANIInstrumentation, P K MANI
Instrumentation, P K MANIP.K. Mani
 
Ch7 quantum theory and the electronic structure of atoms
Ch7 quantum theory and the electronic structure of atomsCh7 quantum theory and the electronic structure of atoms
Ch7 quantum theory and the electronic structure of atomsSa'ib J. Khouri
 
Analytical class spectroscopy, turbidimetry
Analytical class  spectroscopy, turbidimetryAnalytical class  spectroscopy, turbidimetry
Analytical class spectroscopy, turbidimetryP.K. Mani
 
Absorption spectrum of a conjugated dye
Absorption spectrum of a conjugated dyeAbsorption spectrum of a conjugated dye
Absorption spectrum of a conjugated dyeIkutwa
 
Ultraviolet visible (uv vis) spectroscopy Likhith K
Ultraviolet visible (uv vis) spectroscopy Likhith KUltraviolet visible (uv vis) spectroscopy Likhith K
Ultraviolet visible (uv vis) spectroscopy Likhith KLIKHITHK1
 

Similar to Analytical Instrumentation Chapter 3 & 4 (20)

Experiment 5: Introduction to Ultraviolet-Visible Spectrophotometry
Experiment 5: Introduction to Ultraviolet-Visible SpectrophotometryExperiment 5: Introduction to Ultraviolet-Visible Spectrophotometry
Experiment 5: Introduction to Ultraviolet-Visible Spectrophotometry
 
Meph 569 second major 032
Meph 569 second major 032Meph 569 second major 032
Meph 569 second major 032
 
8b-EnzymeKinetics-Spec.pdf
8b-EnzymeKinetics-Spec.pdf8b-EnzymeKinetics-Spec.pdf
8b-EnzymeKinetics-Spec.pdf
 
Analical chemistry ok1294986152
Analical chemistry  ok1294986152Analical chemistry  ok1294986152
Analical chemistry ok1294986152
 
How To Determine The Colour Of Transition Metal Complexes
How To Determine The Colour Of Transition Metal ComplexesHow To Determine The Colour Of Transition Metal Complexes
How To Determine The Colour Of Transition Metal Complexes
 
Molecular interaction analysis of polar liquids
Molecular interaction analysis of polar liquidsMolecular interaction analysis of polar liquids
Molecular interaction analysis of polar liquids
 
Molecular interaction analysis of polar liquids acetonitrile, aceophenone, 2 ...
Molecular interaction analysis of polar liquids acetonitrile, aceophenone, 2 ...Molecular interaction analysis of polar liquids acetonitrile, aceophenone, 2 ...
Molecular interaction analysis of polar liquids acetonitrile, aceophenone, 2 ...
 
PickeringEmulsionWriteUp
PickeringEmulsionWriteUpPickeringEmulsionWriteUp
PickeringEmulsionWriteUp
 
Uv vis spectroscopy- part-1
Uv vis spectroscopy- part-1Uv vis spectroscopy- part-1
Uv vis spectroscopy- part-1
 
Introduction to beer lambert law
Introduction to beer lambert lawIntroduction to beer lambert law
Introduction to beer lambert law
 
F.Sc. Part 1 Paper Faisalabad Board 2007 (Malik Xufyan)
F.Sc. Part 1 Paper Faisalabad Board 2007 (Malik Xufyan)F.Sc. Part 1 Paper Faisalabad Board 2007 (Malik Xufyan)
F.Sc. Part 1 Paper Faisalabad Board 2007 (Malik Xufyan)
 
Introduction to Colorimetry and basics.ppt.pptx
Introduction to Colorimetry and basics.ppt.pptxIntroduction to Colorimetry and basics.ppt.pptx
Introduction to Colorimetry and basics.ppt.pptx
 
ANALYTICAL METHODS OF INSTRUMENTATION unit-ii-presentation - 1
ANALYTICAL METHODS OF INSTRUMENTATION unit-ii-presentation - 1ANALYTICAL METHODS OF INSTRUMENTATION unit-ii-presentation - 1
ANALYTICAL METHODS OF INSTRUMENTATION unit-ii-presentation - 1
 
uv.pptx
uv.pptxuv.pptx
uv.pptx
 
Instrumentation, P K MANI
Instrumentation, P K MANIInstrumentation, P K MANI
Instrumentation, P K MANI
 
Chapter one
Chapter oneChapter one
Chapter one
 
Ch7 quantum theory and the electronic structure of atoms
Ch7 quantum theory and the electronic structure of atomsCh7 quantum theory and the electronic structure of atoms
Ch7 quantum theory and the electronic structure of atoms
 
Analytical class spectroscopy, turbidimetry
Analytical class  spectroscopy, turbidimetryAnalytical class  spectroscopy, turbidimetry
Analytical class spectroscopy, turbidimetry
 
Absorption spectrum of a conjugated dye
Absorption spectrum of a conjugated dyeAbsorption spectrum of a conjugated dye
Absorption spectrum of a conjugated dye
 
Ultraviolet visible (uv vis) spectroscopy Likhith K
Ultraviolet visible (uv vis) spectroscopy Likhith KUltraviolet visible (uv vis) spectroscopy Likhith K
Ultraviolet visible (uv vis) spectroscopy Likhith K
 

More from cairo university

Tocci chapter 13 applications of programmable logic devices extended
Tocci chapter 13 applications of programmable logic devices extendedTocci chapter 13 applications of programmable logic devices extended
Tocci chapter 13 applications of programmable logic devices extendedcairo university
 
Tocci chapter 12 memory devices
Tocci chapter 12 memory devicesTocci chapter 12 memory devices
Tocci chapter 12 memory devicescairo university
 
Tocci ch 9 msi logic circuits
Tocci ch 9 msi logic circuitsTocci ch 9 msi logic circuits
Tocci ch 9 msi logic circuitscairo university
 
Tocci ch 7 counters and registers modified x
Tocci ch 7 counters and registers modified xTocci ch 7 counters and registers modified x
Tocci ch 7 counters and registers modified xcairo university
 
Tocci ch 6 digital arithmetic operations and circuits
Tocci ch 6 digital arithmetic operations and circuitsTocci ch 6 digital arithmetic operations and circuits
Tocci ch 6 digital arithmetic operations and circuitscairo university
 
Tocci ch 3 5 boolean algebra, logic gates, combinational circuits, f fs, - re...
Tocci ch 3 5 boolean algebra, logic gates, combinational circuits, f fs, - re...Tocci ch 3 5 boolean algebra, logic gates, combinational circuits, f fs, - re...
Tocci ch 3 5 boolean algebra, logic gates, combinational circuits, f fs, - re...cairo university
 
A15 sedra ch 15 memory circuits
A15  sedra ch 15 memory circuitsA15  sedra ch 15 memory circuits
A15 sedra ch 15 memory circuitscairo university
 
A14 sedra ch 14 advanced mos and bipolar logic circuits
A14  sedra ch 14 advanced mos and bipolar logic circuitsA14  sedra ch 14 advanced mos and bipolar logic circuits
A14 sedra ch 14 advanced mos and bipolar logic circuitscairo university
 
A13 sedra ch 13 cmos digital logic circuits
A13  sedra ch 13 cmos digital logic circuitsA13  sedra ch 13 cmos digital logic circuits
A13 sedra ch 13 cmos digital logic circuitscairo university
 
A09 sedra ch 9 frequency response
A09  sedra ch 9 frequency responseA09  sedra ch 9 frequency response
A09 sedra ch 9 frequency responsecairo university
 
5 sedra ch 05 mosfet revision
5  sedra ch 05  mosfet revision5  sedra ch 05  mosfet revision
5 sedra ch 05 mosfet revisioncairo university
 
Lecture 2 (system overview of c8051 f020) rv01
Lecture 2 (system overview of c8051 f020) rv01Lecture 2 (system overview of c8051 f020) rv01
Lecture 2 (system overview of c8051 f020) rv01cairo university
 
Lecture 1 (course overview and 8051 architecture) rv01
Lecture 1 (course overview and 8051 architecture) rv01Lecture 1 (course overview and 8051 architecture) rv01
Lecture 1 (course overview and 8051 architecture) rv01cairo university
 

More from cairo university (20)

Tocci chapter 13 applications of programmable logic devices extended
Tocci chapter 13 applications of programmable logic devices extendedTocci chapter 13 applications of programmable logic devices extended
Tocci chapter 13 applications of programmable logic devices extended
 
Tocci chapter 12 memory devices
Tocci chapter 12 memory devicesTocci chapter 12 memory devices
Tocci chapter 12 memory devices
 
Tocci ch 9 msi logic circuits
Tocci ch 9 msi logic circuitsTocci ch 9 msi logic circuits
Tocci ch 9 msi logic circuits
 
Tocci ch 7 counters and registers modified x
Tocci ch 7 counters and registers modified xTocci ch 7 counters and registers modified x
Tocci ch 7 counters and registers modified x
 
Tocci ch 6 digital arithmetic operations and circuits
Tocci ch 6 digital arithmetic operations and circuitsTocci ch 6 digital arithmetic operations and circuits
Tocci ch 6 digital arithmetic operations and circuits
 
Tocci ch 3 5 boolean algebra, logic gates, combinational circuits, f fs, - re...
Tocci ch 3 5 boolean algebra, logic gates, combinational circuits, f fs, - re...Tocci ch 3 5 boolean algebra, logic gates, combinational circuits, f fs, - re...
Tocci ch 3 5 boolean algebra, logic gates, combinational circuits, f fs, - re...
 
A15 sedra ch 15 memory circuits
A15  sedra ch 15 memory circuitsA15  sedra ch 15 memory circuits
A15 sedra ch 15 memory circuits
 
A14 sedra ch 14 advanced mos and bipolar logic circuits
A14  sedra ch 14 advanced mos and bipolar logic circuitsA14  sedra ch 14 advanced mos and bipolar logic circuits
A14 sedra ch 14 advanced mos and bipolar logic circuits
 
A13 sedra ch 13 cmos digital logic circuits
A13  sedra ch 13 cmos digital logic circuitsA13  sedra ch 13 cmos digital logic circuits
A13 sedra ch 13 cmos digital logic circuits
 
A09 sedra ch 9 frequency response
A09  sedra ch 9 frequency responseA09  sedra ch 9 frequency response
A09 sedra ch 9 frequency response
 
5 sedra ch 05 mosfet.ppsx
5  sedra ch 05  mosfet.ppsx5  sedra ch 05  mosfet.ppsx
5 sedra ch 05 mosfet.ppsx
 
5 sedra ch 05 mosfet
5  sedra ch 05  mosfet5  sedra ch 05  mosfet
5 sedra ch 05 mosfet
 
5 sedra ch 05 mosfet revision
5  sedra ch 05  mosfet revision5  sedra ch 05  mosfet revision
5 sedra ch 05 mosfet revision
 
Fields Lec 2
Fields Lec 2Fields Lec 2
Fields Lec 2
 
Fields Lec 1
Fields Lec 1Fields Lec 1
Fields Lec 1
 
Fields Lec 5&amp;6
Fields Lec 5&amp;6Fields Lec 5&amp;6
Fields Lec 5&amp;6
 
Fields Lec 4
Fields Lec 4Fields Lec 4
Fields Lec 4
 
Fields Lec 3
Fields Lec 3Fields Lec 3
Fields Lec 3
 
Lecture 2 (system overview of c8051 f020) rv01
Lecture 2 (system overview of c8051 f020) rv01Lecture 2 (system overview of c8051 f020) rv01
Lecture 2 (system overview of c8051 f020) rv01
 
Lecture 1 (course overview and 8051 architecture) rv01
Lecture 1 (course overview and 8051 architecture) rv01Lecture 1 (course overview and 8051 architecture) rv01
Lecture 1 (course overview and 8051 architecture) rv01
 

Recently uploaded

Russian Call Girls in Nagpur Grishma Call 7001035870 Meet With Nagpur Escorts
Russian Call Girls in Nagpur Grishma Call 7001035870 Meet With Nagpur EscortsRussian Call Girls in Nagpur Grishma Call 7001035870 Meet With Nagpur Escorts
Russian Call Girls in Nagpur Grishma Call 7001035870 Meet With Nagpur EscortsCall Girls in Nagpur High Profile
 
Extrusion Processes and Their Limitations
Extrusion Processes and Their LimitationsExtrusion Processes and Their Limitations
Extrusion Processes and Their Limitations120cr0395
 
Call for Papers - Educational Administration: Theory and Practice, E-ISSN: 21...
Call for Papers - Educational Administration: Theory and Practice, E-ISSN: 21...Call for Papers - Educational Administration: Theory and Practice, E-ISSN: 21...
Call for Papers - Educational Administration: Theory and Practice, E-ISSN: 21...Christo Ananth
 
High Profile Call Girls Nagpur Meera Call 7001035870 Meet With Nagpur Escorts
High Profile Call Girls Nagpur Meera Call 7001035870 Meet With Nagpur EscortsHigh Profile Call Girls Nagpur Meera Call 7001035870 Meet With Nagpur Escorts
High Profile Call Girls Nagpur Meera Call 7001035870 Meet With Nagpur EscortsCall Girls in Nagpur High Profile
 
Top Rated Pune Call Girls Budhwar Peth ⟟ 6297143586 ⟟ Call Me For Genuine Se...
Top Rated  Pune Call Girls Budhwar Peth ⟟ 6297143586 ⟟ Call Me For Genuine Se...Top Rated  Pune Call Girls Budhwar Peth ⟟ 6297143586 ⟟ Call Me For Genuine Se...
Top Rated Pune Call Girls Budhwar Peth ⟟ 6297143586 ⟟ Call Me For Genuine Se...Call Girls in Nagpur High Profile
 
Online banking management system project.pdf
Online banking management system project.pdfOnline banking management system project.pdf
Online banking management system project.pdfKamal Acharya
 
Introduction and different types of Ethernet.pptx
Introduction and different types of Ethernet.pptxIntroduction and different types of Ethernet.pptx
Introduction and different types of Ethernet.pptxupamatechverse
 
result management system report for college project
result management system report for college projectresult management system report for college project
result management system report for college projectTonystark477637
 
Sheet Pile Wall Design and Construction: A Practical Guide for Civil Engineer...
Sheet Pile Wall Design and Construction: A Practical Guide for Civil Engineer...Sheet Pile Wall Design and Construction: A Practical Guide for Civil Engineer...
Sheet Pile Wall Design and Construction: A Practical Guide for Civil Engineer...Dr.Costas Sachpazis
 
UNIT-V FMM.HYDRAULIC TURBINE - Construction and working
UNIT-V FMM.HYDRAULIC TURBINE - Construction and workingUNIT-V FMM.HYDRAULIC TURBINE - Construction and working
UNIT-V FMM.HYDRAULIC TURBINE - Construction and workingrknatarajan
 
MANUFACTURING PROCESS-II UNIT-2 LATHE MACHINE
MANUFACTURING PROCESS-II UNIT-2 LATHE MACHINEMANUFACTURING PROCESS-II UNIT-2 LATHE MACHINE
MANUFACTURING PROCESS-II UNIT-2 LATHE MACHINESIVASHANKAR N
 
Call Girls Pimpri Chinchwad Call Me 7737669865 Budget Friendly No Advance Boo...
Call Girls Pimpri Chinchwad Call Me 7737669865 Budget Friendly No Advance Boo...Call Girls Pimpri Chinchwad Call Me 7737669865 Budget Friendly No Advance Boo...
Call Girls Pimpri Chinchwad Call Me 7737669865 Budget Friendly No Advance Boo...roncy bisnoi
 
MANUFACTURING PROCESS-II UNIT-5 NC MACHINE TOOLS
MANUFACTURING PROCESS-II UNIT-5 NC MACHINE TOOLSMANUFACTURING PROCESS-II UNIT-5 NC MACHINE TOOLS
MANUFACTURING PROCESS-II UNIT-5 NC MACHINE TOOLSSIVASHANKAR N
 
UNIT-II FMM-Flow Through Circular Conduits
UNIT-II FMM-Flow Through Circular ConduitsUNIT-II FMM-Flow Through Circular Conduits
UNIT-II FMM-Flow Through Circular Conduitsrknatarajan
 
Java Programming :Event Handling(Types of Events)
Java Programming :Event Handling(Types of Events)Java Programming :Event Handling(Types of Events)
Java Programming :Event Handling(Types of Events)simmis5
 
VIP Call Girls Ankleshwar 7001035870 Whatsapp Number, 24/07 Booking
VIP Call Girls Ankleshwar 7001035870 Whatsapp Number, 24/07 BookingVIP Call Girls Ankleshwar 7001035870 Whatsapp Number, 24/07 Booking
VIP Call Girls Ankleshwar 7001035870 Whatsapp Number, 24/07 Bookingdharasingh5698
 
MANUFACTURING PROCESS-II UNIT-1 THEORY OF METAL CUTTING
MANUFACTURING PROCESS-II UNIT-1 THEORY OF METAL CUTTINGMANUFACTURING PROCESS-II UNIT-1 THEORY OF METAL CUTTING
MANUFACTURING PROCESS-II UNIT-1 THEORY OF METAL CUTTINGSIVASHANKAR N
 
CCS335 _ Neural Networks and Deep Learning Laboratory_Lab Complete Record
CCS335 _ Neural Networks and Deep Learning Laboratory_Lab Complete RecordCCS335 _ Neural Networks and Deep Learning Laboratory_Lab Complete Record
CCS335 _ Neural Networks and Deep Learning Laboratory_Lab Complete RecordAsst.prof M.Gokilavani
 
High Profile Call Girls Nagpur Isha Call 7001035870 Meet With Nagpur Escorts
High Profile Call Girls Nagpur Isha Call 7001035870 Meet With Nagpur EscortsHigh Profile Call Girls Nagpur Isha Call 7001035870 Meet With Nagpur Escorts
High Profile Call Girls Nagpur Isha Call 7001035870 Meet With Nagpur Escortsranjana rawat
 

Recently uploaded (20)

Russian Call Girls in Nagpur Grishma Call 7001035870 Meet With Nagpur Escorts
Russian Call Girls in Nagpur Grishma Call 7001035870 Meet With Nagpur EscortsRussian Call Girls in Nagpur Grishma Call 7001035870 Meet With Nagpur Escorts
Russian Call Girls in Nagpur Grishma Call 7001035870 Meet With Nagpur Escorts
 
Extrusion Processes and Their Limitations
Extrusion Processes and Their LimitationsExtrusion Processes and Their Limitations
Extrusion Processes and Their Limitations
 
Call for Papers - Educational Administration: Theory and Practice, E-ISSN: 21...
Call for Papers - Educational Administration: Theory and Practice, E-ISSN: 21...Call for Papers - Educational Administration: Theory and Practice, E-ISSN: 21...
Call for Papers - Educational Administration: Theory and Practice, E-ISSN: 21...
 
High Profile Call Girls Nagpur Meera Call 7001035870 Meet With Nagpur Escorts
High Profile Call Girls Nagpur Meera Call 7001035870 Meet With Nagpur EscortsHigh Profile Call Girls Nagpur Meera Call 7001035870 Meet With Nagpur Escorts
High Profile Call Girls Nagpur Meera Call 7001035870 Meet With Nagpur Escorts
 
Top Rated Pune Call Girls Budhwar Peth ⟟ 6297143586 ⟟ Call Me For Genuine Se...
Top Rated  Pune Call Girls Budhwar Peth ⟟ 6297143586 ⟟ Call Me For Genuine Se...Top Rated  Pune Call Girls Budhwar Peth ⟟ 6297143586 ⟟ Call Me For Genuine Se...
Top Rated Pune Call Girls Budhwar Peth ⟟ 6297143586 ⟟ Call Me For Genuine Se...
 
Online banking management system project.pdf
Online banking management system project.pdfOnline banking management system project.pdf
Online banking management system project.pdf
 
Roadmap to Membership of RICS - Pathways and Routes
Roadmap to Membership of RICS - Pathways and RoutesRoadmap to Membership of RICS - Pathways and Routes
Roadmap to Membership of RICS - Pathways and Routes
 
Introduction and different types of Ethernet.pptx
Introduction and different types of Ethernet.pptxIntroduction and different types of Ethernet.pptx
Introduction and different types of Ethernet.pptx
 
result management system report for college project
result management system report for college projectresult management system report for college project
result management system report for college project
 
Sheet Pile Wall Design and Construction: A Practical Guide for Civil Engineer...
Sheet Pile Wall Design and Construction: A Practical Guide for Civil Engineer...Sheet Pile Wall Design and Construction: A Practical Guide for Civil Engineer...
Sheet Pile Wall Design and Construction: A Practical Guide for Civil Engineer...
 
UNIT-V FMM.HYDRAULIC TURBINE - Construction and working
UNIT-V FMM.HYDRAULIC TURBINE - Construction and workingUNIT-V FMM.HYDRAULIC TURBINE - Construction and working
UNIT-V FMM.HYDRAULIC TURBINE - Construction and working
 
MANUFACTURING PROCESS-II UNIT-2 LATHE MACHINE
MANUFACTURING PROCESS-II UNIT-2 LATHE MACHINEMANUFACTURING PROCESS-II UNIT-2 LATHE MACHINE
MANUFACTURING PROCESS-II UNIT-2 LATHE MACHINE
 
Call Girls Pimpri Chinchwad Call Me 7737669865 Budget Friendly No Advance Boo...
Call Girls Pimpri Chinchwad Call Me 7737669865 Budget Friendly No Advance Boo...Call Girls Pimpri Chinchwad Call Me 7737669865 Budget Friendly No Advance Boo...
Call Girls Pimpri Chinchwad Call Me 7737669865 Budget Friendly No Advance Boo...
 
MANUFACTURING PROCESS-II UNIT-5 NC MACHINE TOOLS
MANUFACTURING PROCESS-II UNIT-5 NC MACHINE TOOLSMANUFACTURING PROCESS-II UNIT-5 NC MACHINE TOOLS
MANUFACTURING PROCESS-II UNIT-5 NC MACHINE TOOLS
 
UNIT-II FMM-Flow Through Circular Conduits
UNIT-II FMM-Flow Through Circular ConduitsUNIT-II FMM-Flow Through Circular Conduits
UNIT-II FMM-Flow Through Circular Conduits
 
Java Programming :Event Handling(Types of Events)
Java Programming :Event Handling(Types of Events)Java Programming :Event Handling(Types of Events)
Java Programming :Event Handling(Types of Events)
 
VIP Call Girls Ankleshwar 7001035870 Whatsapp Number, 24/07 Booking
VIP Call Girls Ankleshwar 7001035870 Whatsapp Number, 24/07 BookingVIP Call Girls Ankleshwar 7001035870 Whatsapp Number, 24/07 Booking
VIP Call Girls Ankleshwar 7001035870 Whatsapp Number, 24/07 Booking
 
MANUFACTURING PROCESS-II UNIT-1 THEORY OF METAL CUTTING
MANUFACTURING PROCESS-II UNIT-1 THEORY OF METAL CUTTINGMANUFACTURING PROCESS-II UNIT-1 THEORY OF METAL CUTTING
MANUFACTURING PROCESS-II UNIT-1 THEORY OF METAL CUTTING
 
CCS335 _ Neural Networks and Deep Learning Laboratory_Lab Complete Record
CCS335 _ Neural Networks and Deep Learning Laboratory_Lab Complete RecordCCS335 _ Neural Networks and Deep Learning Laboratory_Lab Complete Record
CCS335 _ Neural Networks and Deep Learning Laboratory_Lab Complete Record
 
High Profile Call Girls Nagpur Isha Call 7001035870 Meet With Nagpur Escorts
High Profile Call Girls Nagpur Isha Call 7001035870 Meet With Nagpur EscortsHigh Profile Call Girls Nagpur Isha Call 7001035870 Meet With Nagpur Escorts
High Profile Call Girls Nagpur Isha Call 7001035870 Meet With Nagpur Escorts
 

Analytical Instrumentation Chapter 3 & 4

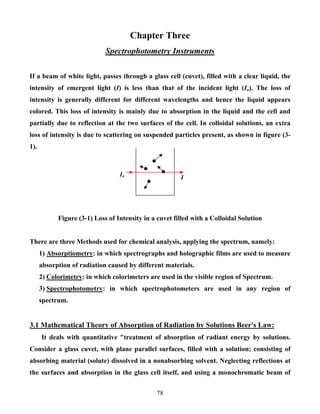
  • 1. Chapter Three Spectrophotometry Instruments If a beam of white light, passes through a glass cell (cuvet), filled with a clear liquid, the intensity of emergent light (I) is less than that of the incident light (Io). The loss of intensity is generally different for different wavelengths and hence the liquid appears colored. This loss of intensity is mainly due to absorption in the liquid and the cell and partially due to reflection at the two surfaces of the cell. In colloidal solutions, an extra loss of intensity is due to scattering on suspended particles present, as shown in figure (3- 1). Io I Figure (3-1) Loss of Intensity in a cuvet filled with a Colloidal Solution There are three Methods used for chemical analysis, applying the spectrum, namely: 1) Absorptiometry: in which spectrographs and holographic films are used to measure absorption of radiation caused by different materials. 2) Colorimetry: in which colorimeters are used in the visible region of Spectrum. 3) Spectrophotometry: in which spectrophotometers are used in any region of spectrum. 3.1 Mathematical Theory of Absorption of Radiation by Solutions Beer's Law: It deals with quantitative "treatment of absorption of radiant energy by solutions. Consider a glass cuvet, with plane parallel surfaces, filled with a solution; consisting of absorbing material (solute) dissolved in a nonabsorbing solvent. Neglecting reflections at the surfaces and absorption in the glass cell itself, and using a monochromatic beam of 78
  • 2. radiation of wavelength (λ), it was found generally that the loss of intensity of the beam is directly proportional to the number of absorbing molecules in its path. Beer's Law states that the fraction of radiant energy of monochromatic radiation absorbed (dI/I) is proportional to the increment in the number of identical absorbing molecules (dNs), traversed by the beam per unit area. Figure (3-2) shows successive parallel layers of the absorbing solution normal to the incident beam. Applying Beer's law on any of these layers, we get the following differential equations = sK- I dI Νδλ (3-1) where: (dI) is the element intensity absorbed by the element of absorbing molecules (dN) in the layer (I) is the Intensity of the incident beam, and (kλ) is a constant depending on the absorbing molecules and wavelength (λ) of radiation. The (-ve) sign in the R.H.S. shows that (dl) represents a decrease in the intensity. Io It(I – dI)I b δNs Figure (3-2) Loss of intensity in a Clear Solution Integrating both sides of equation (3-1) for the whole quantity of solution in the cell, we get, s NI I dNK I dI st o ∫∫ −= 0 λ s t NK) I I (n λ−= 0 l (3-2) where, 79
  • 3. (Io) is the Initial Incident Intensity of the Beam of Radiation. (It) is the Final Transmitted Intensity of the Beam of Radiation. (Ns) is the Total Number of Molecules causing the Absorption per unit cross section area. If the mass (m) of solute in the solution of cross sectional area (S), breadth (b), its concentration is (C), then, m = (Sb)C (3-3) but, The number of molecules of solute N = (No/M)m = (No/M) (S bC) (3-4) where (No) is Avogadro's number (number of molecules in the molecular weight of any substance) which is the same for all substances (M) is the molecular weight of solute. So, the number of molecules of solute per unit cross section area is, NS = (No/M) (bC) (3-5) And from equation (3-2), the Absorbance of the Solution (Aλ) defined by, )( t o I I ogA l=λ , can be written in the form: = )( )( == M. )bC(NΚ og I Ι n )/Iog (IA ot o to 3210 λ l l l bCabc} M. NK A λ o ={= 32 λ (3-6) The Absorbance of the Solution (Aλ) is characteristic of solution, depending on its dimensions (breadth b), and its concentration (C), and varies with wavelength λ of the monochromatic radiation used. aλ is a constant called the absorptivity of the solution. It is characteristic of solution, and varies with wavelength (λ). Equation (3-6) is the general form of Beer's law. The Absorbance A λ is dimensionless and hence has no units. The Absorptivity a λ = A λ /b C have the units given by: [a λ] = [A λ,/bC] = [1/cm (gm/cm3 )] = cm2 /gm 80
  • 4. Molar Absorptivity is defined as ξλ = aλ M , Its unit is (cm2 molecular weight/gm = cm2 /mole). Equation (3-6) can be rewritten in the following form: cb M c bMaA )()( λλλ ξ== (3-7) Where, M C c = is the molecular concentration. Absorptivity (aλ) is used if the nature of the absorbing material and hence its molecular weight is not known. Molecular Absorptivity ( λξ ) is preferred when comparing quantitavely absorptions of different materials of known molecular weights. The Transmittance is defined as, nt beamthe incideofIntensity beamdtransmottetheofIntensity I I T o t == Then, ) 1 ( T ogA l= . Theoretically, , but practically, , So, 3< A <0.00>>∞ A oto III <<−3 10 Beer's Law indicates that the absorptivity (aλ) is a constant independent of the concentration (C) of the solution and the optical path length (b) through it and the intensity of incident radiation (Io). It gives no hint of the effect of the temperature, the nature of the solvent or the wavelength of radiation. The effect of temperature is negligible, especially when the absorption of an unknown solution is direct1y compared with a reference (solvent of the same solution of known concentration), at room temperature. When the temperature is varied over a wide range, it has a secondary effect as a result of the slight variation of concentration with temperature due to the expansion of the solution. Effect of changing the solvent, cannot be predicted in any general way. The Analyst is frequently limited to a particular solvent in which the material is soluble. If Beer's law is not obeyed exactly for all values of concentrations, then the absorptivity of 81
  • 5. a solution at constant temperature and the same solvent, may vary with concentration, to either greater or smaller values. According to Beer's Law, the relation between absorbance (Aλ) and concentration (C) must be a straight line through the origin as shown in case figure (3-3) case (1), yet positive or negative deviations may be found as shown in cases (2) and (3). Once the curve is obtained experimentally, it could be used as a calibration curve from which the concentration of the solution could be obtained when its absorbance is measured. Absorbance Concentration 1 3 2 Figure (3- 3) Beer's law (a) obeyed, (b) positive deviation and (c) negative deviation 3.2 Applications of Beer's Law: The logarithmic form of Beer's law allows the following important applications: 1- The total absorbance (AT) due to a series of solutions Transmitted by the beam of radiation one after the other, as shown in Fig. (3-4), is given by, ) I I .....()......... I I )( I I (og) I I (ogA n 1n 2 1 1 o n o T − == ll ) I I (og.................) I I (og) I I (og n 1n 2 1 1 o − +++= lll but the absorbance (A) of any solution, as shown in Beer's Law, given by: 82
  • 6. CbaA λ= then, ∑ ∑ = = ==+++= n r n r rrrrnT CbaAA..............AAA 1 1 21 (3-8) A1 A2 An Io I1 I2 In-1 In Figure (3-4) Absorbance due to (n) Solutions, transmitted by Radiation one after the other 2- The Total Absorbance (AT) of a mixture of solutions which do not interact with each other and contained in one cuvet: Each solution, behaves as if it were the only solution present in the cuvet, therefore, the total absorbance (AT) of the mixture of solutions can be explained as due to the absorbance of each one of these solutions, taken one after the other, as in the last case: (3-9)∑ ∑= = == n 1r n 1r rrrT CabAA 3- The absorbance of any solution can be considered as due to that of solvent and Solute, so that, Asolution = Asolvent + Asolute (3-10) 4- In the case of an impure solution, the absorbance can be considered as due to absorbances of pure solution and impurity. Aimpure solution = Apure solution + Aimpurity (3-11) Therefore, the spectral absorbance distribution curve of the impurity, can be derived 83
  • 7. from the corresponding curves of the impure solution and pure solution (obtained experimentally), simply by subtraction of their Absorbances at each wavelength. Since this curve is characteristic of its material, the material of the impurity can be deduced, as well as its concentration can be calculated. In the case of a certain mixture of (n) different solutions, which do not interact with each other, at different concentrations, Beer's Law can be applied to determine the concentration of each solution in the mixture, as follows: The spectral absorbance distribution curves of each of these solutions at known concentrations, and that of this mixture can be obtained experimentally. Applying Equation (3-9) at (n) different wavelengths, we can formulate (n) simultaneous equations, from which the concentrations of these solutions in this mixture can be determined, as shown in the following example. Example (1): Table (3-1) shows the values of the absorbance (A) of aqueous solutions of 3 samples at given concentrations (C) in (mg/100 ml) and that of a certain mixture of these solutions at certain wavelengths (λl), (λ2) and (λ3). Find the concentration of each of these samples in this mixture. Sample First Second Third Mixture Concentration (C) In Mg/100ml 2 3 4 ABSORBANCE (Λ) at λ1 0.4 0.3 0.0 1.1 at λ2 0.6 0.0 0.4 1.4 at λ3 0.0 0.9 0.8 1.3 Table (3-1) Solution: To solve this problem, the following conditions must the satisfied: (1) The ingredient solutions must not interact with each other i.e. each solution must have 84
  • 8. its own entity in the mixture. (2) The ingredient solutions must obey Beer's Law at the ranges of concentration under consideration. (3) The cuvets used for measuring the absorbance of each solution and that of the mixture must have the same breadth (b). Applying Beer's law for the Mixture and its ingredient solutions, at the given wavelength (i) , we get: i,3i,3i,2i,2i,1i,1i bCabCabCaA λλλλλλλ ++= and i,r i,r i,r C A ba λ λ λ = where, i,rA λ is the absorbance of the solution (i) at wavelength λi is the absorpitivity of the solution (i) at wavelength λi,ra λ i obtained from table for each solution at the given concentration i,rc λ in the table. Substituting the data given in Table (3-2), we get three equations: 1.1 = (0.4/2)Cl +(0.3/3)C2+(0.0/4)C3 = 0.2Cl +0.1C2 (a) 1.4 = (0.6/2)Cl +(0.0/3)C2+(0.4/4)C3 = 0.3Cl +0.1 C3 (b) 1.3 = (0. 0/2) C1 + (0. 9/3) C2 +(0.8/4)C3.= 0.3C2+0.2C3 (c) Subtracting Equation (c) from Equation (b) multiplied by 2; we get: (2 ×1.4 -1.3) = 2 × 0.3C1 - 0.3C2 + (2 × 0.1-0.2)C3 1.5 = 0.6 C1 – 0.3 C2 (d) Fro (a) and (d), Cl = 4 mg/l00 ml = 4(10-3 g/102 cm3 ) = 4 × 10⁻⁵ gm/cm3 C2 = 3 mg/100 ml = 3 x 10⁻⁵ gm/cm3 Substituting into Equation (c) we get: 1.3 = 0.3 × 3 + 0.2 C3 C3 = (1.3 - 0.9)/0.2 = 2 mg/l00 ml = 2 × 10⁻⁵ gm/cm3 85
  • 9. 3.3 Detailed Spectral Absorption Distribution Curve: It is clear that, for colored solutions, the absorbance varies with wavelength, and hence absorptivity varies with spectral bandwidth used for its calculation. For example, figure (3-5) shows the spectral molecular absorptivity (ξλ) distribution curve of Potassium Permanganate Solution in water as obtained by Beckman spectrophotometer. 0 400 800 1200 1600 2000 2400 2800 400 440 480 520 560 600 640 A B CD E F Wavelength, nm ξλ Figure (3-5) Absorption spectrum of Potassium Permanganate in water solution; as determined on a Beckman DU spectrophotometer. It appears purple due to its wide distribution of absorption. If an absorption measurement on this solution using a green glass filter with transmission limits between lines (A) and (F), the details of ups and downs of the absorption curve is averaged to ξλ = 1700 cm2 /mole. If the wavelength range was limited to the spectrum region, between lines (B) and (E), the average ξ=2300 cm2 /mole. Reducing the wavelength band width to spectral region between lines (C) and (D), the value of ξ = 2500 cm2 /mole. That is why, in order to determine true absorption curve with full details, a spectrophotometer whose 86
  • 10. monochromator isolates very narrow spectral wavelength bands of radiation must be used. Sometimes the shape of the spectral absorbance distribution curve, changes with concentration. This means that such solution does not obey Beer's law, as for Potassium Chromate Solution (K2Cr2O7). 3.4 Photometric Accuracy: Even for a solution which shows no deviation from Beer's Law, the concentration range over which accurate photometric analysis is useful, is limited at both high and low levels. At high concentrations of absorbing material, little radiant energy will penetrate to the detector, so that the photometer becomes less sensitive. At low concentrations, the error in reading the meter or recorder, becomes large compared with the measured quantity (the concentration). In photometric instruments, the recording is proportional to the intensity of radiation falling on the detector. In measuring absorbance, (∆A/A) must be minimum for greater accuracy. Figure (3-6) shows relative absorbance error (∆A/A) as related to transmittance (T= I/Io). Minimum value of relative absorbance error (∆A/A) occurs at T = 0.368. Practically the small range around this value is considered suitable for best photometric accuracy, i.e. 0.15 < T < 0.65 or 0.8 > A > 0.2. 0 0 20 40 60 80 100 2 4 6 8 10 Percentrelativeerror Percent transmittance Figure (3-6) Relative error (∆A/A) as a function of transmittance(%T) 87
  • 11. 3.5 Instrumentation In The Ultraviolet and Visible Regions of Spectrum: As previously shown, the emission and absorption of the ultra violet and visible radiation are due to electron transitions in the outermost orbits of the atoms, ions or molecules of the absorbing substances. For white light, the color of the liquid is usually the complement of that absorbed by the liquid. Hence the color of the Liquid is important to the analytical chemist, since the absorbed radiation is characteristic to the absorbing liquid. White light (W) can be matched by (i.e appears to the eye as equivalent to) a certain mixture of Red (R), Green (G) and Blue (B) Lights. This is shown by the following symbolic equivalence: (W) ≡ (R) + (G) + (B) ≡ (r + r) + (g + g) + (b + b) where (r), (g) and (b) are parts of Red (R), Green (G) and Blue (B). Also the complement of any color is defined by the following symbolic equivalence: (White) = (Color) + (Its Complement) This explains the symbols and hence the color names, given in the following Table (3-1) showing the wavelength ranges and complements of the familiar colors known in our everyday life. Wavelength Range (nm) Color Complement 400-465 Violet (r+B) Yellow Green (r+g)+(g) 465-482 Blue (B) Yellow (R)+(G) 482-498 Blue Green (B)+(G) Red (R) 498-530 Green (G) Red Purple (r)+(r+B) 530-576 Yellow Green (r+g)+(g) Violet (r+B) 576-587 Yellow (R+G) Blue (B) 587-617 Orange (r+g)+(r) Greenish Blue (g+B) 617-800 Red (R) Blue Green (B+G) Table (3-1): Familiar Colors and their Corresponding Wavelength Ranges and Complements 88
  • 12. We are going now to discuss samples of different types of Instruments, namely: (A) Visual Colorimeters. (B) Filter Photometers. (C) Spectrophotometers. 3.5.1 Visual Colorimeters: In which eye is used to detect difference between samples. They are less expensive and of adequate precision (absolute accuracy + 5%). 3.5.1.1 Nessler's Tubes: It consists, of two similar tubes (A) and (B) of about 30 cm height, their lower ends are closed by plane windows and illuminated by a uniform diffuse lamp. Tube (A) contains the solution under test to a certain marked height, and tube (B) can be filled to the same height by a series of the same solution of standard concentrations and small differences. The two halves of the field of view are compared visually until the transmittance of the sample in tube (A) is bracketed between two standard solutions (CR1) and (CR2) in tube (B) of small difference in concentration corresponding to slightly darker and slightly lighter appearance than that of tube (A). The concentration of the sample can be estimated by interpolation between the corresponding values of concentrations of these standard solutions. 3.5.1.2 Dubosco Comparator: In which Nessler's tubes are used, but the height of standard solution of known concentration is varied until the transmitted intensity of samples(S) and standard reference (R) are equal as compared visually. This means that their absorbances are equal, i.e. AS = AR i.e. asbsCs = aRbRCR But as = aR (the same solution), then Cs = CR (bR/bS) 89
  • 13. 3.5.2 Filter Photometers: 3.5.2.1 Photoelectric Colorimeter: As shown in figure (3-7), Two identical light beams from an incandescent tungsten lamp at the centre of curvature of a spherical concave mirror (M) and focus of a converging lens (L), are reflected on (M), then collimated by (L), then pass through a Filter (F), then focused by 2 small similar lenses (Ll) and (L2) on two matched Photo-Voltaic Cells (Pl) and (P2), one beam through a cuvet (S) containing the sample, the other through a slit (S) of adjustable width. The 2 Photo Voltaic cells, give potentials strictly proportional to the Intensity of the light beams incident on them. They are shunted by 2 low value resistors (R1) and (R2). The Resistor (R2) across the Reference cell (P2) is provided by a sliding contact, connected to a sensitive galvanometer (G) to the upper end of Resistor (Rl). The other two ends of Resistors are connected together. Operation: 1-The cuvet (S) is first filled with the solvent, the sliding contact is adjusted to the Top end of Resistor (R2) , corresponding to Maximum Voltage (V) representing 100% Transmittance, and the width of Slit (S) is adjusted to balance the potentiometer system giving zero reading of the galvanometer (G). working photocell PlFilter F L L1 Figure (3-7) 2-The solvent is then replaced by the solution, so, the extra absorption due to the solute decreases the potential difference across the shunt (Rl) across the Working Photo Voltaic Reference photocell P2 S R1 R2 M Lamp L2 G -cuvet + + - 90
  • 14. cell and hence disturbs the balance of the galvanometer. The sliding contact across the reference Photo Voltaic Cell is adjusted to restore the balance of the galvanometer (G). The reading of the linear scale of the slider gives directly the percent transmittance, i.e. Io α Vmax and I α V then T = I/Io = V/Vmax =L/Lmax 3-The filter (F) is changed, and the procedure is repeated for different wavelengths across the visible spectrum. The filter (F) may be colored glass (giving wide spectral band), or interference filter (giving narrow spectral band), as suitable. The photoelectric colorimeter is used in clinical laboratories. Its best precession is ± 3%. 3.5.2.2 Dupont 400 Photometric Analyzer: It consists of a system of building block compartments that can be-arranged in different schemes. The arrangement shown in figure (3-8), is used to compare absorbances of two different samples at same wavelength. A beam of parallel rays of light, from a uniform diffuse light source passes through the interference filter at wavelength (λ), which is varied to scan the visible spectrum, and is then split into 2 beams, by a semisilvered glass plate at 45° to the direction of incident beam, transmitting half of the incident intensity of light and reflecting the other half, at right angles to each other. One beam passes through the reference sample (R), the other beam passes through the measuring sample (S). The two beams then fall on 2 similar vacuum photo cells whose outputs (strictly proportional to the intensities falling on them [Ir] and [Is]), are amplified logarithmically (by operational amplifiers), then feed an electronic difference circuit so that the meter reads directly the difference of absorbances; rs r o s o sr AA) I I og () I I og ()og (I)-og (I −=−= llll ; 91
  • 15. Half-silvered mirror Interference filter Lamp Reference Difference circuit Logarithmic amplifiers Measuring sample Sample photocell Reference photocell Figure (3-8) Schematic representation of the Du Pont 400 Photometric Analyzer If the reference contains solvent and the sample contains the solution, the meter reads the absorbance of the sample as referred to the solvent. It can be calibrated to read directly, the concentration of the solution, if it obeys Beer's law. 3.5.3 Spectrophotometers: There are two types of Spectrophotometers: (a) Single Beam, and (b) Double Beam. 3.5.3.1 The Single Beam Spectrophotometers: The single beam type requires interchange of sample and reference liquids at each wavelength, and hence is more suitable to manual operation. 1. Bausch and Lomb Spectronic 20: It is widely used for visible spectrum (wavelength range from 340 to 625nm which can be extended to 950 nm, by changing the photocell). 92
  • 16. Figure (3-9) shows the optical Design of the spectrophotometer. It is not a Littrow Type, since the lens is not traversed twice. A divergent beam from the lamp is condensed by lens (L1) on the entrance slit (Sl). A divergent beam from (Sl) is made slightly convergent by lens (L2) to fall on plane reflection grating (G) of 600 Lines /mm, through to focus on the exit slit (S2). This gives less degree of monochromaticity (spectral wavelength band about 20 nm = 200 A). The reference and the sample are placed alternately in the path of the beam after the exit slit, before falling on the measuring gas filled photoelectric cell whose output is passed in a special amplifier compensated to reduce its nonlinearity. Lamp intensity fluctuations due to instability of voltage of power supply, give varying deflections causing inaccurate results. This can be corrected by an electronic voltage regulator by using an auxiliary photocell to monitor the lamp directly. Overlapping orders due to diffraction grating is corrected by using a blocking filter (used only with the infrared phototube) placed in between the exit slit (S2) and the cuvet containing the sample or reference. Spectronic 20 is an easily operated spectrophotometer, and relatively inexpensive and is used where a filter photometer would serve equally well. L1 L2 G Blocking filter Sl S2 Measuring Photoelectric cell Reference Photoelectric cell Sample Mask Lamp Figure (3-9) Optical diagram of the Bausch & Lomb Spectronic-20 spectrophotometer. (2) Beckman Model Du Spectrophotometer: It is very widely used for visible and ultra violet regions in both theoretical and analytical 93
  • 17. purposes. Carriage bearing for cuvets M1 P S M2 Lamp Semisilvered plate Photoelectric cell Figure (3-10) Optical system of the Beckman DU spectrophotometer Its optical system, as shown in figure (3-10), is of the classical Littrow type using a 30° silvered back prism. It has interchangeable Tungsten and Hydrogen (or Deuterium) lamps for visible and ultra violet spectral regions and suitable photo tubes as required to cover this complete range of spectrum. A photo multiplier is available to increase the sensitivity of the spectrophotometer. Semi silvered glass plate reflects the incident beam, deflecting it through 90° and transmitting the dispersed beam into the Detector through the sample or reference. The spectrum extends down to a lower limit of 210 nm by using natural Quartz prism, and this is opened down to 165 nm by using optical quality vitreous Silica prism. The upper limit of spectrum extends to about 650 and 1000nm. The fluctuations which appear in the intensity of the source of radiation due to lack of regulation in the voltage of the power supply, and aging of the lamp and other components, cause error in single beam spectrophotometer. This can be reduced by using voltage regulating transformer or by using a photocell to monitor the intensity of the lamp. 3.5.3.2 The Double Beam Spectrophotometer: In the double beam type, one beam crosses the reference, the other crosses the sample simultaneously and is hence more suitable for automatic recording. Also, the double beam 94
  • 18. design is the most effective way to eliminate the effects of source variations. An example is the type Jasco /V-560, (range 109 – 900 nm), as shown in figure (3-11). Radiation from Halogen lamp (W) (for Visible and near Infra Red Region) and Deuterium Lamp (D2) (for ultra violet spectral region) enters the double grating monochromator through the entrance slit -(S1). The dispersed monochromatic beam from the exit slit (S2) is directed to rotating (mirror-opening) sector disk (RS) for splitting and chopping. The two time alternating beams are reflected alternately via plane mirrors (m4), (m5). One beam passes through reference cuvet (R) contains the solvent and the other through sample cuvet (S) containing the sample. Mirrors (m), (m), and (m) and the alternating mirror (AM) are used to combine the two beams on the photomultiplier detector (PM). The pulses of radiation from the two paths are out of phase, so that the photomultiplier tube receives radiation from one beam at a time. The Electronic system receives the output from the photomultiplier and split it into two electrical signals of intensities corresponding to the two optical beams through reference (Io) and Sample (I), fed into a comparator giving their ratio (I/Io), either directly as Transmittance (T) or logarithmically [Log (Io/I)] as Absorbance (A). An A/D card and a computer system is used to built in data and plots for either spectral transmittance (T) or Absorbance (A) distribution Curve against (λ) direct1y. Since the radiation is dispersed before incidence on the samples, photochemical decomposition is avoid when operation is in the ultra violet spectral region, also, this minimizes fluorescence effects. Chopping the radiation into successive pulses has the advantage that the electronic system sort out-signals to the two channels excluding unwanted signals (unchopped radiation) by tuning the amplifier to respond only to signals modulated at the chopping frequency. The V-560 has the advantages of reduced stray radiation (below 0.0003%) and high resolution (bandwidths up to 0.1 nm). There are double beam spectrophotometers with only single stage monochromator (only one grating). These are less expensive, but suffer from stray radiation (overlapping orders) which passes from the monochromator to the exit slit but is not within the wavelength band for which the monochromator is adjusted. 95
  • 19. PM AM m10 G1 S1S2 G2 W D2 RS m4 m3 m2 m1 m7 m9 m8 m5 m6 SR Figure (3-11) double beam spectrophotometer Type Jasco/ V-560 Let (Io) be the intensity of the two similar beams falling on the cuvets containing the sample(S) and reference(R), (IS) and (IR) are the intensities transmitted from the sample and reference, respectively, then, The Absorbance of the sample = AS = Log (Io/IS) The Absorbance of the reference = AR = Log (Io/IR) 96
  • 20. AS- AR= Log (Io/IS)- Log (Io/IR)= Log (Is/IR) If the reference is the solvent and the sample is the solution, then, A = (AS - AR) is the corrected absorbance of the sample with respect to the solvent. Since (Io) is the same for the two beams which in this case is not the intensity of the incident beam from the source, then, reasonable changes in the lamp intensity do not affect the measured absorbance value. 3.5.3.3 The Double Wavelength Spectrophotometer: In which two beams of radiation of different wavelengths can be used. Figure (3-12) shows a recent optical design of a double wavelength spectrophotometer. Radiation from Halogen lamp (W) (for Visible and near Infra Red Region) and Deuterium Lamp (D2) (for ultra violet spectral region) is brought to focus at the Entrance Slit(S1) by concave- mirror(Ml), after being divided into two identical parts (I1) and (I2) by a mask (M) with 2 identical and symmetrical windows. These two parts are collimated by concave mirror (M2), whose focus is at (S1), and then fall on two separate gratings mounted on two independent turn tables. The two diffracted parts at different wavelengths (λ1) and (λ2) are brought to focus by a concave mirror (M3) on the exit slit (S2) at its focus. They are then split into two paths by plane mirrors (m1), (m2) and (m3), through the sample (S), or mirrors (m' l), (m' 2) and (m' 3) through the reference (R), then combined and brought to focus, by concave mirrors (M4) and (M4) on the Photo Multiplier Detector (PM). The Rotating Chopping Disc (CD) allows the two beams of different wavelengths to pass alternately in the two optical paths to the Detector. An A/D card and a computer system is used to built in data and plots for different outputs. 97
  • 21. PM G1 S1 S2 G2 m' 2 m3m2 M2 S R M4 M5 m' 3 m1 m' 1 M3 M1 Mask D2 S PM F Figure (3-12) Double wavelength spectrophotometer (a) First arrangement (b) second arrangement There are two optional positions of the sample cuvet: 1. The primary position: A Blocking Filter (F) and the sample (S) are in contact with the photomultiplier, which is used when the two wavelengths are to pass through a single cuvet. The blocking filter is used to correct for overlapping orders due to each of the two gratings 2. The secondary position: which is shown in the main figure, in which double beam passing in the two cuvets, one containing the sample (S), and the other containing the reference (R). Uses of the double wavelength spectrophotometer: 1- It can be used to measure two components of different wavelengths (λ1) and (λ2), without scanning, recording their variation with time. In this case the rotating chopping 98
  • 22. disc and the reference and sample cuvets are removed. The detector receives the sum of the two beams (Il and I2) at wavelength (λ1) and (λ2); simultaneously, or separately using a blocking filter. 2-One Wavelength (λ1 = λo) is fixed at a point of negligible (minimum) absorption for the sample under test, while the other (λ2 = λ) scans the spectrum, thus used as double beam operation with single cuvet only. 3-For Colloidal solutions of heavy turbidity, it can be used in the same procedure as in case (2). Since the optical path in the solution is uncertain due to scattering of rays on suspended matter and its Brownian motion, this arrangement ensures that both beams follow the same path, whatever, it may be. 4-It can be used as a derivative spectrophotometer. In this case the two wavelengths (λl = λ) and (λ2 = λ + ∆λ) scan the spectrum in the same time, such that (∆λ) is a small constant wavelength difference. The resulting spectrogram gives (∆A/∆λ) versus (λ), where (∆A) is the difference between the absorbances of the sample at these wavelengths and (λ) is their mean wavelength. 5-It can be used as an ordinary double beam spectrophotometer, for the sample and the reference. This can be done by adjusting the 2 turn tables of the gratings to scan the spectrum such that λl = λ2 = λ and using the secondary (sample – reference) arrangement. This arrangement corrects for the fluctuations of the source intensity. In all these uses, except the first, the rotating chopping disc feeds the Photomultiplier, alternately with 2 Light Signals I1 and I2. The electronic system splits the output from the photomultiplier into two corresponding separate signals, feeding a comparator and then a computer system, which gives their ratio (T = I1/I2) or logarithmically as Absorbance (A) or as Absorbance Increment (∆A).Also, different plots for any of these functions versus the wavelength (λ) can be obtained. 3.5.4 Sources OF Radiation In The Ultraviolet and Visible Regions of Spectrum (a) Tungsten Lamp: Tungsten Filament Incandescent Lamp is an excellent spectrophotometric source through the Visible and adjacent parts of Ultra Violet and Near Infra Red. 99
  • 23. (Wavelength Range:320 ≤λ≤3500nm). Its life time at high temperature can be extended by filling the lamp with Iodine vapor at low pressure. Iodine reacts with vaporized tungsten such that tungsten atoms redeposit on the hot filament rather on cooler parts of the bulb. The envelope of the lamp is made of quartz to permit operating the lamp at higher temperature and to allow transmission of the Radiation in the Ultra Violet and Infra Red Spectral Regions. (b)Hydrogen and Deuterium lamps: Hydrogen (1H1) and Deuterium (1H2) discharge lamps are universally employed for ultra violet region of Spectrum, giving wavelength range 160 < λ < 360 nm. The Deuterium lamp gives higher intensity and longer lifetime expectancy than Hydrogen lamp. 3.6 Instrumentation in the infra-red region of spectrum The absorption in the infra red (I.R) region of spectrum will be treated separately in this section for the following reasons: (1) The optical systems are different. There are no spectrophotometers which cover both infra red and ultra violet & visible regions without modifications. (2) The physical nature of the absorption of infra red radiation is different from that of the shorter wavelengths (U.V. and Vis.). (3) I.R. spectra are usually plotted as percent transmittance in contrast with U.V. and Vis. spectra shown as absorbance, and hence absorbance bands appear as dips in the former case and peaks in the latter case. 3.6.1 Origin of I.R radiation: The absorption of infra red radiation is due to increasing the energy of vibration or rotation of covalent bonds, which changes the dipole moments of the molecules of absorbing substances. All molecules containing covalent bonds show some selective absorption in the I.R region of spectrum. The only exceptions are the diatomic element gases e.g. Hydrogen (H2), Nitrogen (N2) and Oxygen (O2), since their molecules have no 100
  • 24. vibrations or rotations which produce changes of their dipole moments. It is well known that the molecules of covalent bonds consist of equal and opposite electric charges (+q) and (-q) (since they are neutral), at a short distance (d) which are represented by electric dipoles (as shown in fig. (4-1), of dipole moment (P), given by: p =q d (4-1) As previously shown, the electro magnetic radiation, consists of simple harmonic oscillations of mutually perpendicular electric (E) and magnetic (B) fields, giving rise to transverse waves propagating at normal direction to both fields. When the molecular dipoles are affected by incident radiation in the infra red region of spectrum, they are acted upon by vibrations and rotations which change their dipole moments (as shown in figure (4-2), causing selective absorption, which is characteristic of the substance of the absorbent. Infra red absorption of poly atomic covalent compound is very complex, consisting of many narrow absorption bands, in contrast with broad band absorption in the U.V. and Vis. regions of spectrum due to the interaction between absorbing molecules and their environment. Figure (4-1) Figure (4-2) Electric dipole (molecule of covalent bond) oscillations of electric dipole in an Electromagnetic radiation: Fv =Vibrational Fr = Rotational 3.6.2 Instrumentation: Most infra red spectrophotometers have the same basic designs as those used for U.V. and Vis., modified to allow for the differences in optical materials. There are two other types based on more complex methods which will be studied later. -q d + +q - E + +q - -q F=qE F=qE Fv Fv F Fr r 101
  • 25. 3.6.2.1 Optical materials: (1) In I.R. spectrophotometers, lenses are usually replaced by concave mirrors (highly polished metallic surfaces), since, as previously mentioned (in chapter 2), the mirrors do not suffer from absorption and chromatic aberration, and are easier to manufacture and mount. Dispersive prisms, sample cells (cuvets) and radiation windows (protective covers over slits and detectors), must be made of solid materials, transparent in the wavelength region of interest, as shown in table (3-2). It is noticed that several of these materials are soluble in water, and hence when used must be carefully protected from moisture. A prism of that type, when used must be placed in an air tight compartment, provided with a desiccant to absorb any moisture. Aqueous solutions cannot be placed in cells with salt windows. Salt cells must be stored in a desiccator. Also water absorbs I.R. strongly so that it cannot be used as solvent. Material Limiting (λ) in (μm ) Material Limiting (λ) in (μm ) optical glass 0.40 → 2.6 Ge 18.0 → 23 vitreous silica 0.16 → 4.0 Na Cl 0.20 → 25 Li f 0.12 → 9.0 K Br 0.25 → 40 Ca f2 0.13 → 12.0 Cs Br 0.2 → 55 Si 1.20 → 15.0 K Rs 0.55→ 40 Table (3-2): Infra red transmitting solid materials. 3.6.2.2 Sources: (a) Tungsten filament lamp with iodine vapor filled quartz bulb is satisfactory for near I.R. Its emission wavelength range is 320 ≤ λ ≤ 3500 nm. (b) Nernst glower is the most widely spectrophotometric source in the I.R. region of 102
  • 26. spectrum. It consists of a rod or a hollow tube, about 2 cm long, 1 mm diameter, made of oxides of such elements as cerium, zirconium and thorium. It is heated electrically to high temperature, and can be operated in air since it is not subject to oxidation. (c) Globar: is a rod of silicon carbide of larger dimensions than Nernst glower, operated at lower temperature; to avoid oxidation, and cooled by forced ventilation, because of the tendency of over-heating at the terminals. It has greater emissivity than the glower at wavelengths beyond 30 μm. (d) Simple coil of nichrome wire: is used if the required wavelength range of interest is not too high. 3.6.3 Infra-red spectrophotometers: 3.6.3.1 Beckman infra red spectrophotometer: as shown in figure (4-3), I.R. radiation from source (which may be a Nernst glower or Nichrome wire), is reflected by two similar sets of mirrors forming two symmetrical beams, one passing through the sample cell (s) the other through the reference cell (R), then they are reflected by two further sets of mirrors to be focused alternately on slit (S1) by means of a mirror driven circular chopping disc (C) (half reflecting and half cut off as shown in figure. (S1) is the entrance slit of a reflection diffraction grating (G). Anther version is provided with Littrow monochromator consists of a 60° prism and a mirror combination instead of the grating. 103
  • 27. Figure (4-3) Beckman infra red spectrophotometer S1 S2 D C SR F N G The selected wavelength, by the monochromator, passes through exit slit (S2) and is brought to focus on the thermocouple detector (D), which receives alternately, two square waves whose amplitudes correspond to the intensities of the two beams from the sample 104
  • 28. and reference. Plots for percentage transmittance are obtained using a plotter, or the output is rooted to an amplifier and a computer to analyze the results. In modern versions two gratings are used to give the desired resolution over the whole range of I.R spectrum, the first grating has 3000 lines/cm is slowly rotating to scan the spectrum between wavelengths 2000 to 5000 nm, when reaching wavelength 5μm the grating table automatically turns to bring the second grating (1000 lines/cm) into position resuming scanning the spectrum to cover the wavelength range from 5000 to 16000 nm. Both gratings are operated in the first order and hence four filters (F) are required to eliminate higher orders. 4.3.2 Interference spectrophotometer: Radiation energy consists of trains of electro magnetic waves of different frequencies superimposed. Instantaneous electric and magnetic fields at any point are the resultant of these fields at individual frequencies. In principle full information carried by the beam could be obtained by plotting the response of the detector with time. The frequency of radiation being of the order of 1014 Hz, is too fast to be followed by any known detector. This speed difficulty could be overcome by using an interferometer. Figure (4-4) shows Michelson interferometer used in I.R spectrophotometer. A beam of light from the source is collimated by lens (L) and then divided into two equal parts by means of a beam splitter (B.S.) (semi silvered glass plate) at 45° to the beam, reflecting half of the incident intensity and transmitting the other half at right angles to each other. The two beams are reflected back by mirrors (m1) and (m2) perpendicular to them, and then partially transmitted and reflected by the B.S. to fall finally on the detector (D) as one beam. If the two mirrors (m1) and (m2) are at the same distance from the B.S., the detector will receive the same original time varying electromagnetic fields (without the interferometer), but at half its intensity. If mirror (m2) is moved to the down, the phase difference between the two beams reaching the detector will change and interference results. The change in phase due to a given change in the path depends on the wavelength of the radiation and is shown by the detector in the form of maxima and minima. 105
  • 29. Figure (4-4) Michelson interferometer, as used in a Fourier transform spectrophotometer. m2 IR Source m1 M B.S To detector (D) Mirror (m2) is moved to and fro at a constant speed, for distances of few mms (much longer than wavelengths). If the radiation is monochromatic (λ), figure (4-5a) shows the output to the detector for one scan of mirror m2. Only a line of wavelength (λ), is output during the scan period at certain position of m2 when the two beams of (λ) interfere constructively. Figure (4-5b) shows the output to the detector, when the radiation consists of two colors (λ1) and (λ2). In general, different frequencies of I.R spectrum produce an output interferogram, containing all spectral information of original radiation. λ λ1 λ2 One scan One scan Figure (4-5a) Figure (4-5b) Figure (4-6) shows the optical design of the Fourier Transform Infra Red (FTIR) spectrophotometer. A beam of radiation from the I.R source is collimated by concave mirror (m1) to fall on Michelson interferometer, where it is split into two beams of equal intensities by the beam splitter (B.S.), at right angles to each other, and then they are reflected on their optical paths by plane mirror (m1) and oscillating plane mirror (m2). The 106
  • 30. two beams are reunited by beam splitter (B.S.), to fall on plane mirror (a), then split into two alternate parallel beams by oscillating plane mirror (O.M. 1). The two beams are then focused by concave mirrors (M2) and (M' 2) to fall alternately on sample (S) and reference (R), then reflected on plane mirrors (m3) and (m'3) to the oscillating plane mirror (O.M. 2), where the two alternate beams take the same optical path, to be focused by concave mirror (M3) on the detector (D) to the amplifier and fed to the computer to analyze the results. m' 3 M' 2 O.M. 1 R m2 D IR Source m1 m3 M2 M3 M1 S B.S. computer O.M. 2 Amp mA Figure (4-6) shows the optical design, of a Fourier Transform spectrophotometer, model FTS-14, simplified. (digilab, inc.) For one complete scan of mirror (m2), the detector response fluctuates at a rate depending 107
  • 31. on the speed of motion of the mirror (m2) and wavelength of radiation transmitted from the sample and reference. The resulting interferogram is a Fourier transform of the spectrum and can be interpreted by a the computer which gives the inverse Fourier transform and this shows full details of the radiation at each wavelength. Interferometric or Fourier transform spectrophotometry has great advantages over classical techniques, namely, (1) It uses all frequencies from the source simultaneously, rather than taken them one after the other as in the classical instruments. (2) It increases the sensitivity because of the large amount of radiation entering the slitless instrument. 3.7 Chemical Applications: The absorption of radiation energy in the ultra violet and visible spectral regions is due to transitions of the outermost electrons of the absorbing molecules or ions. This depends primarily on the number of electrons and hence their arrangement in these molecules or ions. 3.7.1 Qualitative Analysis: Ultra violet and visible spectral energy absorption provides a useful source of supporting evidence of structures of organic compounds. Selective absorption is insufficient to serve as an identifying finger print for a particular structure, but it may serve to rule out a number of useful correlations between wavelengths of absorption maxima and the structures have been determined. The measured absorption maxima for an unknown can be compared with determined values for various possible structures. 3.7.2 Quantitative Analysis: (1) Beer's law as expressed by equation (3-6) is widely applied for quantitative chemical analysis of an absorbing substance which obeys this law, if no other material is present to interfere or if interfering material can be removed or corrected using the additively property of absorbance as expressed by equation (3-9). (2) The absorbance of any solute on knowing the absorbances of the solution and the 108
  • 32. solvent, using equation (3-10). (3) The spectral absorption distribution curve of the impurity on knowing that of the pure solution and obtaining that of the impure solution, using equation (3-11). (4) The total absorbance due to a series of solutions or filters transmitted by a beam of radiation one after the other by using equation (3-8). (5) The analysis of certain mixtures of different solutions, which obey Beer's law and do not interact with each other, leading to determination of the concentrations of the ingredient solutions in the mixture as in example (1). 109
  • 33. Problems (1) a particular sample of colored solution which obeys Beer's law, shows 80% transmittance when measured in a cell 1.0 cm breadth, find: (a) The percent transmittance for the .same solution of twice this concentration in the same cell. (b) The breadth of the cell giving the same transmittance for a solution of twice the original concentration. (c) The percent transmittance of the original solution when contained in a cell of 0.5 of breadth. (d) The absorptivity (a) of the solution if the original concentration was 0.005% [T = 64%, b=0.5 cm, T'= 89.44%, a = 1938.2 cm2 /gm] (2) The following table, shows the recorded intensities transmitted through solvent (I) and solution (II) at different concentrations (C) in (mg/l), using a photoelectric colorimeter, to obtain a reference curve for analysis of this solution. Calculate the corresponding transmittances and absorbances plots: (a) the absorbance versus concentration (relation showing if this solution obeys Beer's law or shows +ve or -ve deviation from it. (b) Percent transmittance versus the logarithm of the concentration. (c) Find also the concentration range, along which the solution obeys Beer's law and the corresponding absorptivity (given that b = 1 cm). (3) The molar absorptivity of vitamin (D2) (calciferol) at wavelength 364 nm is maximum and equals (ε = 18200 cm2 /mole). Its solution in alcohol is known to follow Beer's law over a wide range of absorbance 0.4 ≤ a ≤ 0.9 find: (a) Its maximum absorptivity. (b) The range of concentration over which it follows Beer's law, given that its molecular law is 397 and the breadth of cuvet used is 1 cm. [a = 45.844 cm2 gm-1 , 8.725 x 10⁻³ ≤ c ≤19.63 x10⁻³ gm/cm3 ]. 110
  • 34. (4) The following table shows the absorbances of hydrogen peroxide (H2O2) solutions of molybdenum (mo), titanium (Ti) and vanadium (V) each of concentration C = 4 mg/ 100 ml, at wavelengths 330, 410 and 460 nm, and the corresponding values for a certain mixture of these solutions at the same wavelengths. Find the masses of these metals in 50.0 ml of this mixture. State the necessary conditions for solving this problem. [0.5675, 1.9991, 3.1841 mg]. (5) Caffeine (c8h10o2n4h2o) of molecular weight 212.1, has an average absorbance a = 0.510 for a concentration of 1 mg/l00 ml. at wavelength 272 nm. A sample of 2.5 gm of a particular product of soluble coffee is mixed to a volume of 500 ml, then clarified and diluted to half its concentration, and a sample of 500 ml of this solution was tested, showing an absorbance of 0.415 at λ = 272 nm, find: (a) The molar absorptivity of caffeine, (b = 1 cm). (b) The mass of caffeine per pound (453.6 gm) of this soluble coffee product. [1.08171 x 107 cm2 /mole, 1.4764 gm] (6) The molar absorptivity of the Nitrite ion is 23.3 at wavelength 355 nm, and the ratio of the absorptivity at 355 to that at 302 nm is 2.5. The molar absorptivity for the nitrate ion is negligible at λ = 355 and 7.24 at 302 nm. A particular mixture of these ions gave aλ=302 = 1.010 and aλ=355 = 0.730. Calculate the molarities of both ions in the mixture (b = 1.0 cm). [c1 = 0.0313 and c2 = 0.0992 mole/cm3 ] (7) A 12 dynode photomultiplier is found to deliver an average anode current 0.92 ma over a period of 4.2 ns as a pulse resulting from a single ejected photoelectron. Calculate the average multiplication factor of this photomultiplier. (8) The following table shows the relation between the absorbance (A) and molar concentration (c) in (mole L-1 ) of cyc1ohexanone in cychexane solution at λ = 5.83 μm. The breadth of the cell = 0.096 mm. 111
  • 35. c 5 10 15 20 25 30 35 40 45 50 a .190 .244 .293 .345 390 .444 .487 .532 .562 .585 Plot these data: (a) Over what range is Beer's law followed? (b) Find the value of molar absorptivity (ε). [10 ≤ c ≤ 40 mole l-1 , ε = 1 lmole-1 cm-l ] (8) Find the approximate number of photons of infra red radiation of wavelength λ = 10 μm needed to just be detectable with a bolometer having the following specifications: gold receptor dimensions 1.0, 0.1 and 0.005 mm, resistance of thermistor 10 kohm (at 25°c), its temperature coefficient of resistance -500o k-1 , the least measurable change of resistance ∆R = 0.01ohm, given that 10% of the incident intensity of radiation is lost. (Density of gold = 19.32 gm/cm3 , and its specific heat = 0.0308 cal gm-1 o k-1 , electrical equivalent of heat (J) = 4.186 joule/cal). [1.3927 x 10⁵ photons]. 112