How To Determine The Colour Of Transition Metal Complexes
•
3 likes•4,543 views

Many times students ask the question as to how do we figure out what colour a complex will be. This is a basic starting point and applies to the CAPE Chemistry Syllabus, Module 3 Section 5.

Recommended
More Related Content
What's hot
What's hot (19)
Viewers also liked
Viewers also liked (18)
Similar to How To Determine The Colour Of Transition Metal Complexes
Similar to How To Determine The Colour Of Transition Metal Complexes (20)
More from Denison Dwarkah
More from Denison Dwarkah (12)
Recently uploaded
Recently uploaded (20)
How To Determine The Colour Of Transition Metal Complexes
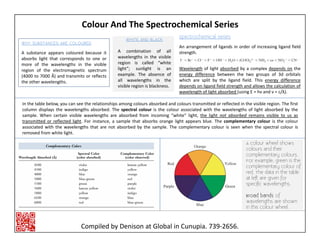
- 1. Colour And The Spectrochemical Series WHY SUBSTANCES ARE COLOURED Spectrochemical series A t f li d i d f i i li d fi ld WHITE AND BLACK A substance appears coloured because it absorbs light that corresponds to one or more of the wavelengths in the visible region of the electromagnetic spectrum (4000 to 7000 Å) and transmits or reflects An arrangement of ligands in order of increasing ligand field strength. Wavelength of light absorbed by a complex depends on the energy difference between the two groups of 3d orbitals A combination of all wavelengths in the visible region is called “white light”; sunlight is an example. The absence of In the table below, you can see the relationships among colours absorbed and colours transmitted or reflected in the visible region. The first l d l h l h b b d h l l h l d h h l h f l h b b d b h (4000 to 7000 Å) and transmits or reflects the other wavelengths. which are split by the ligand field. This energy difference depends on ligand field strength and allows the calculation of wavelength of light absorbed (using E = hν and ν = c/λ). p all wavelengths in the visible region is blackness. column displays the wavelengths absorbed. The spectral colour is the colour associated with the wavelengths of light absorbed by the sample. When certain visible wavelengths are absorbed from incoming “white” light, the light not absorbed remains visible to us as transmitted or reflected light. For instance, a sample that absorbs orange light appears blue. The complementary colour is the colour associated with the wavelengths that are not absorbed by the sample. The complementary colour is seen when the spectral colour is removed from white light. A colour wheel shows colours and their complementary colours. For example, green is the complementary colour of d h d h blred. The data in the table at left are given for specific wavelengths. Broad bands of wavelengths are shown Compiled by Denison at Global in Cunupia. 739‐2656. wavelengths are shown in this colour wheel.