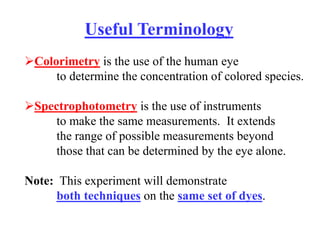
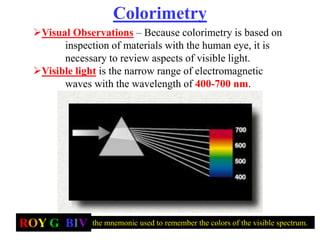
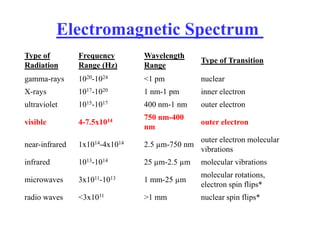
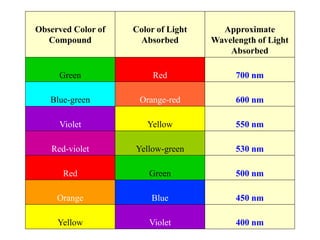
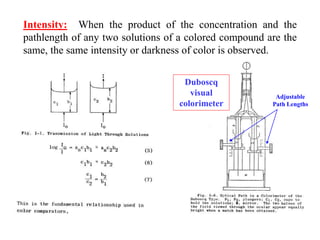
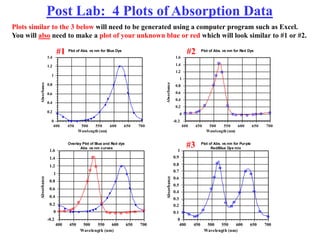
Colorimetry uses the human eye to determine the concentration of colored species, while spectrophotometry uses instruments to make the same measurements over a wider range. This experiment demonstrates both techniques on dyes, using visual observations and a spectrophotometer. Absorbance measurements from the spectrophotometer are plotted versus wavelength to identify dyes. Colorimetry and spectrophotometry rely on the fact that compounds absorb complementary colors of light.

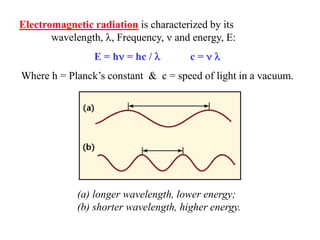
![A = abc
A is the absorbance
Beer-Lambert Law (a.k.a. Beer's law) - the linear relationship
between absorbance and concentration of an absorbing species.
Absorbance
Main use of Beer’s Law is to determine the concentration
of various solutions.
“c” is the concentration of the sample in (mol/L)
“a” is molar absorptivity in L/[(mole)(cm)]
Also called “extinction coefficient” or “”;
it is dependent on the material being studied.
“b” is the path length in cm
The diameter of the cuvette or sample holder which is the distance
the light travels through the absorbing sample. “b” is a constant
when the same size cuvette is used for all samples.](https://image.slidesharecdn.com/colorimetry-240310115945-25b36616/85/Introduction-to-Colorimetry-and-basics-ppt-pptx-15-320.jpg)


![0LD-spectrophotometry-130121010534-phpapp02 [Autosaved] - Copy.ppt](https://cdn.slidesharecdn.com/ss_thumbnails/0ld-spectrophotometry-130121010534-phpapp02autosaved-copy-251007052503-e63bc71f-thumbnail.jpg?width=640&height=640&fit=bounds)


