Downloaded 119 times
![2. Refractive index deviation
A = ε bC × [ n / (n2 + 2)2]
where n is refractive index
3. Instrumental deviation ; difficult to select single wavelength beam
λmax
The effect of polychromatic radiation on Beer’s law.](https://image.slidesharecdn.com/analyticalclass-spectroscopyturbidimetry-140120004923-phpapp02/75/Analytical-class-spectroscopy-turbidimetry-18-2048.jpg)
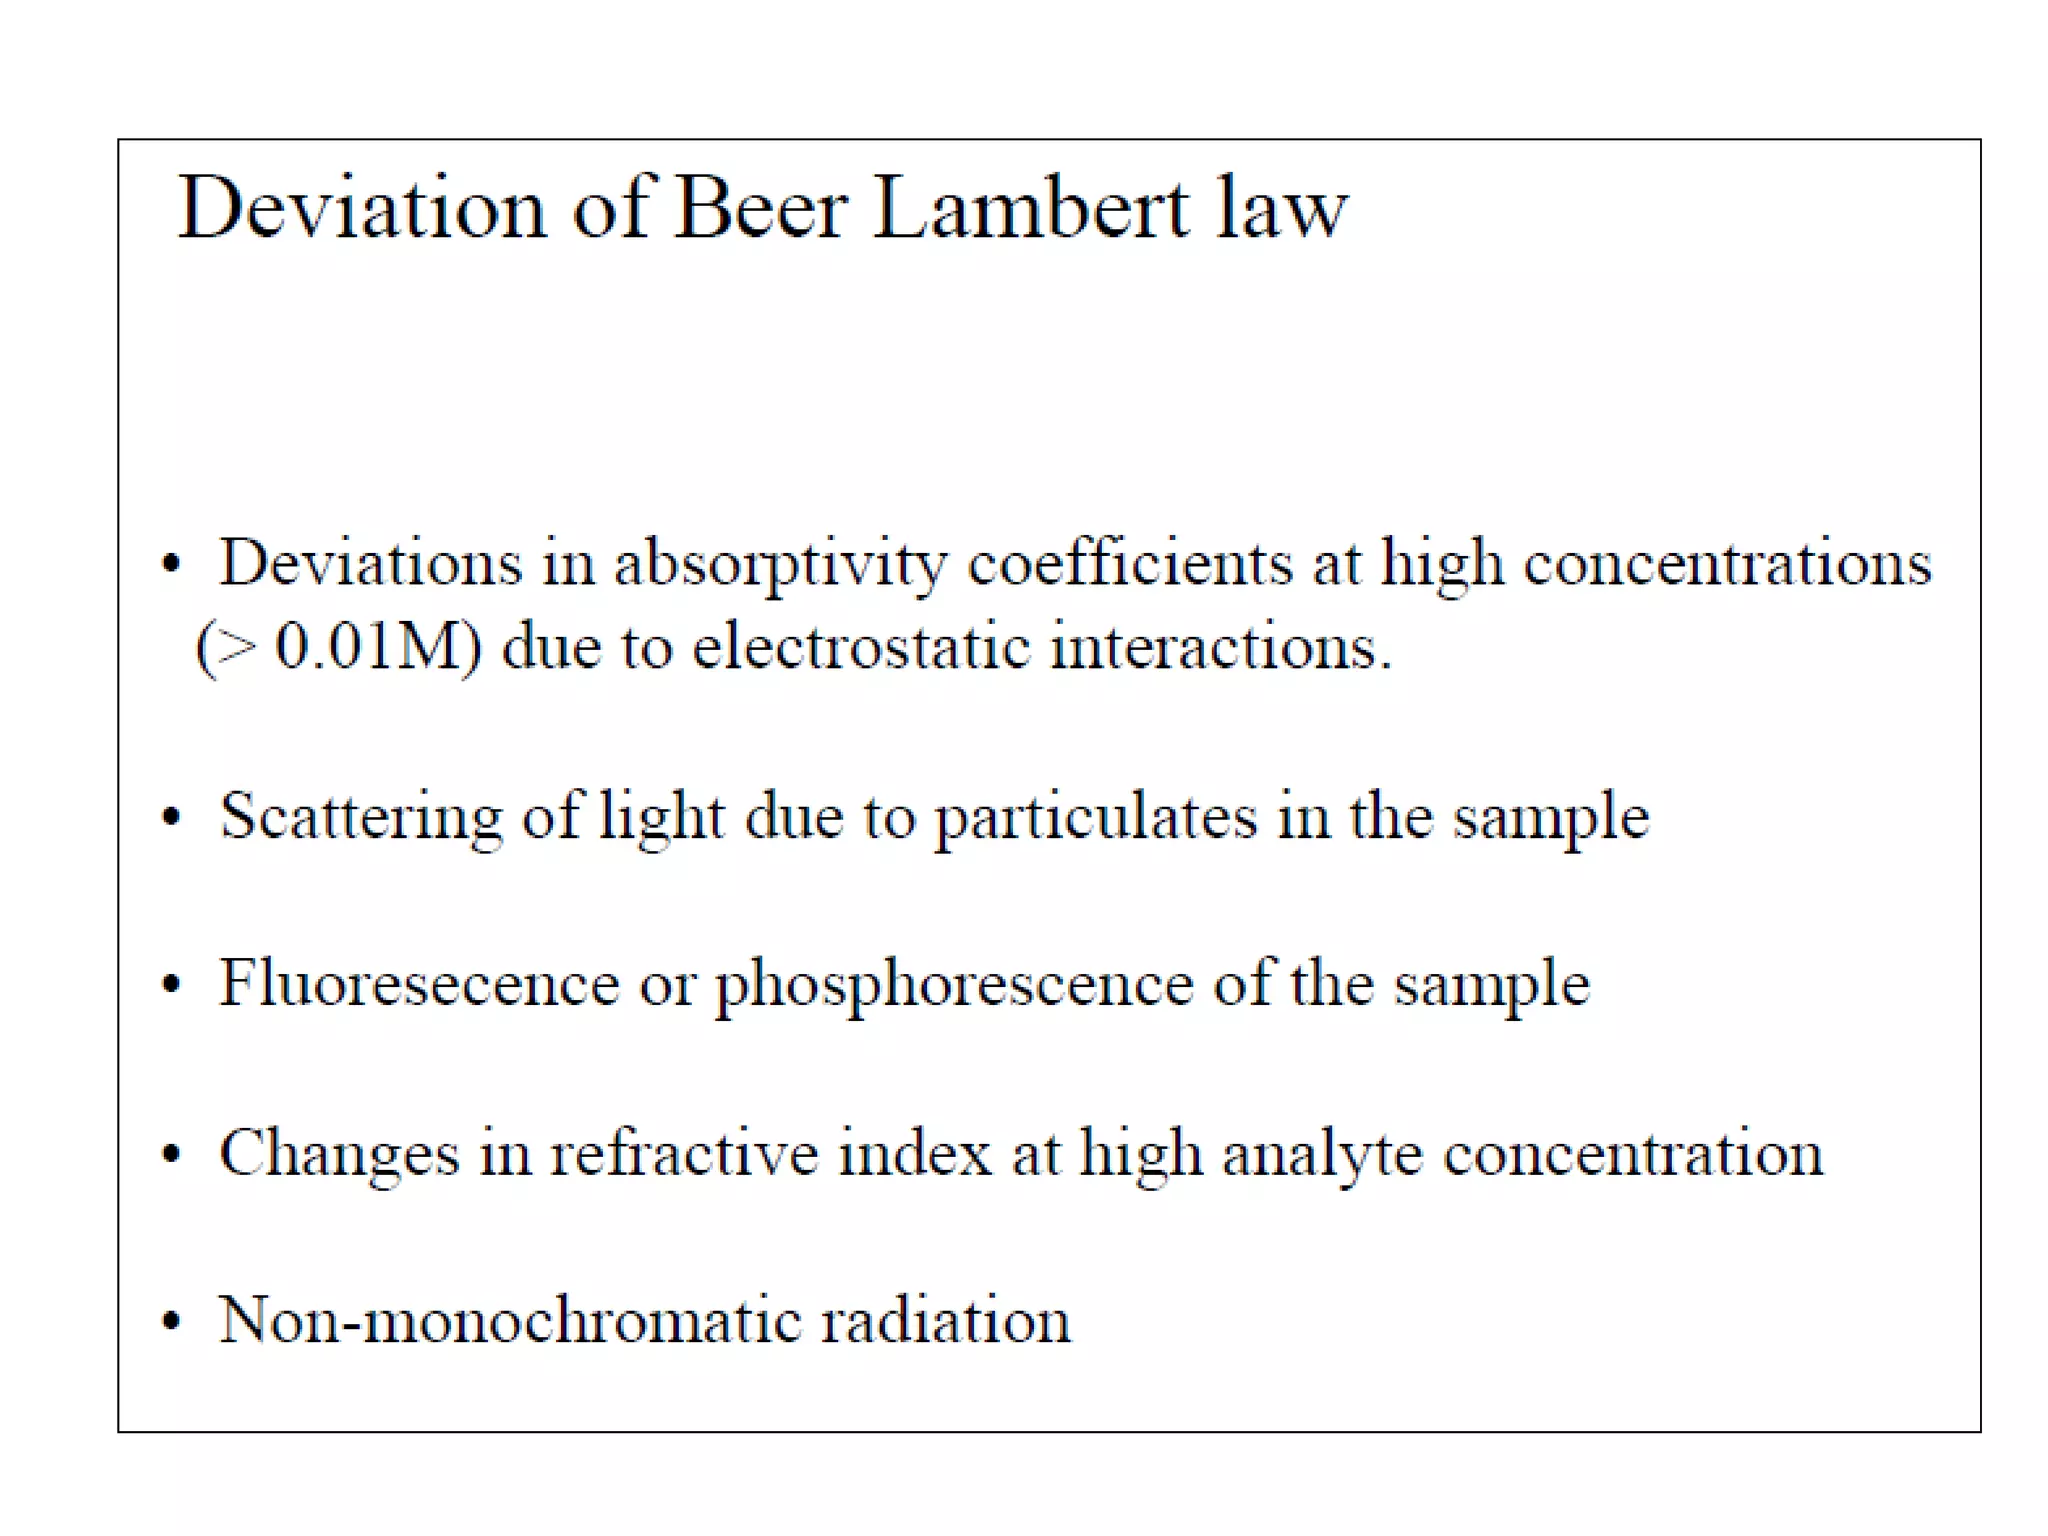
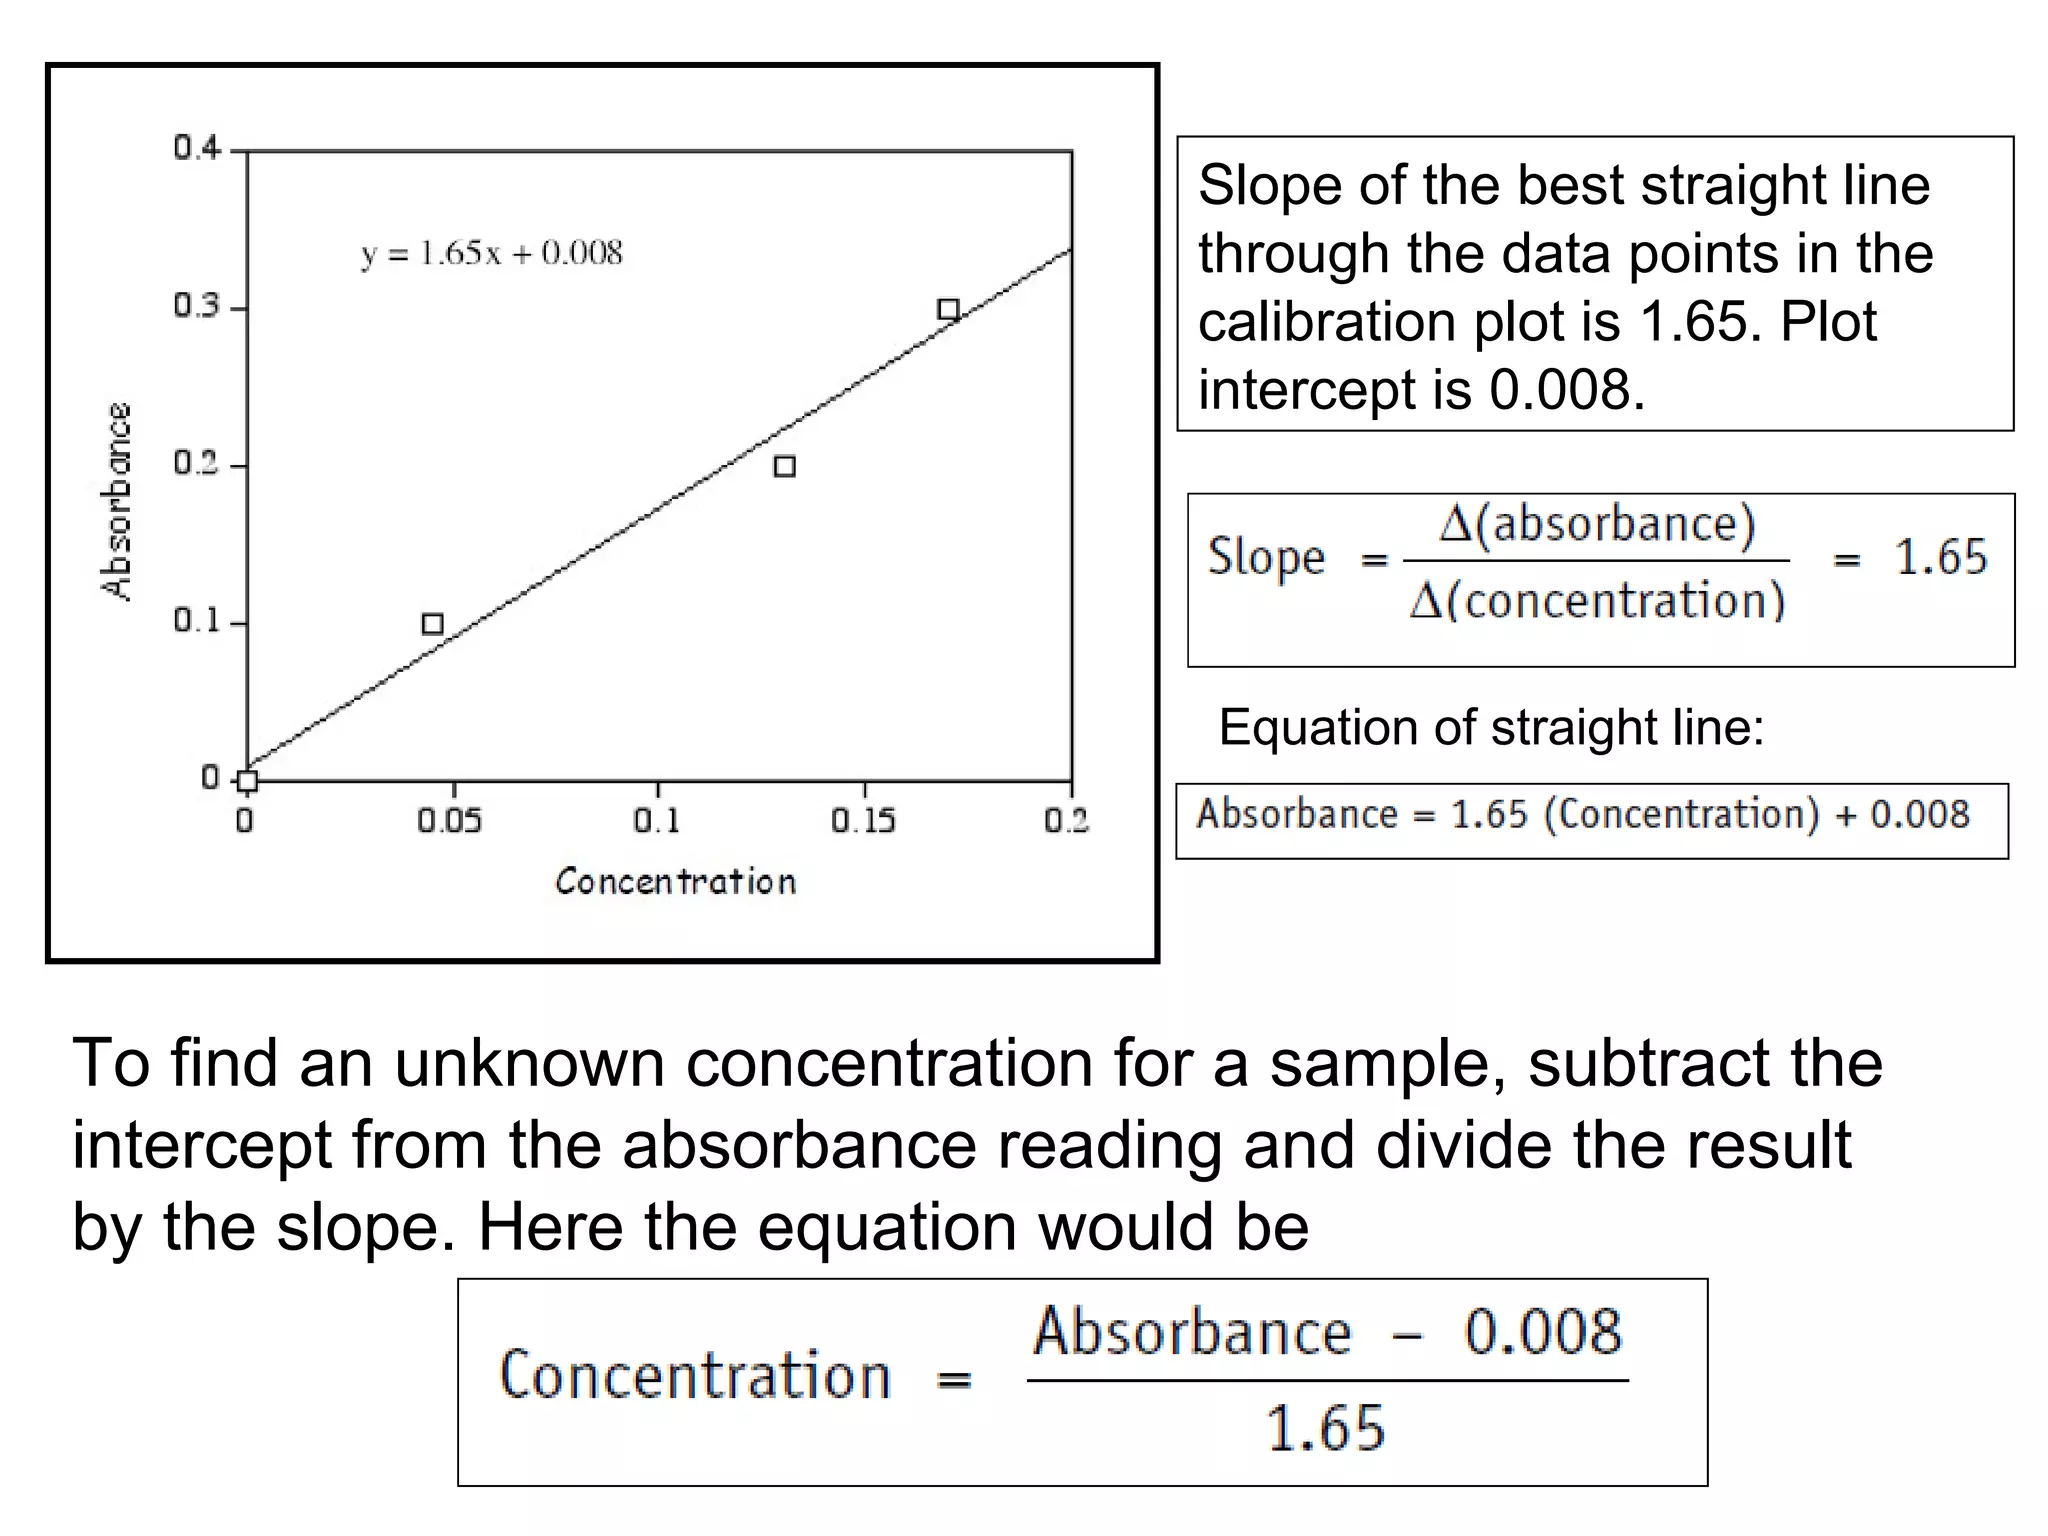
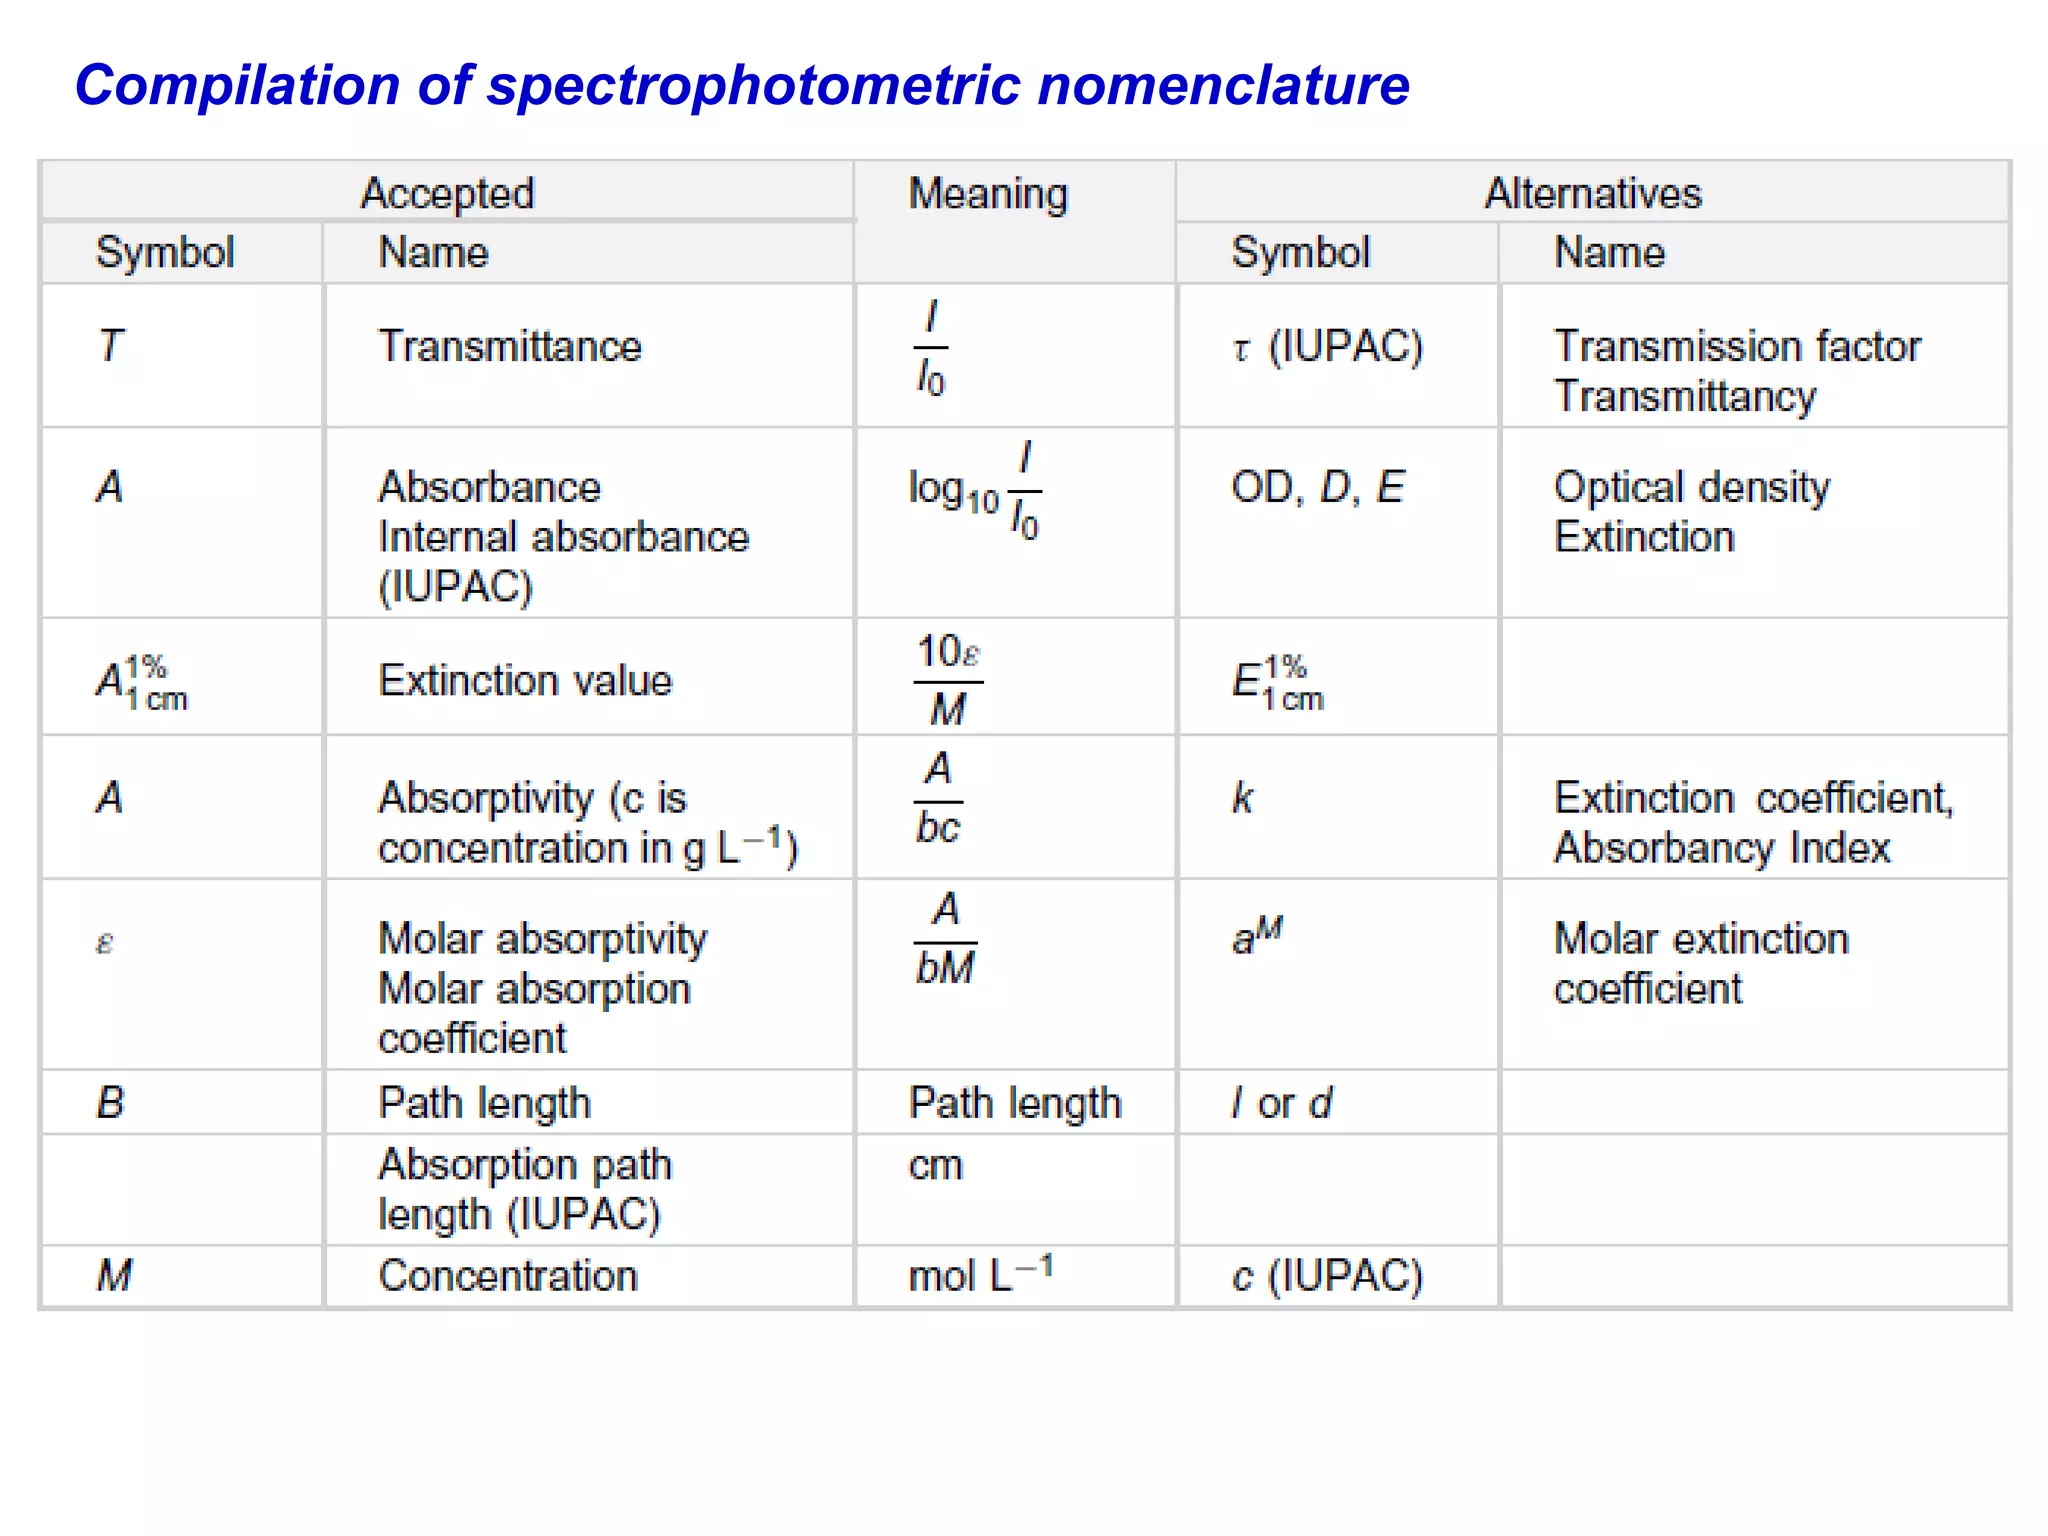
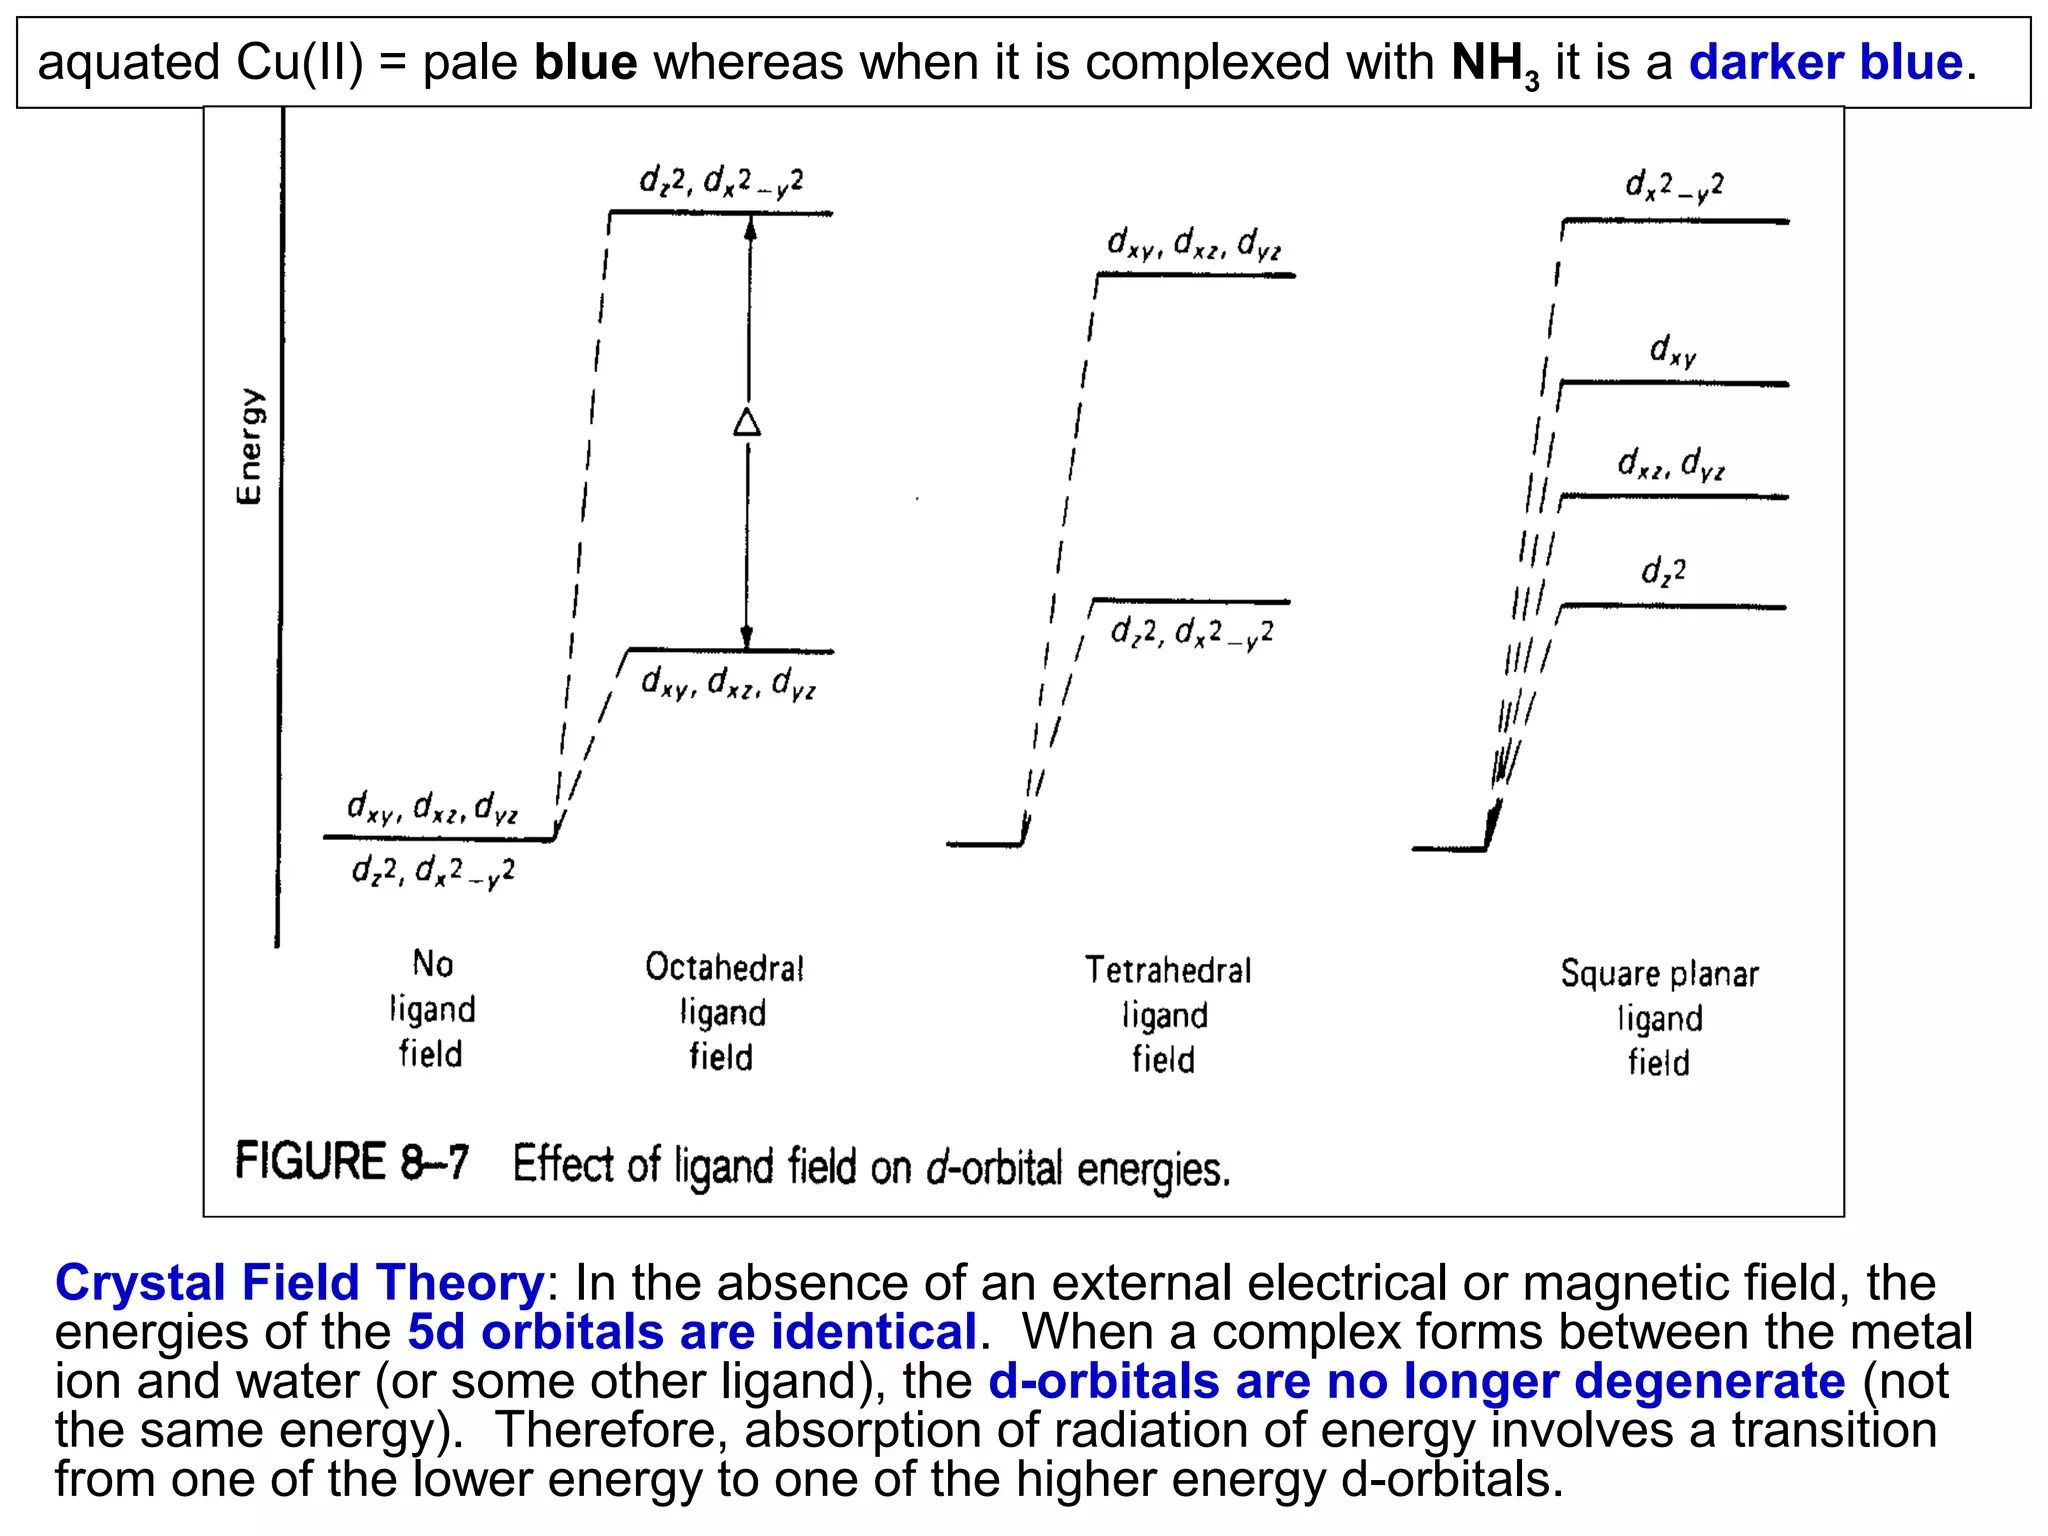


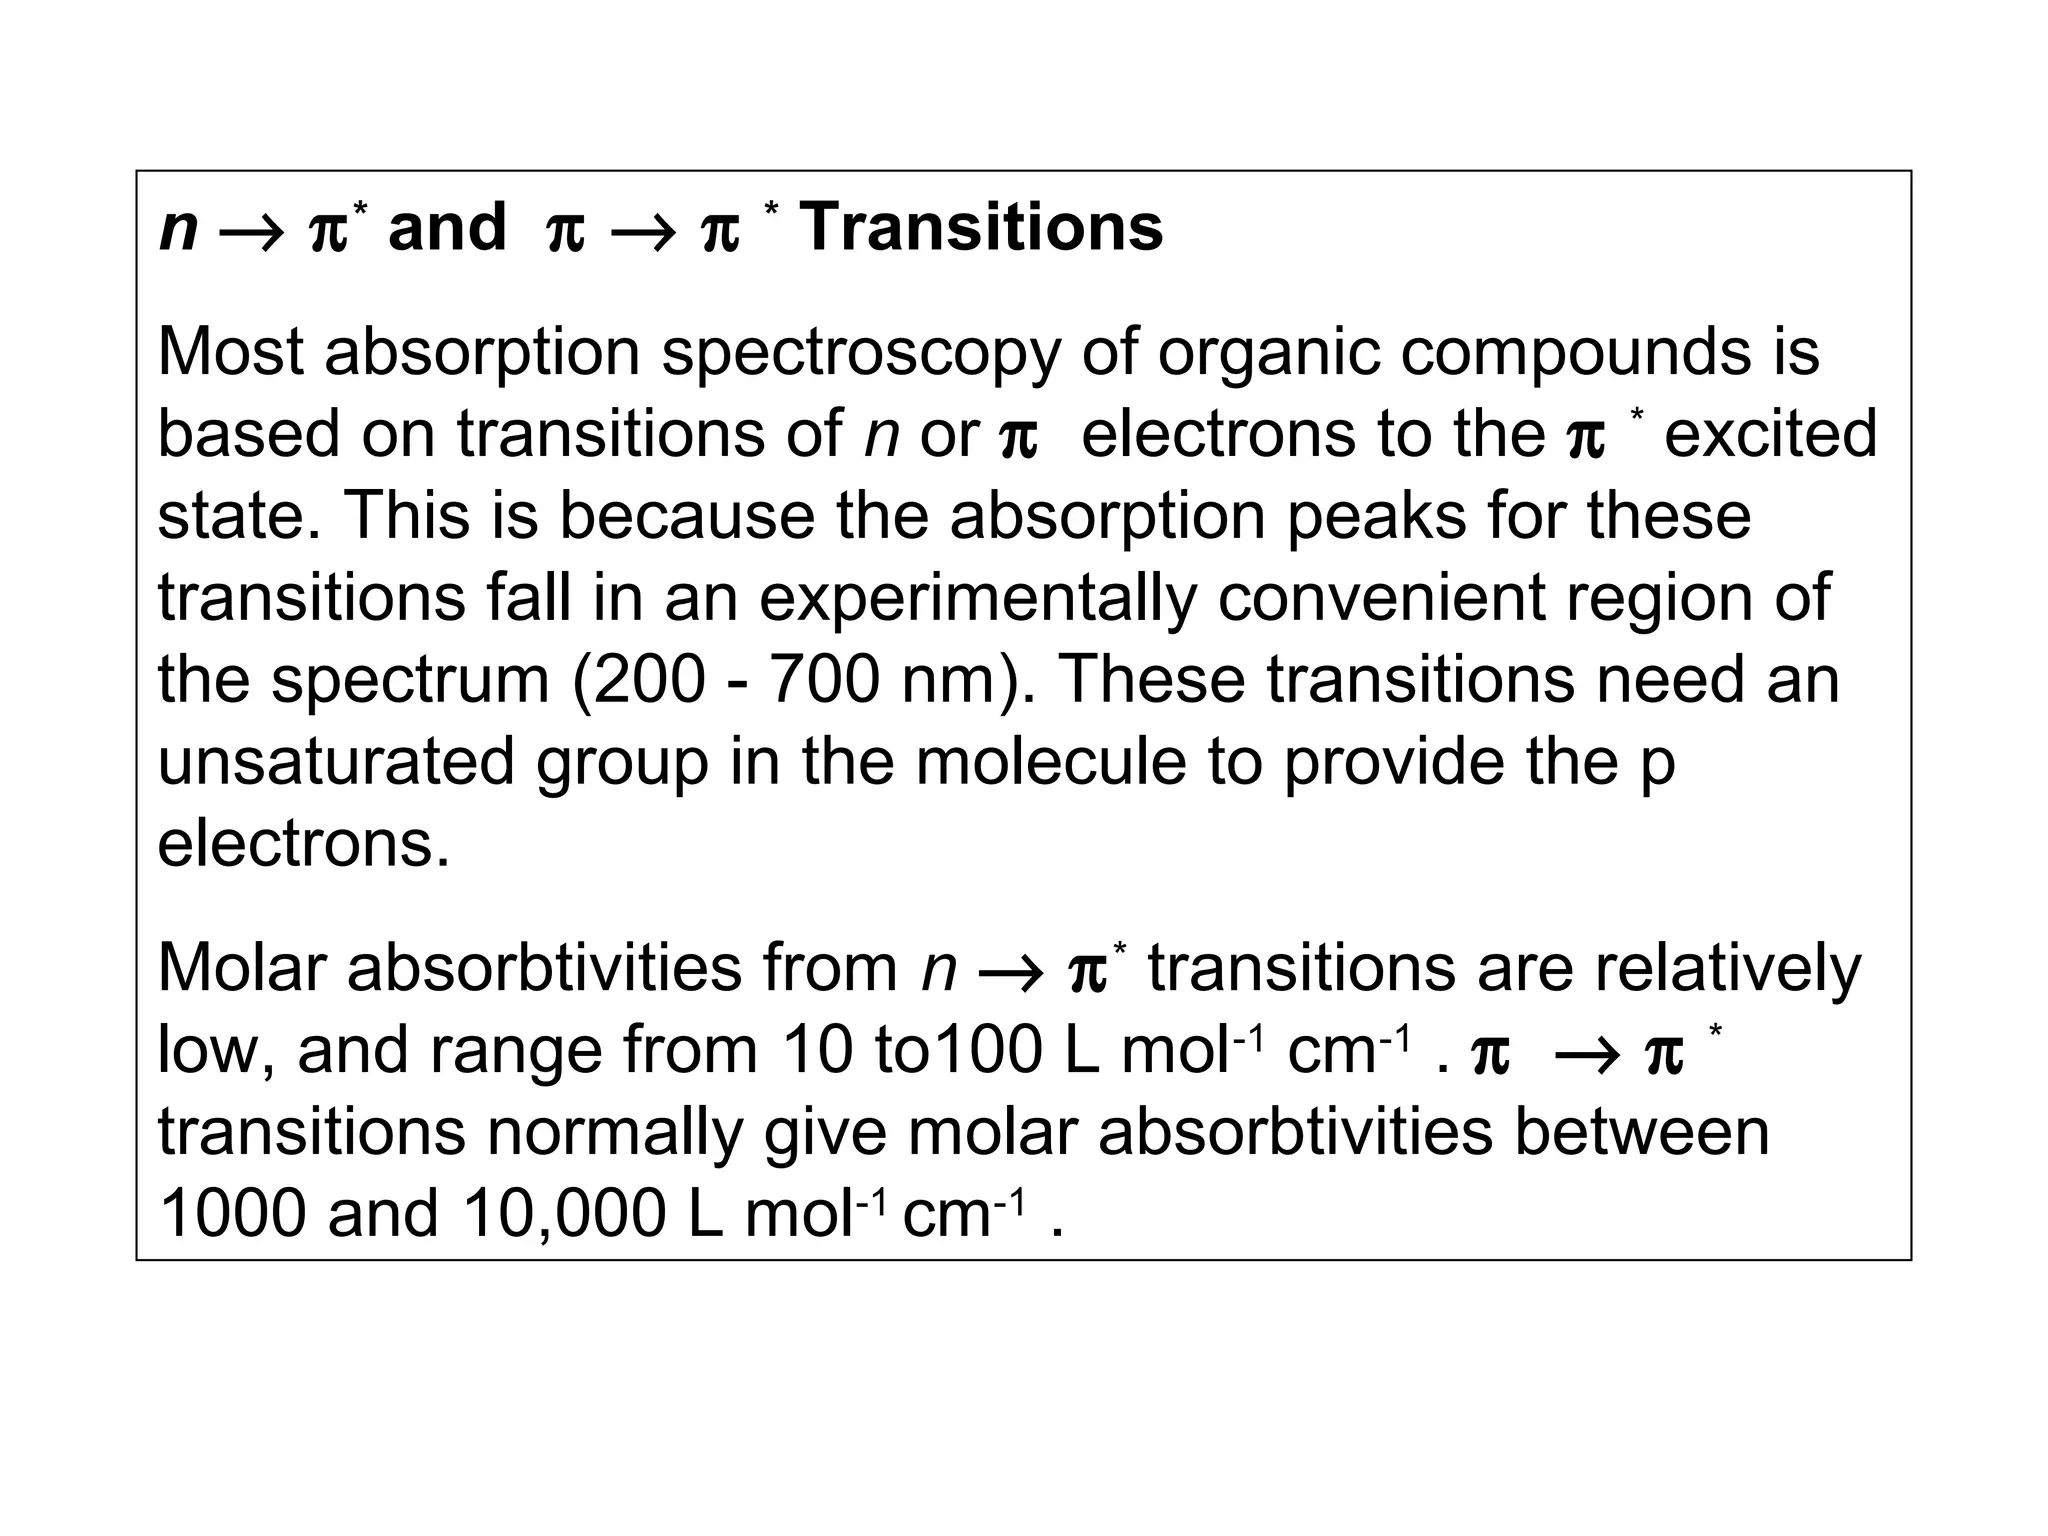

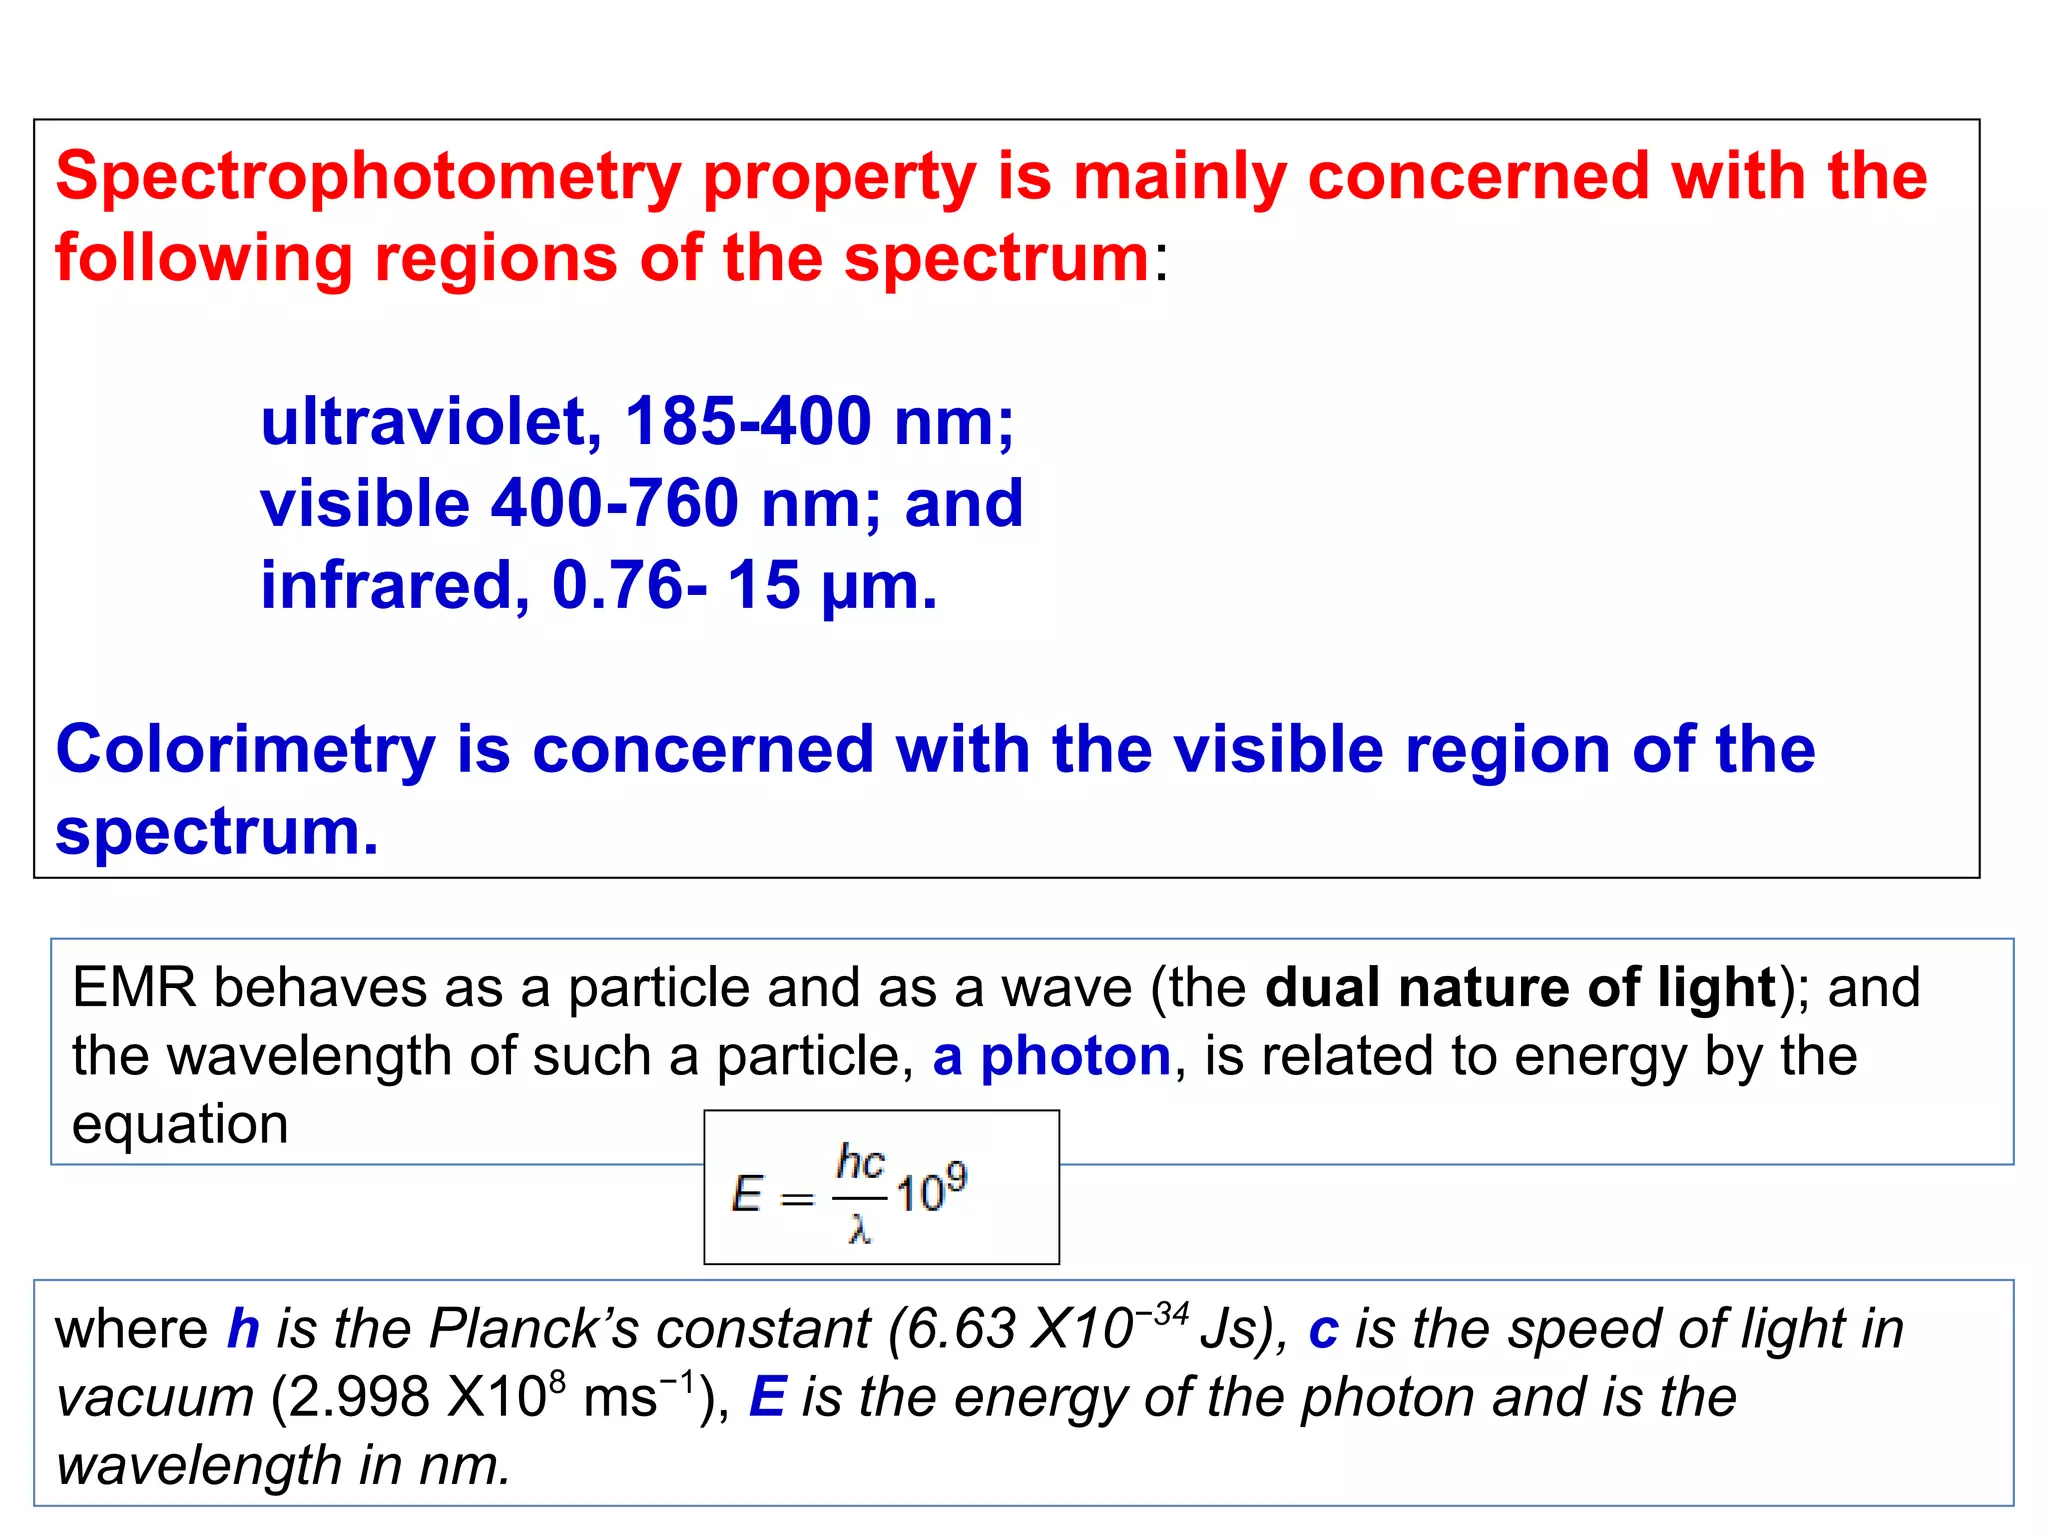
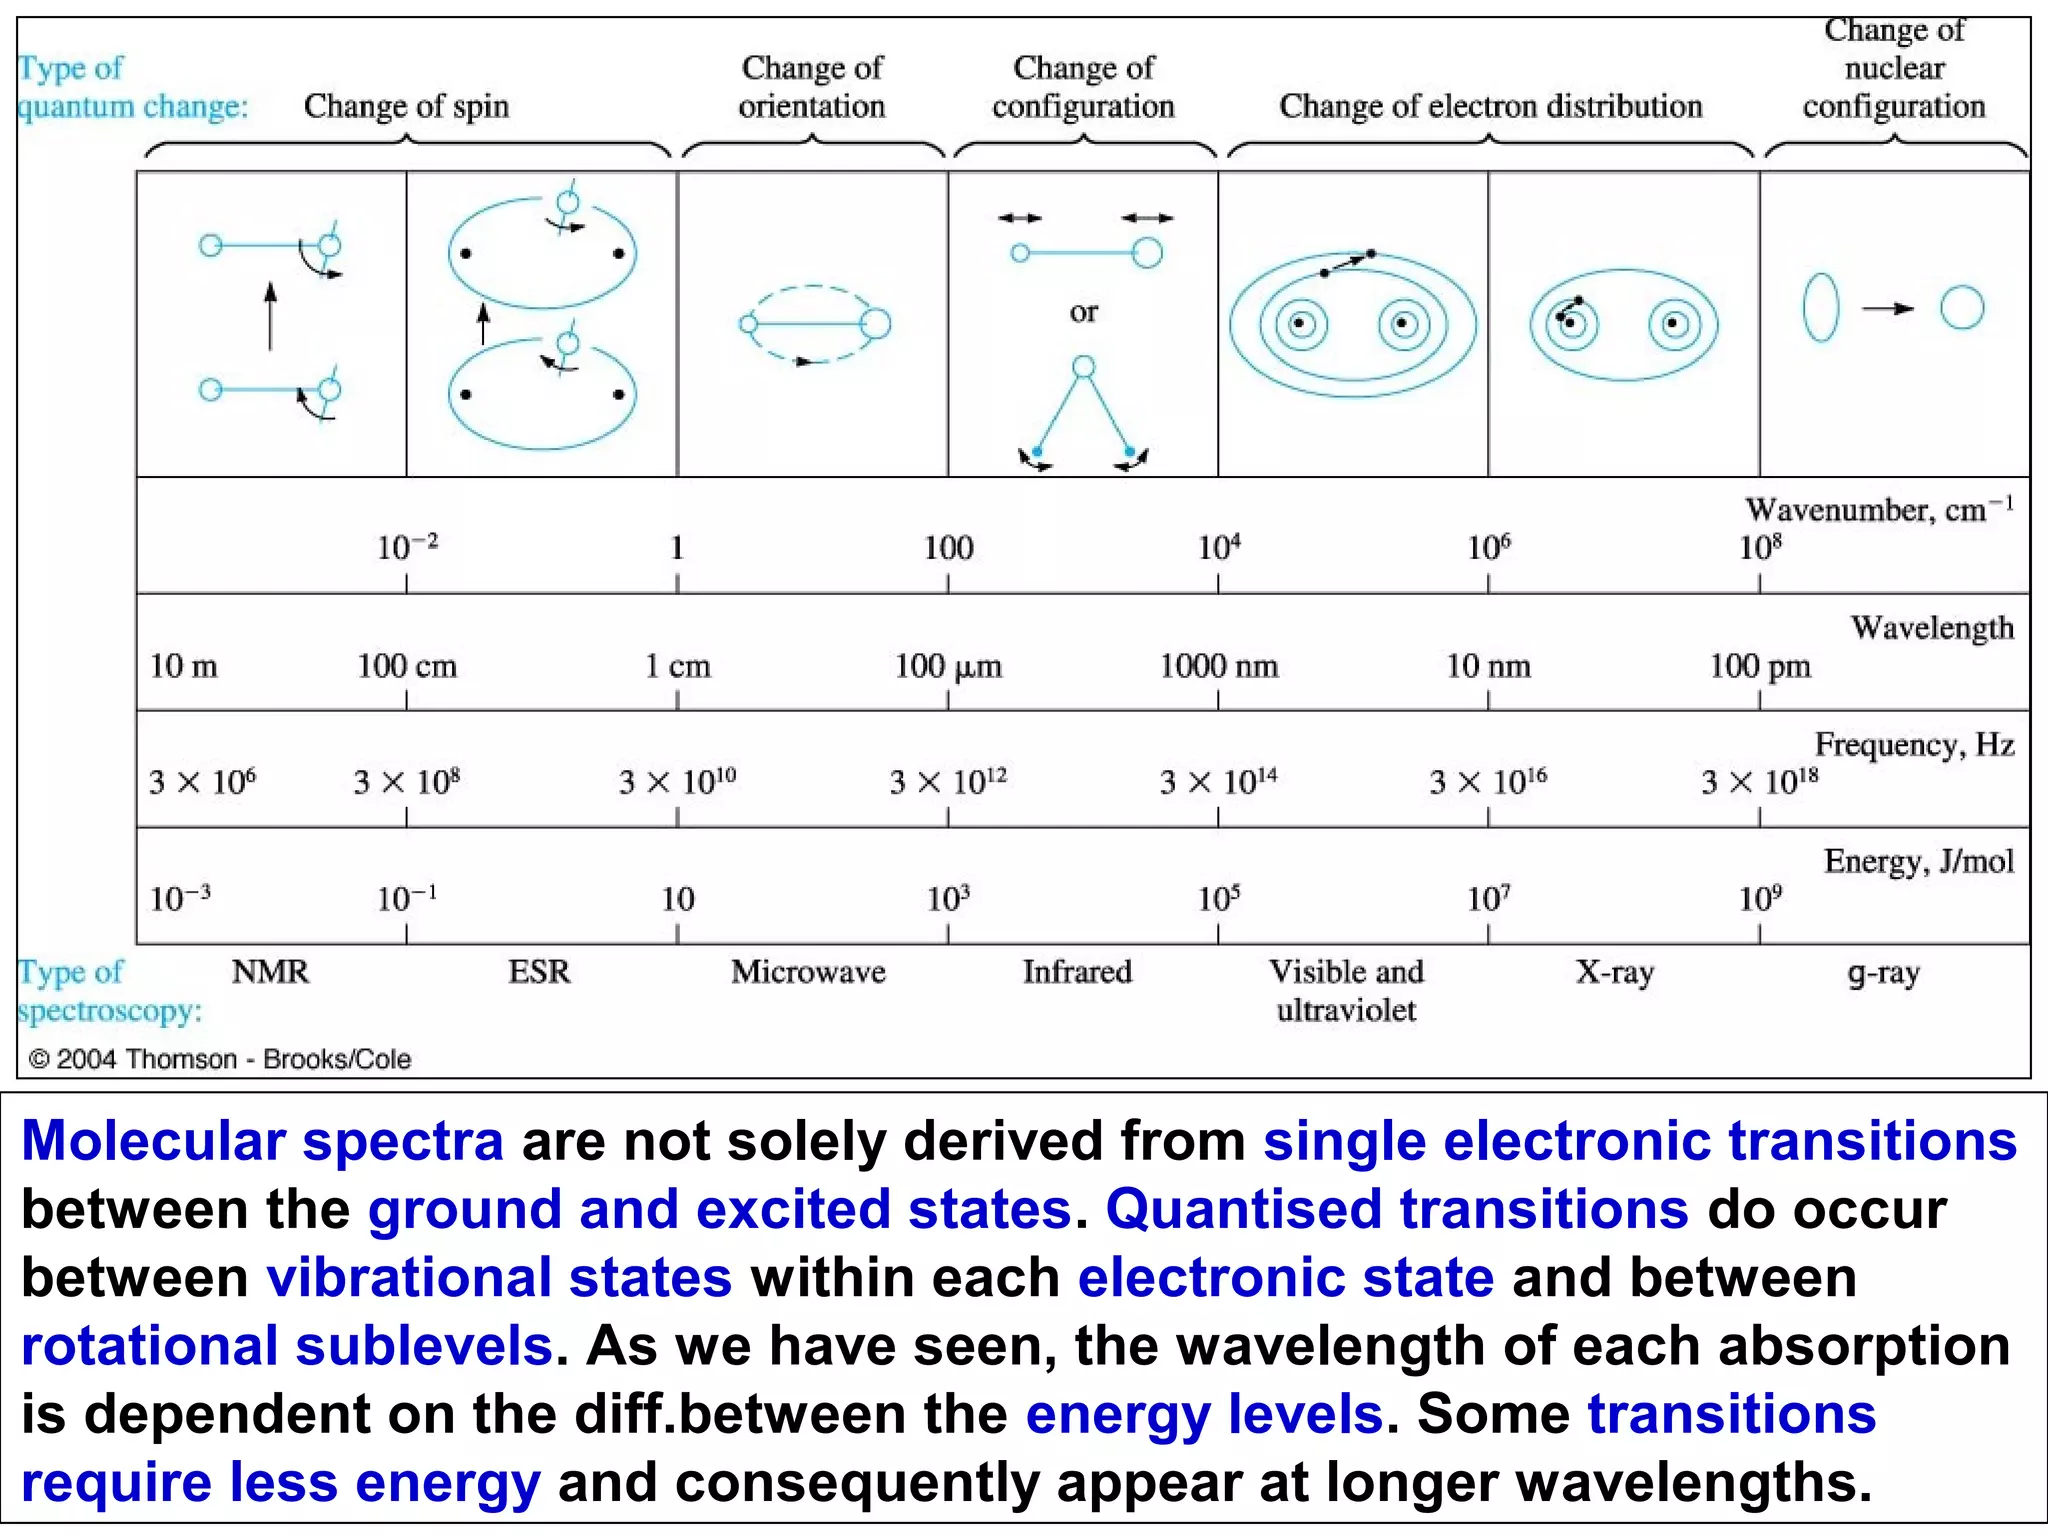
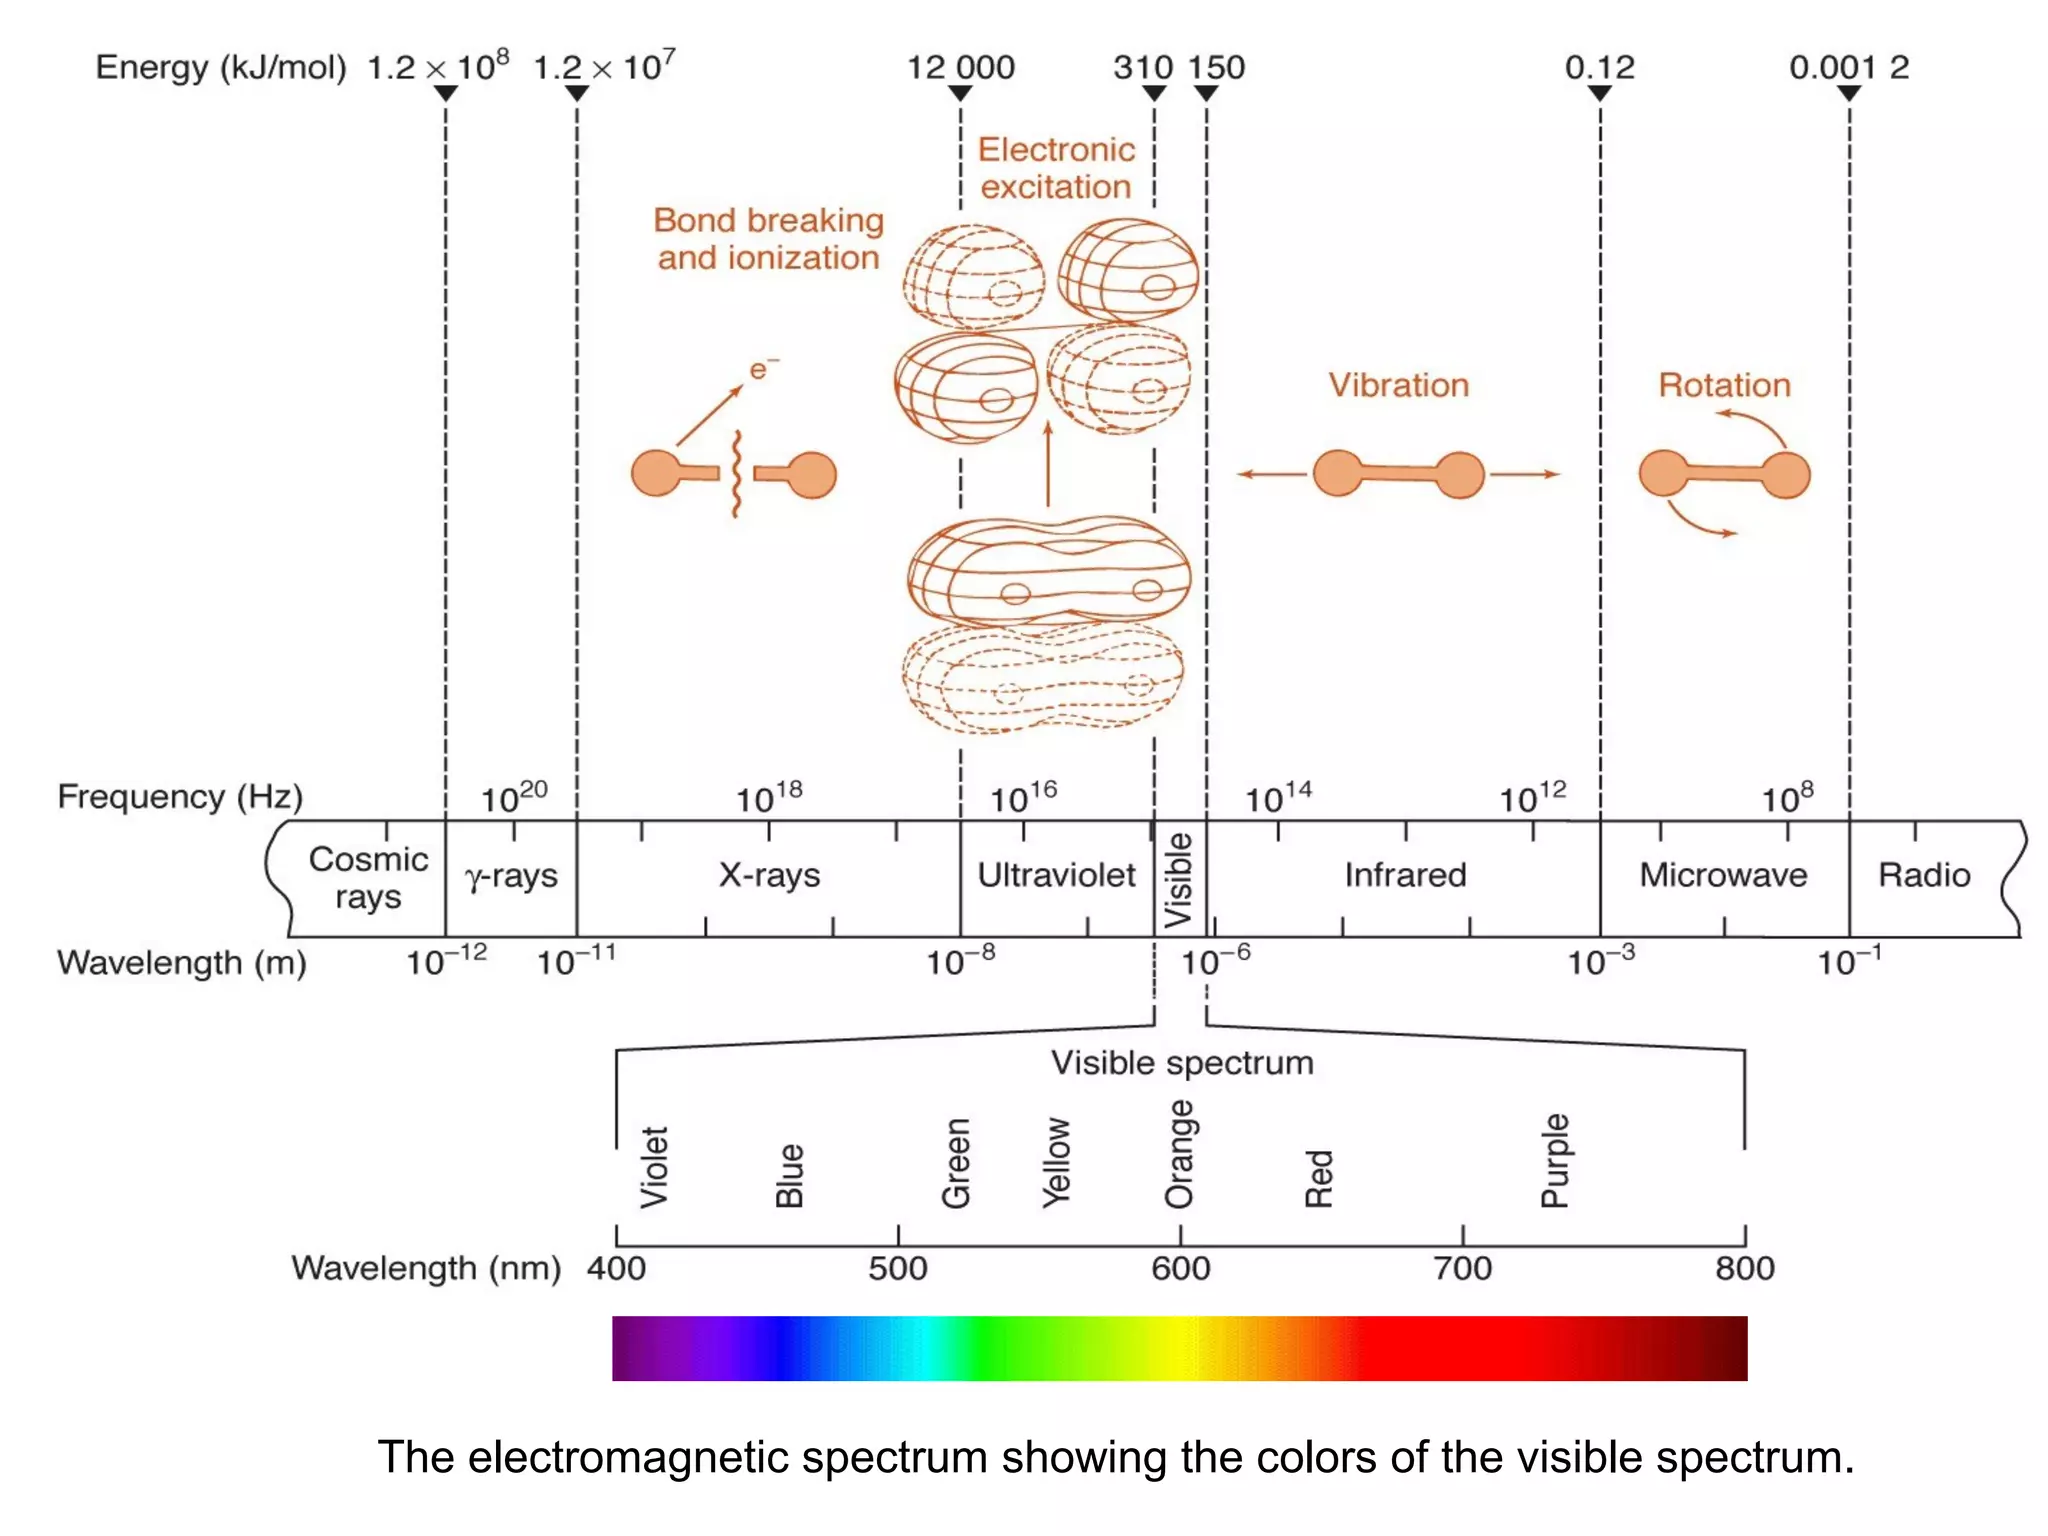
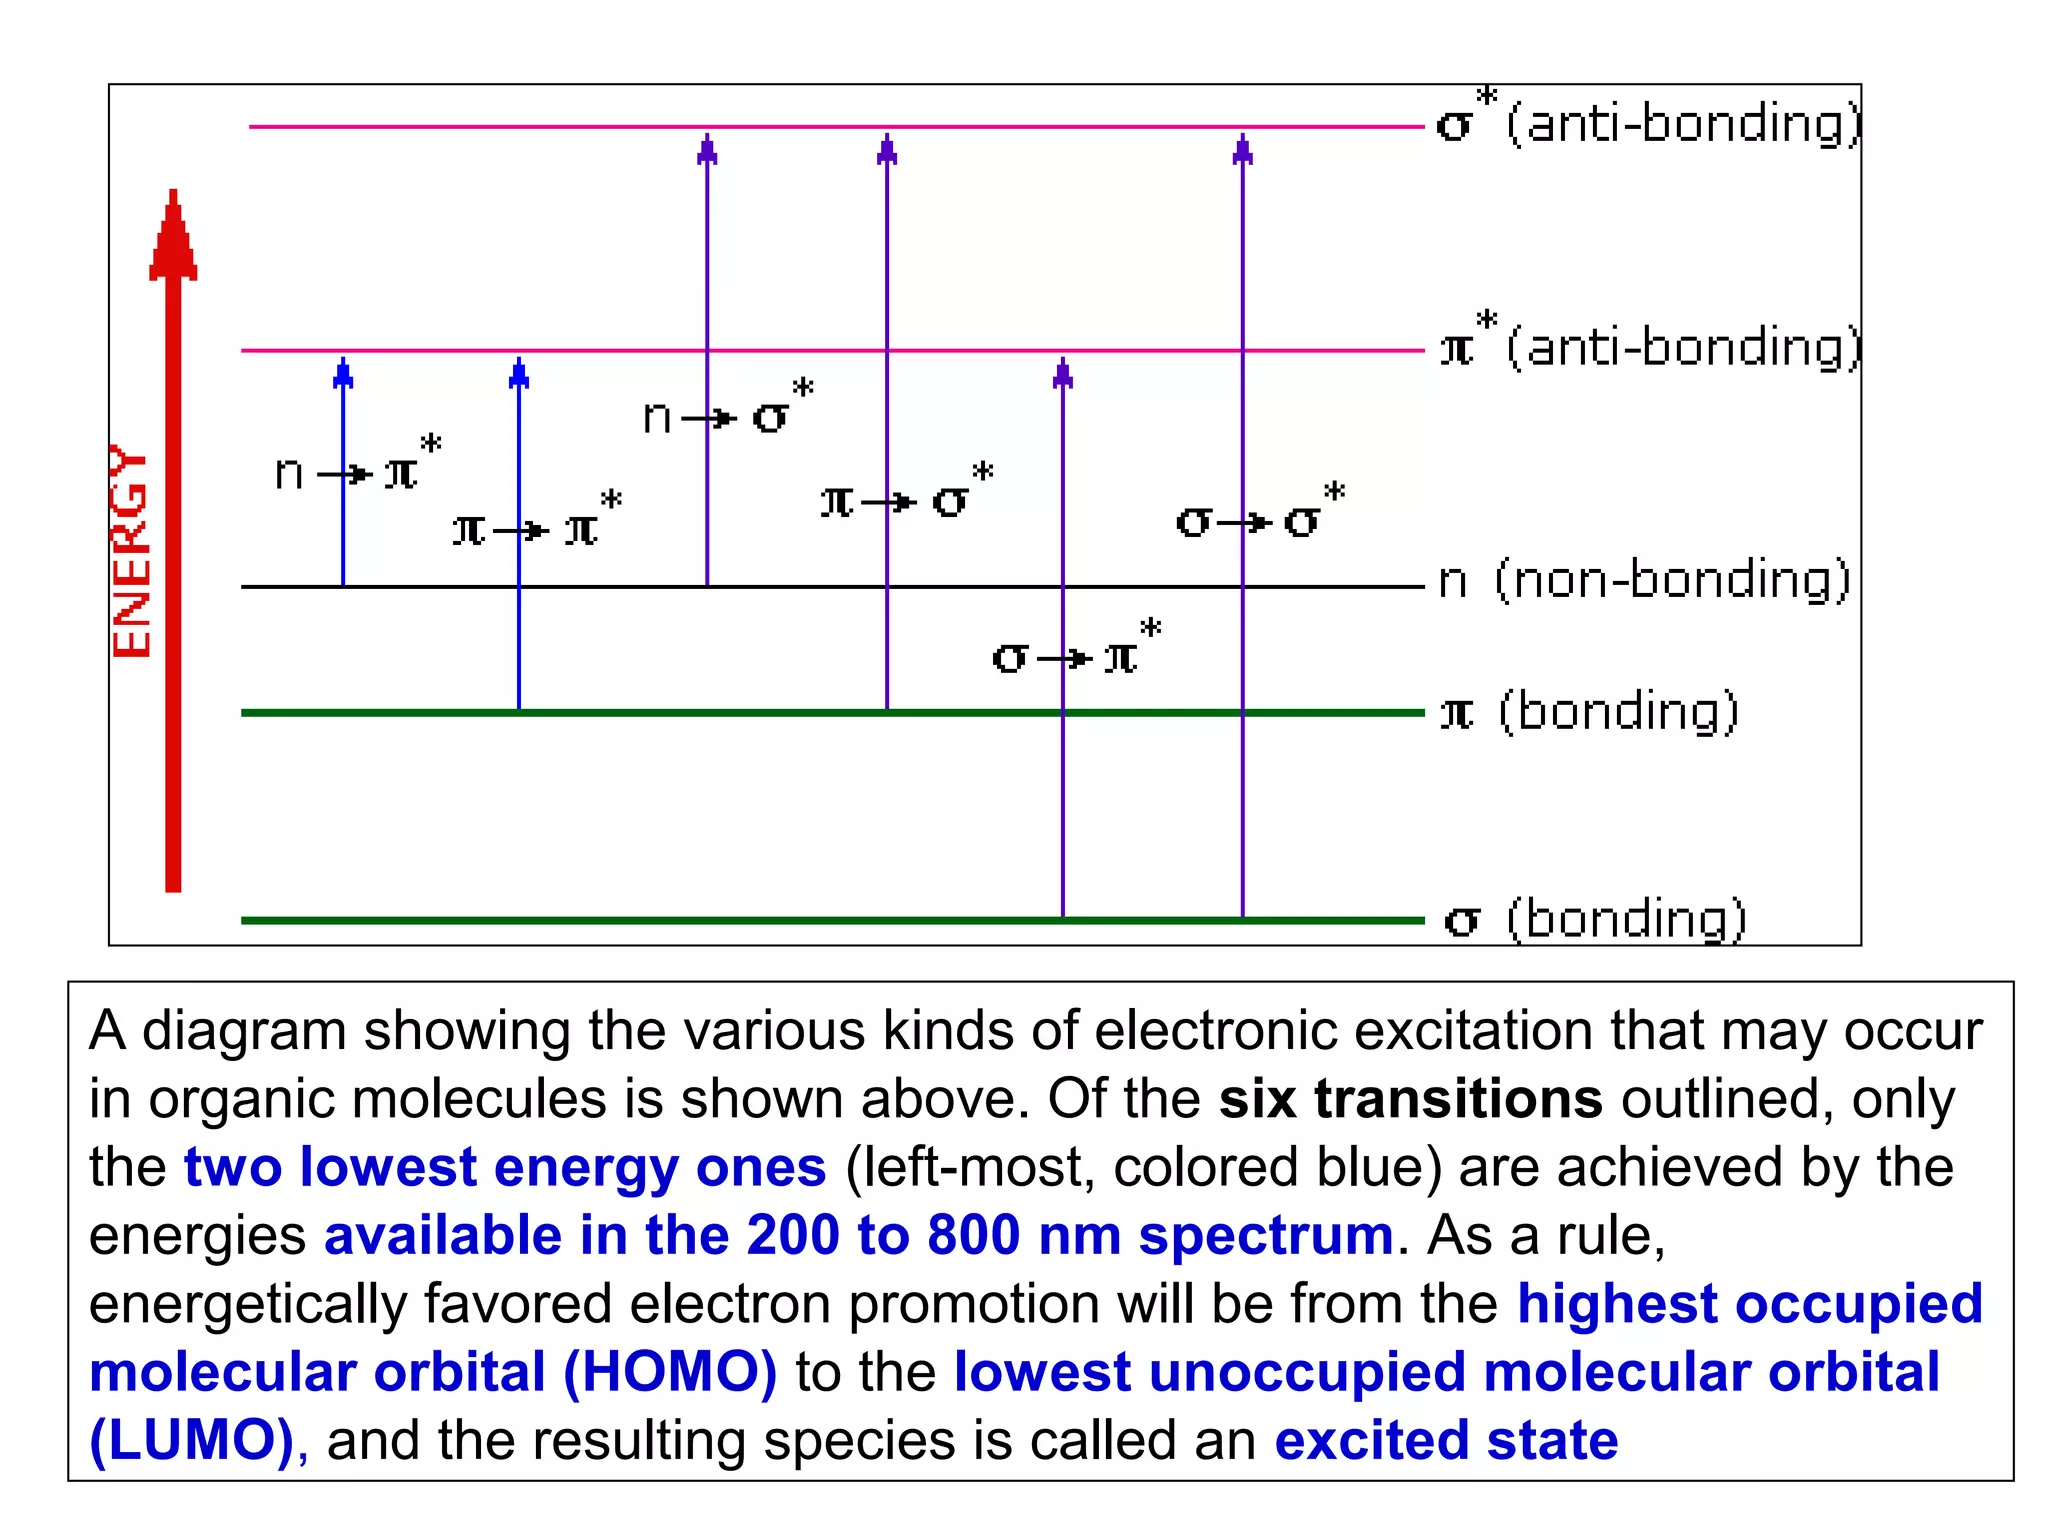
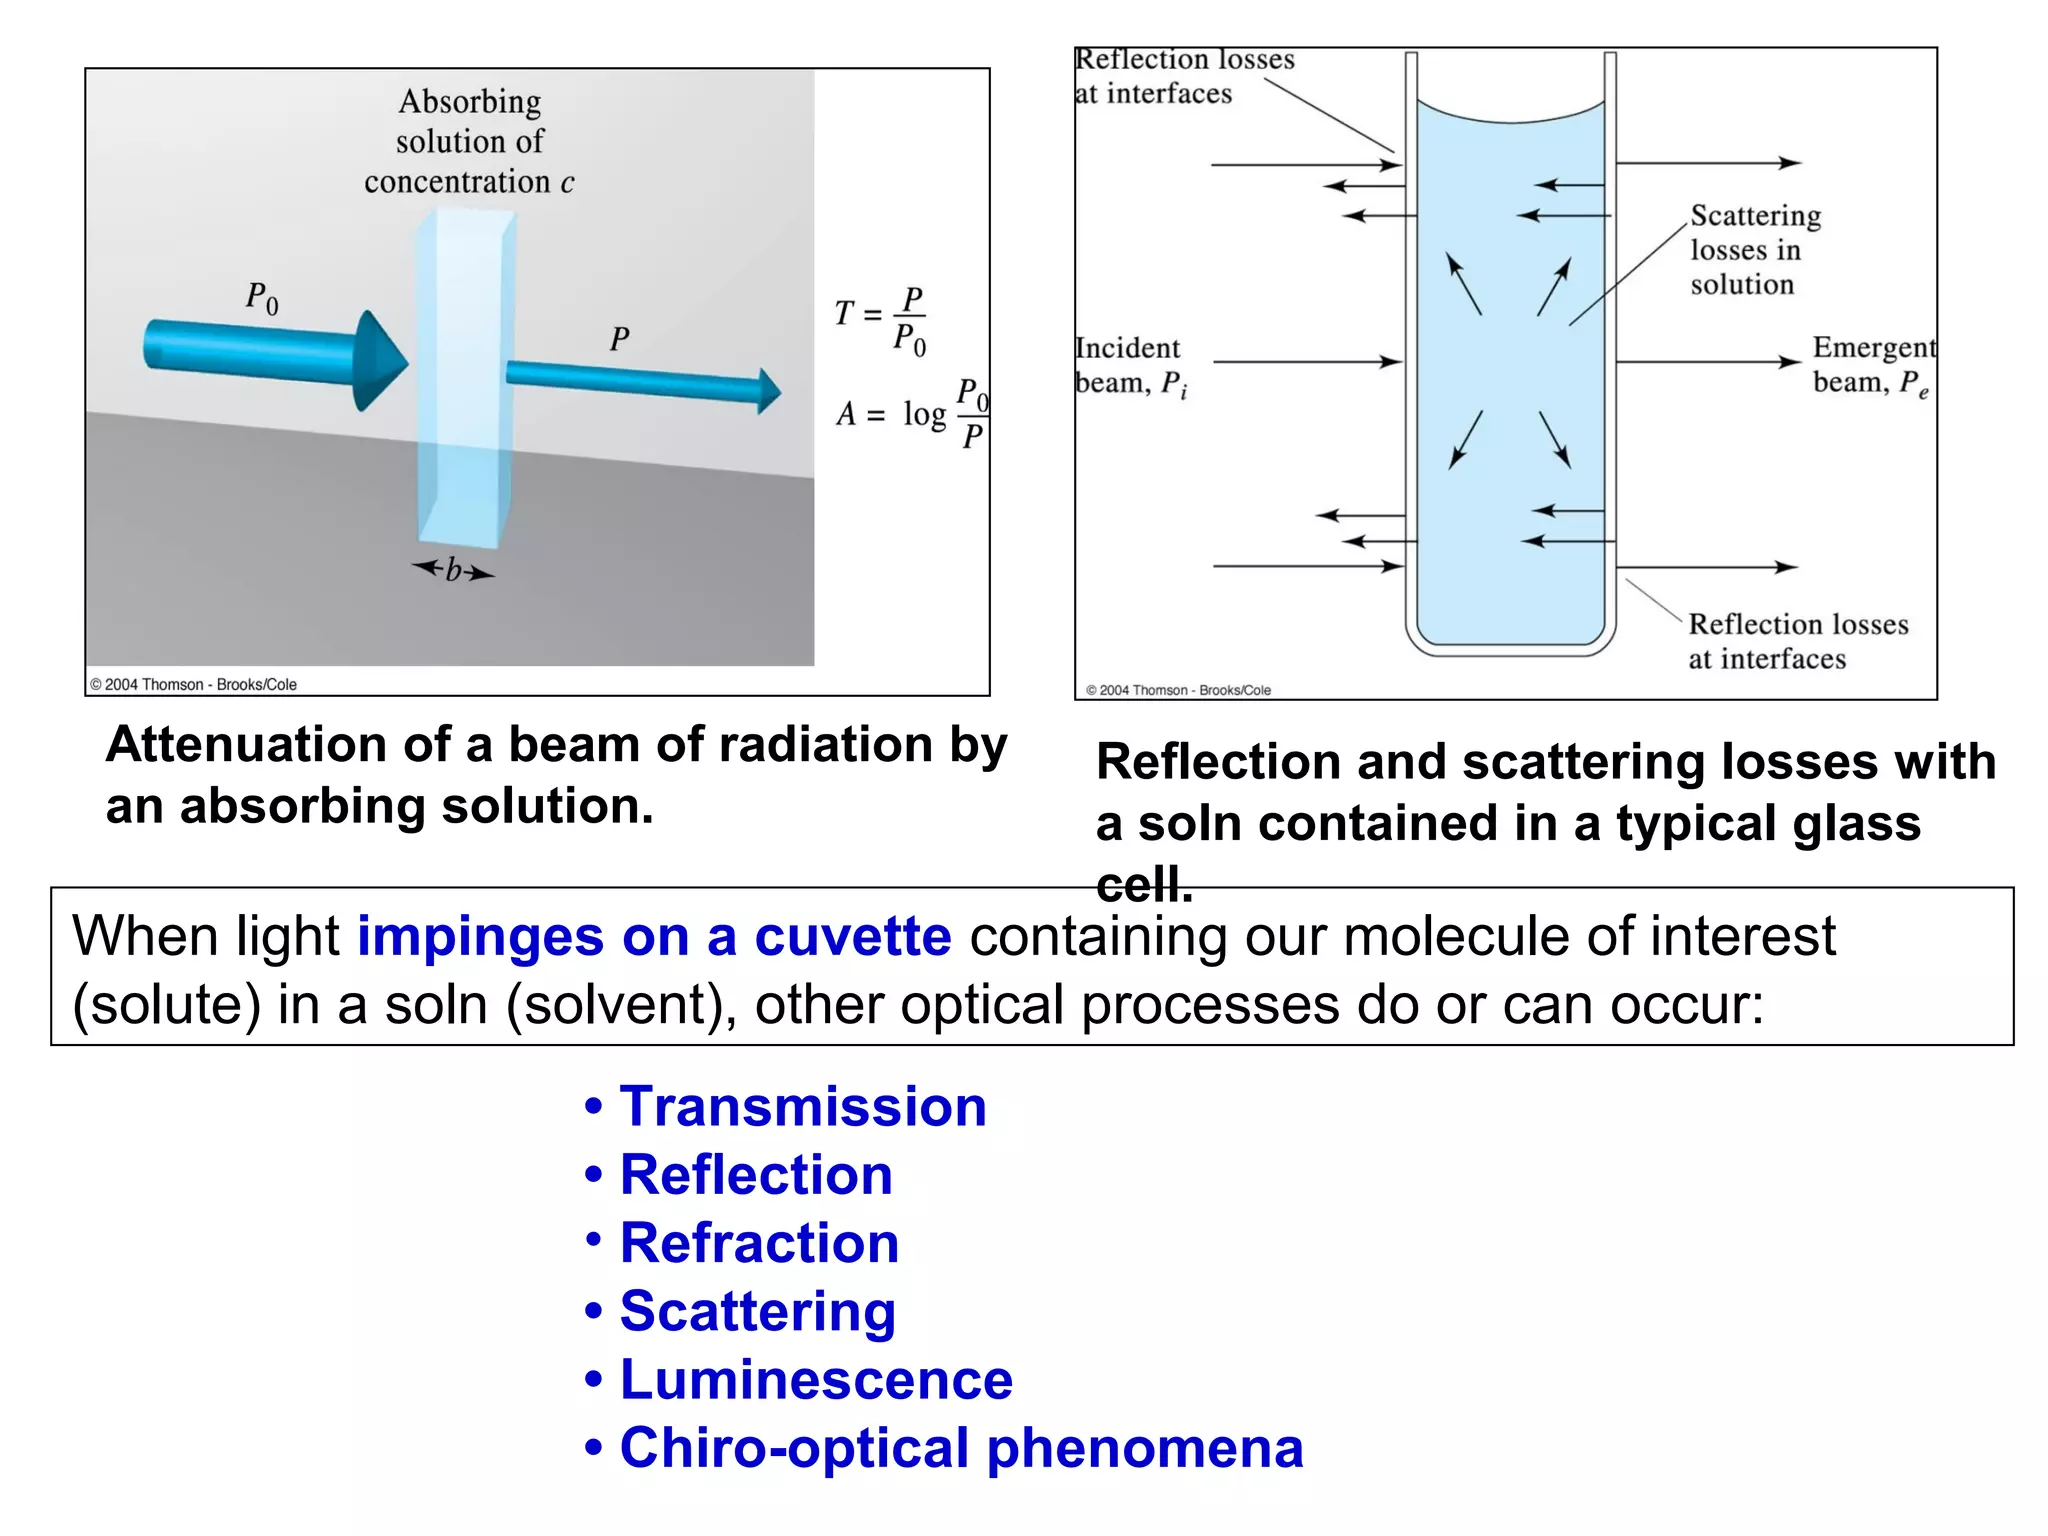
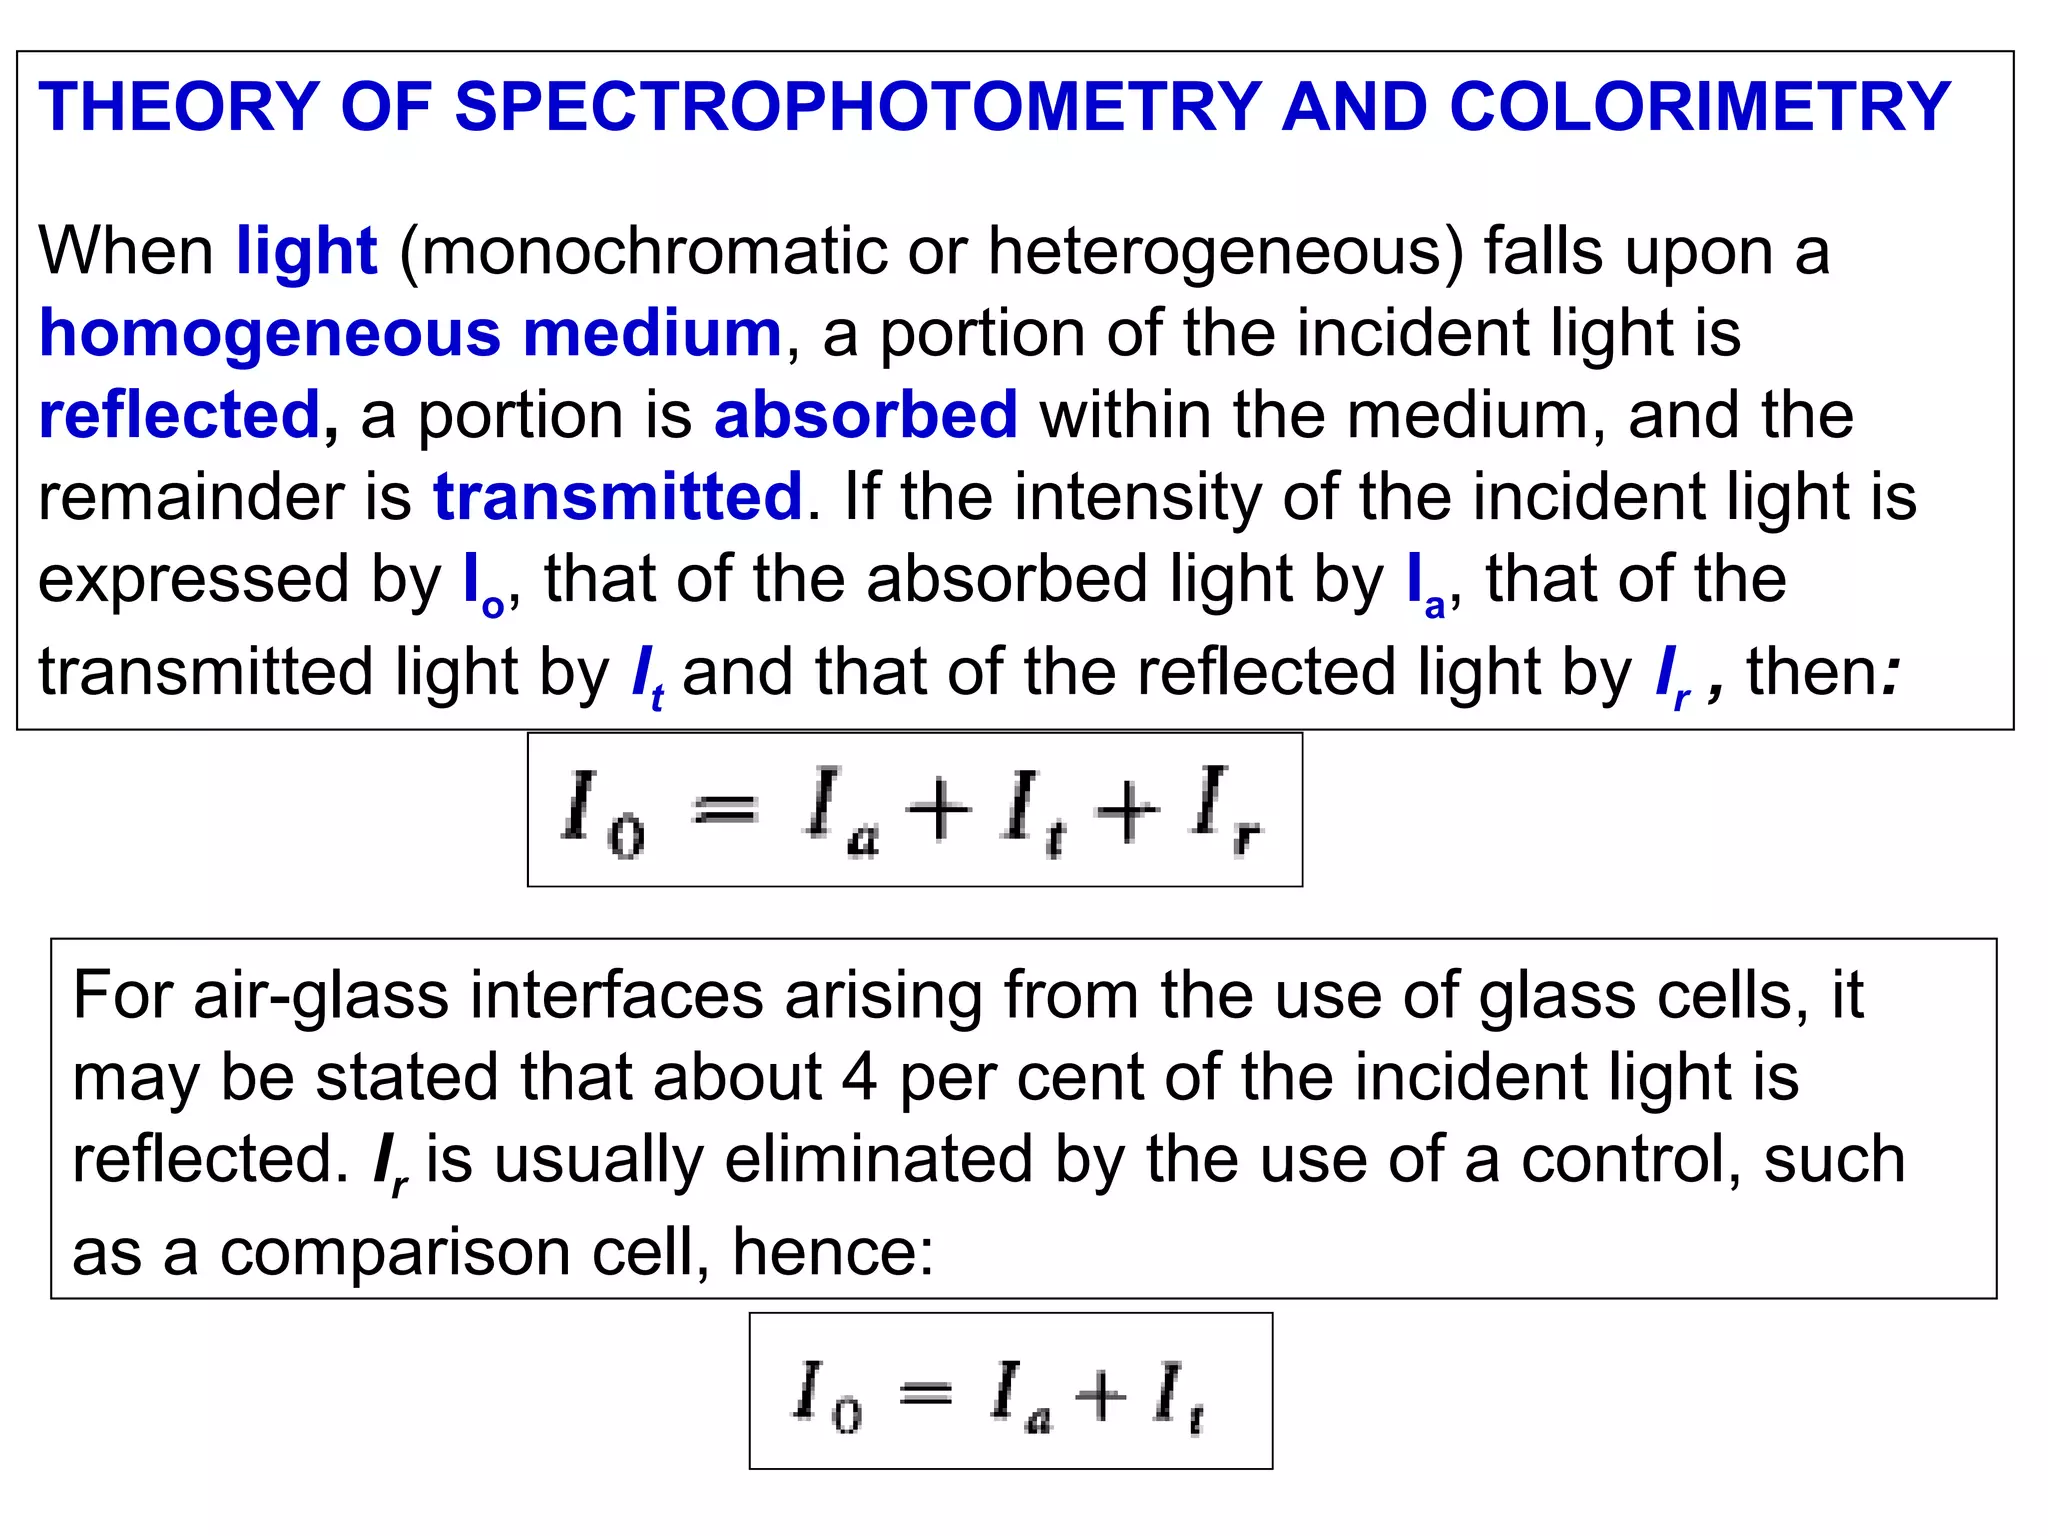
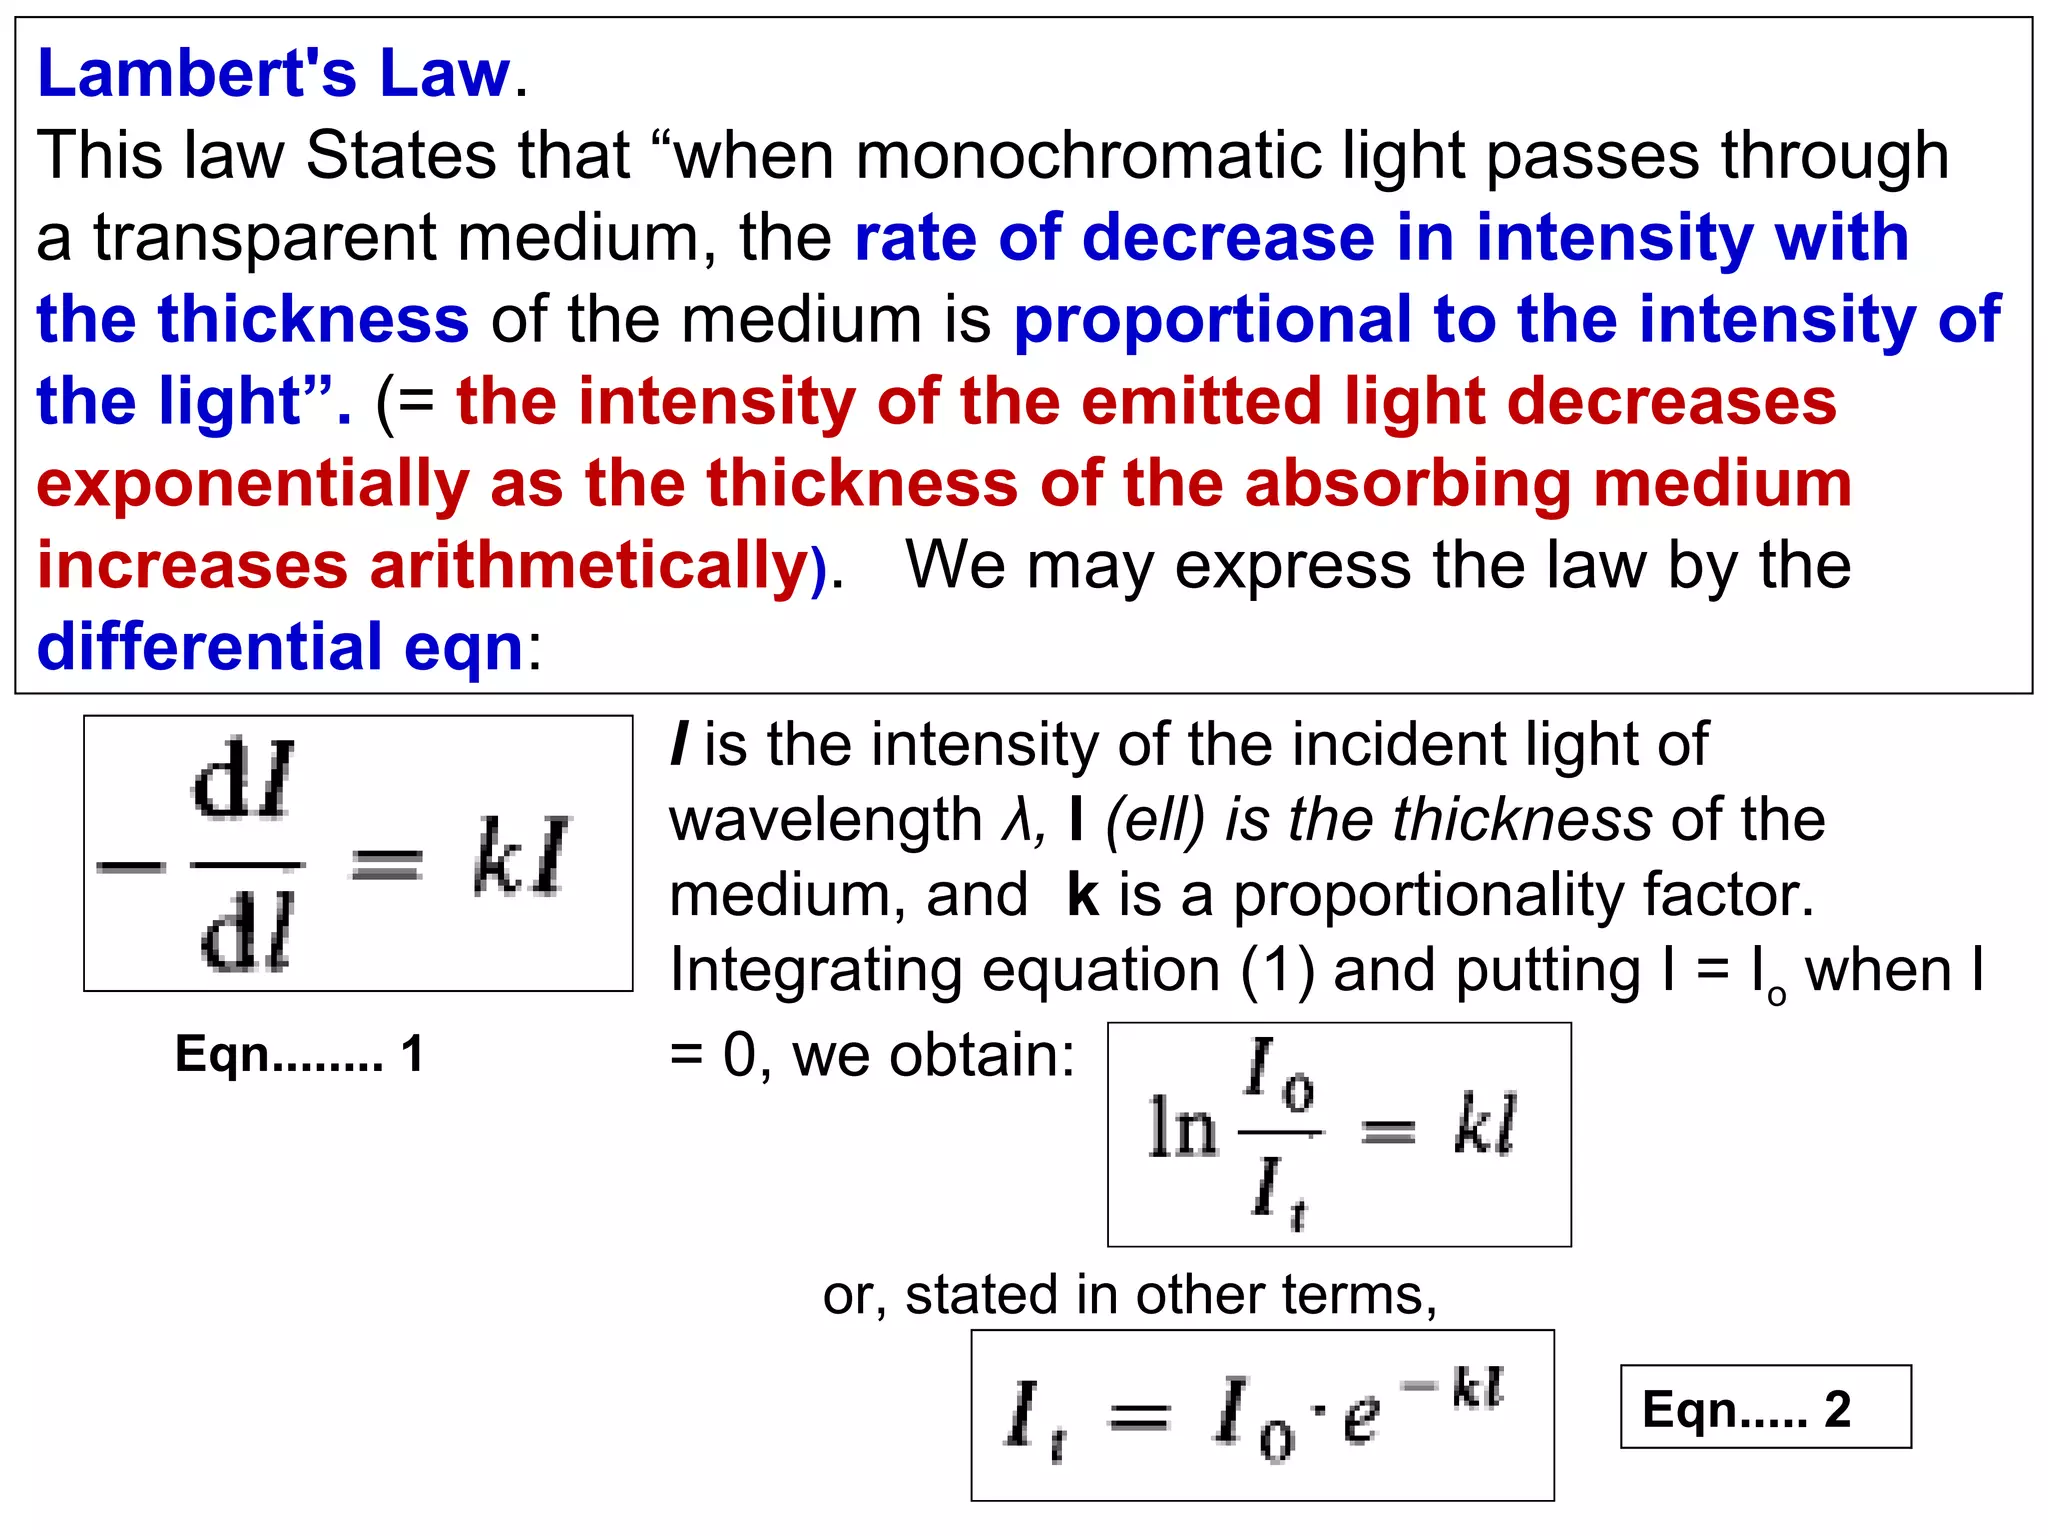
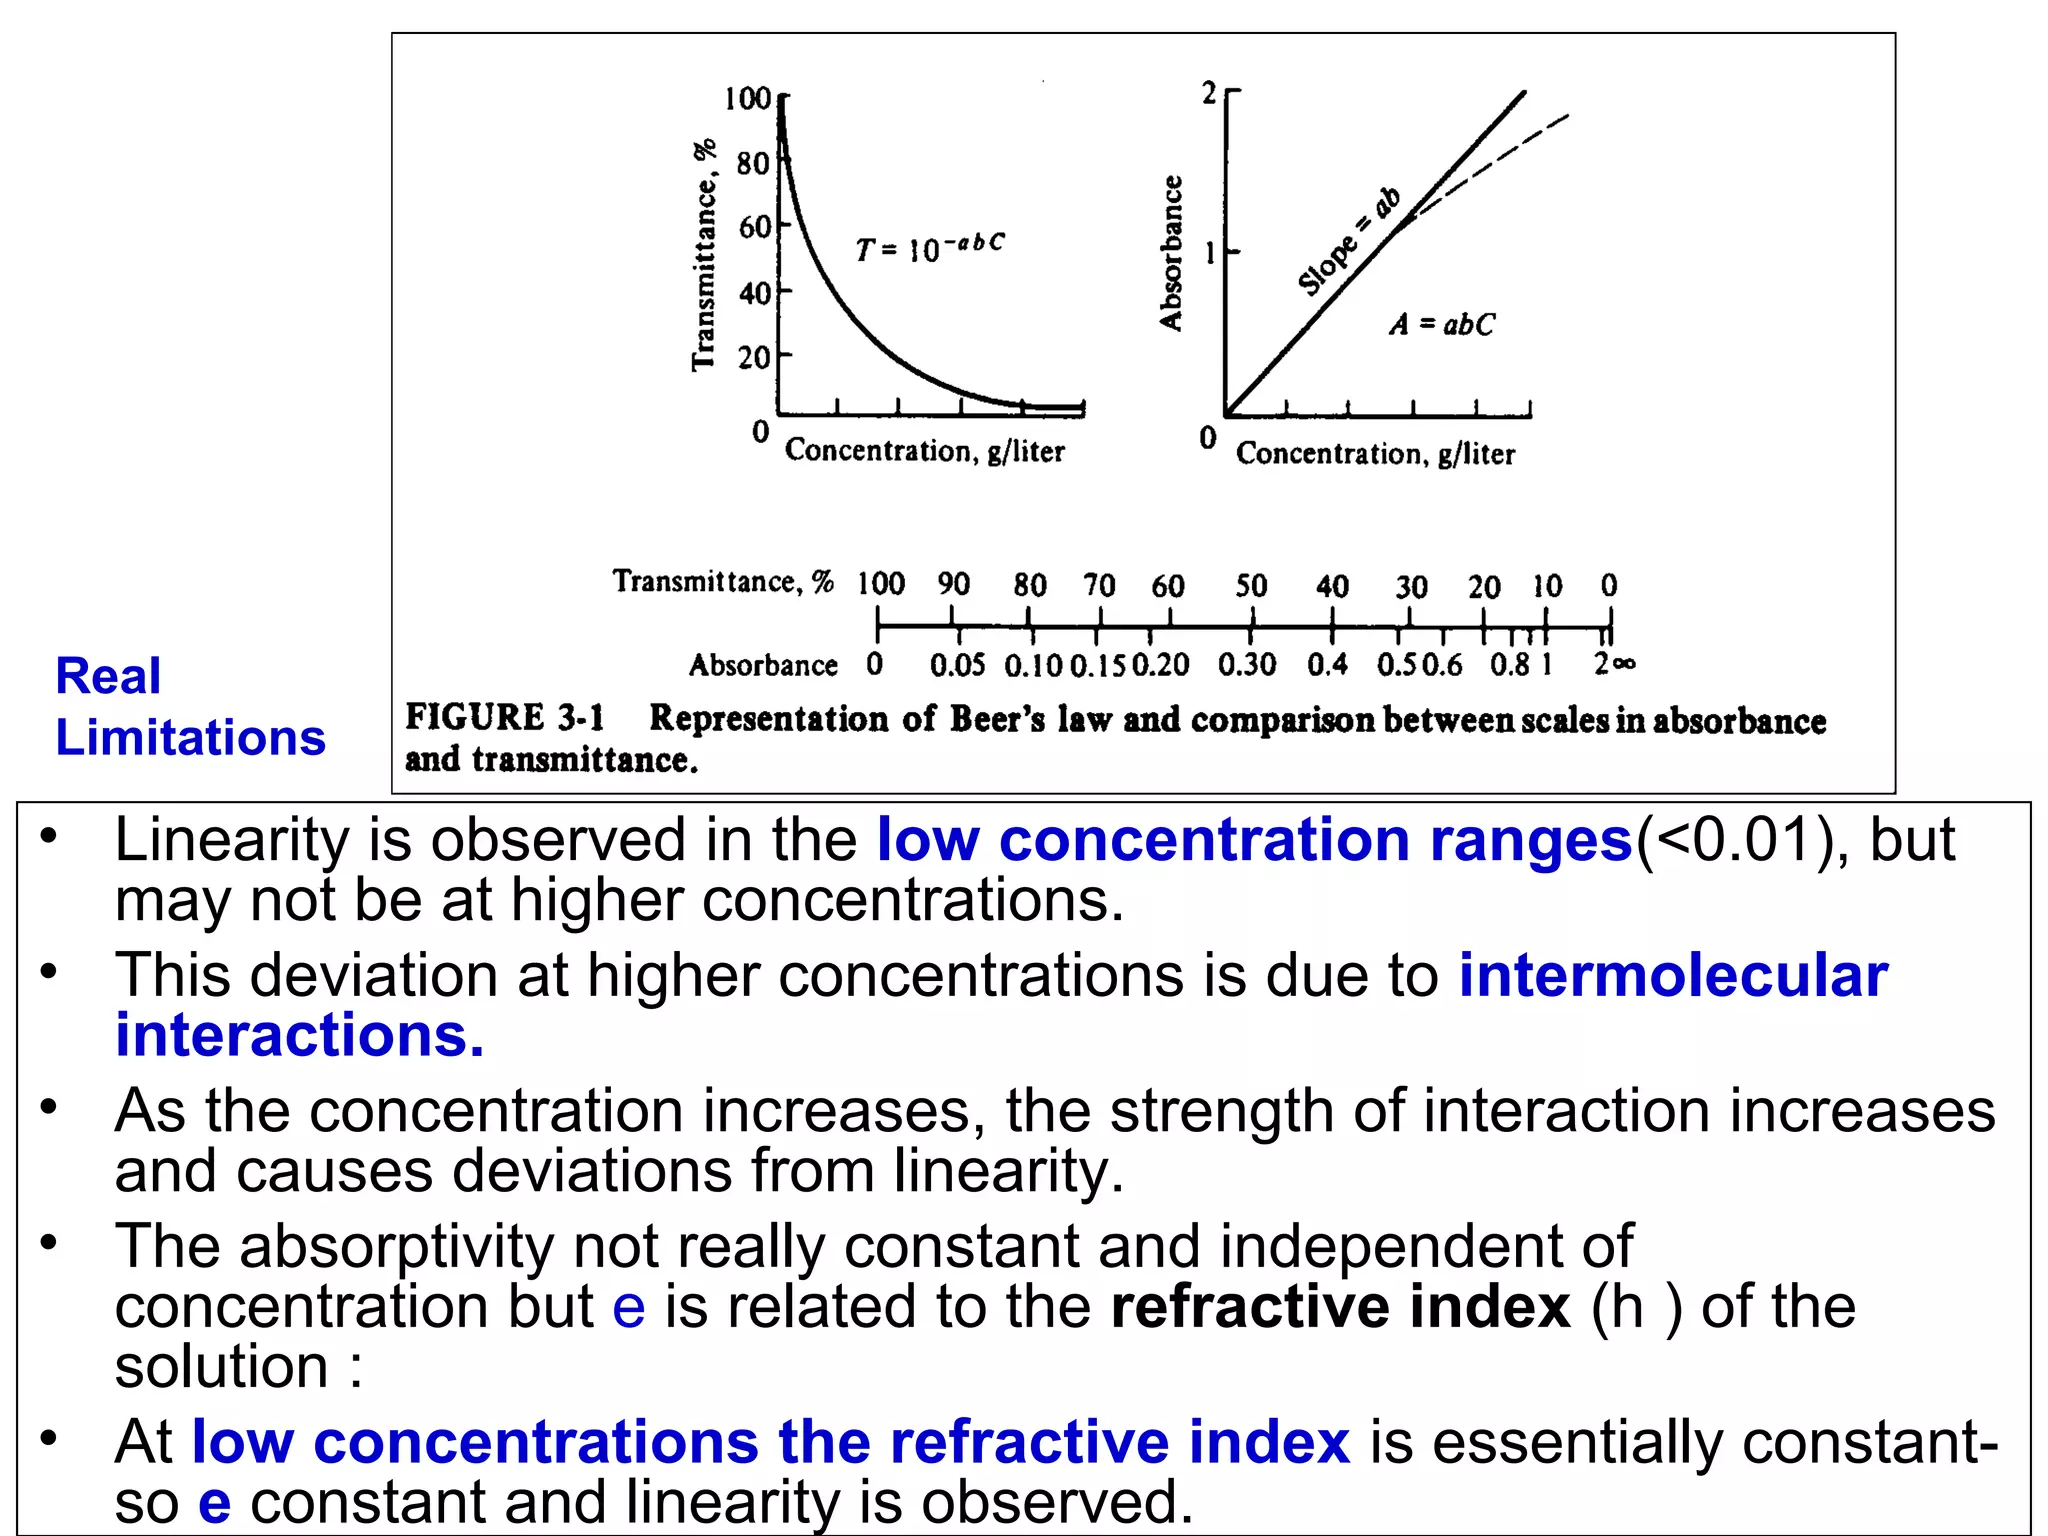
This document provides information about spectroscopy and spectrophotometry. It discusses the different regions of the electromagnetic spectrum that spectroscopy and colorimetry are concerned with, including the ultraviolet, visible, and infrared regions. It explains the relationship between the wavelength of light and photon energy. The document also summarizes Beer's law and how it relates absorbance to analyte concentration, molar absorptivity, and path length. Limitations to Beer's law at higher concentrations are discussed. The summary provides key equations for absorbance, transmittance, and determining unknown concentrations from calibration curves.


