Download to read offline

![Applying Sequential Pattern Mining to Time Series
Introduction to Business Intelligence – Archishman Bandyopadhyay & Gaurang Dhume , SIBM Pune (MBA 39 , Marketing A)
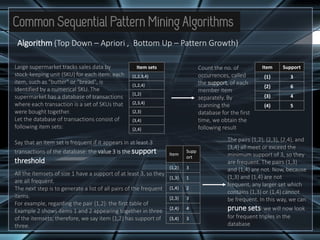
It is possible to convert time
series to sequences by
discretizing the time series
(transforming the numbers into
symbols).
Then techniques for analysing
sequences can also be applied to
analyse the time series - one of
the most popular algorithms for
the same being the SAX
algorithm (Symbolic Aggregate
approXimation)
Step 1 : PAA (piecewise
aggregate approximation)
Split the time series into 8
segments and replace each
segment by its average ,to
reduce the dimensionality
n = 11 (orgnl. data pts.)
w = 4 (no. of symbols)
v = 8 (PAA data pts.)
Step 2 : Each data point is
replaced by a symbol (to
represent various intervals of
values such that each is equally
probable under the normal
distribution)
Four symbols are created:
a = [-Infinity, 4.50]
b = [4.50, 6.2]
c = [6.2, 7.90]
d = [7.90,Infinity]
The result is a sequence of symbols: a, a, c, d, d, c, c, b
Step 3 : This sequence is the symbolic representation of the
time series.
Then, after a time series has been converted to a sequence, it is
possible to apply traditional pattern mining algorithms on the
time series](https://image.slidesharecdn.com/dataminingtimeseries3913668-170818123815/85/Analysis-of-Time-Series-Data-Pattern-Sequencing-6-320.jpg)

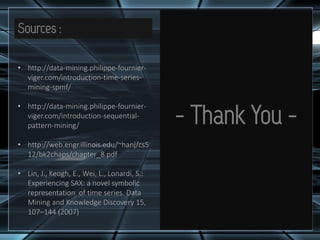

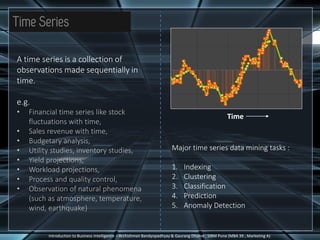
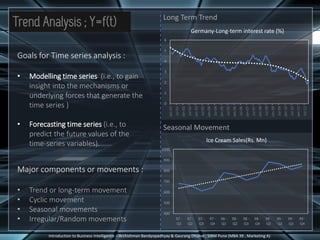
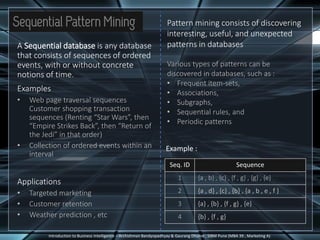
The document discusses different types of complex data that can be analyzed, including time series data, sequence data, and data streams. It describes key characteristics of data streams and how data stream management systems are used to perform data mining on continuous, rapidly changing data. The document also summarizes techniques for time series analysis, including decomposition of trends, cycles and seasonal patterns. It covers sequential pattern mining of ordered event sequences and provides an example of applying sequential pattern mining to discretized time series data. Finally, common sequential pattern mining algorithms like Apriori and PrefixSpan are introduced.