The document analyzes the impact of climate change on water resources in Pakistan. It examines increasing temperatures and shifting rainfall patterns that are contributing to more frequent and severe flooding in the country. The analysis focuses on three regions: along the Indus River, in northern and central Pakistan, and in southern Pakistan. It finds that while temperature and precipitation are normally distributed in the first two regions from 1960-2014, precipitation in southern Pakistan is not normally distributed, indicating climate change is altering rainfall. The study predicts heavier monsoon rains in southern Pakistan in the future based on observed trends.
The slides contain the situation of climate change impacts and risk in Pakistan. This presentation also provides a set of key possible climate change interventions for the Pakistan Red Crescent.
Climate change; its effects on pakistanShahid Khan
The climate system is a complex, interactive system consisting of the atmosphere, land surface, snow and ice, oceans and other bodies of water, and living things.
Pakistan and climate changes.
Impact of climate changes.
Elements for climate changes.
Social,political,economic causes of climate changes.
Solution and how to handle climate changes.
Climate Change Hazards in Pakistan. A presentation by Saima Abbasi. www.saima...Saimaabbasi12
I developed a power point presentation on Climate Change hazards in Pakistan with some basic concepts, hazards facing with its impacts and future suggestions. Also linked it with global thoughts and suggestions relevant to my country showing that what steps could be taking to minimize CC impacts. It can be accessed on www.saimaabbasi.net. Target audience is mass including students at school, university and general public ( Private and government offices). Presentation is made in response to final project Turn Down the Heat: Why a 4°C Warmer World Must be Avoided online course conducted by World Bank Group.
Irrigation system of Pakistan proved at top level of countries in the world but still it need deep concern regarding to control flood water. Due to heavy rainfall in September 2011, floods are come in left bank of drain and it has many impacts on the various cities and villages of sindh were observed, at least 360 people were killed, some 5.35 Million people and 1.2 Million homes affected as well 1.7 Million Acres of arable land inundated. Social life was fully disturbed as economy was destroyed due to damage of crop, people were also suffering from drinking water which was not purely provided and due to this dirty water many of the diseases were appeared like direa, malaria and tified. In this research we measure the losses during heavy rain fall 2011 in Nawabshah, Sh Benazeerabad regarding to impact on our social lives and then its precautions in future planning. Data was collected from social survey in premises of city, different departments including NGO’s and Governmental Departments and also solutions on immediate basis are discussed.
This MC word documents includes the current water disputes that exist in South Asia. The disputed country discussed are;
Pakistan-India
Bangladesh-India
Nepal-India
India-Bhuta
India-Sri-Lanka.
Floods in a changing climate: Understanding the role of crisis in policy changeKateWS
Presentation given by Dr Catherine Butler entitled ‘Floods in a changing climate: Understanding the role of crisis in policy change’. Given at the European Sociological Association Conference, Prague, 2015.
RIO or Engagement? Presentation at Social Media in a Corporate Context bu Jak...Communicate Magazine
A running constant theme in the comms vs marketing social media debate is the extent to which engagement can be measured for its return. Views are polarised.
From the outset Vodafone's policy has to be listen, learn and engage with its customers, proactively identifying and prioritising lead influencers. This session, a best practice case study, examines Vodafone's social media activity and explores how it drives brand preference, customer satisfaction and cost savings.
climatic impact on freshwater resources of pakistankiranaftab13
Due to increase in global warming, climate of the world is changing slowly and gradually. It is causing severe impact on freshwater resources and its related fauna and flora.
Combating Climate Change and Global Warming for a Sustainable Living in Harmony with Nature
Spatiotemporal Analysis of Land Use Land Cover Mapping and Change Detection in Dambatta Local Government Area
Considering Regional Connectivity and Policy Factors in the Simulation of Land Use Change in New Areas: A Case Study of Nansha New District, China
Application of Vegetation Indices for Detection and Monitoring Oil Spills in Ahoada West Local Government Area of Rivers State, Nigeria
Spatial Agglomeration and Diffusion of Population Based on a Regional Density Function Approach: A Case Study of Shandong Province in China
Similar to Analysis of climate change on floods in pakistan (20)
Seminar of U.V. Spectroscopy by SAMIR PANDASAMIR PANDA
Spectroscopy is a branch of science dealing the study of interaction of electromagnetic radiation with matter.
Ultraviolet-visible spectroscopy refers to absorption spectroscopy or reflect spectroscopy in the UV-VIS spectral region.
Ultraviolet-visible spectroscopy is an analytical method that can measure the amount of light received by the analyte.
Cancer cell metabolism: special Reference to Lactate PathwayAADYARAJPANDEY1
Normal Cell Metabolism:
Cellular respiration describes the series of steps that cells use to break down sugar and other chemicals to get the energy we need to function.
Energy is stored in the bonds of glucose and when glucose is broken down, much of that energy is released.
Cell utilize energy in the form of ATP.
The first step of respiration is called glycolysis. In a series of steps, glycolysis breaks glucose into two smaller molecules - a chemical called pyruvate. A small amount of ATP is formed during this process.
Most healthy cells continue the breakdown in a second process, called the Kreb's cycle. The Kreb's cycle allows cells to “burn” the pyruvates made in glycolysis to get more ATP.
The last step in the breakdown of glucose is called oxidative phosphorylation (Ox-Phos).
It takes place in specialized cell structures called mitochondria. This process produces a large amount of ATP. Importantly, cells need oxygen to complete oxidative phosphorylation.
If a cell completes only glycolysis, only 2 molecules of ATP are made per glucose. However, if the cell completes the entire respiration process (glycolysis - Kreb's - oxidative phosphorylation), about 36 molecules of ATP are created, giving it much more energy to use.
IN CANCER CELL:
Unlike healthy cells that "burn" the entire molecule of sugar to capture a large amount of energy as ATP, cancer cells are wasteful.
Cancer cells only partially break down sugar molecules. They overuse the first step of respiration, glycolysis. They frequently do not complete the second step, oxidative phosphorylation.
This results in only 2 molecules of ATP per each glucose molecule instead of the 36 or so ATPs healthy cells gain. As a result, cancer cells need to use a lot more sugar molecules to get enough energy to survive.
introduction to WARBERG PHENOMENA:
WARBURG EFFECT Usually, cancer cells are highly glycolytic (glucose addiction) and take up more glucose than do normal cells from outside.
Otto Heinrich Warburg (; 8 October 1883 – 1 August 1970) In 1931 was awarded the Nobel Prize in Physiology for his "discovery of the nature and mode of action of the respiratory enzyme.
WARNBURG EFFECT : cancer cells under aerobic (well-oxygenated) conditions to metabolize glucose to lactate (aerobic glycolysis) is known as the Warburg effect. Warburg made the observation that tumor slices consume glucose and secrete lactate at a higher rate than normal tissues.
(May 29th, 2024) Advancements in Intravital Microscopy- Insights for Preclini...Scintica Instrumentation
Intravital microscopy (IVM) is a powerful tool utilized to study cellular behavior over time and space in vivo. Much of our understanding of cell biology has been accomplished using various in vitro and ex vivo methods; however, these studies do not necessarily reflect the natural dynamics of biological processes. Unlike traditional cell culture or fixed tissue imaging, IVM allows for the ultra-fast high-resolution imaging of cellular processes over time and space and were studied in its natural environment. Real-time visualization of biological processes in the context of an intact organism helps maintain physiological relevance and provide insights into the progression of disease, response to treatments or developmental processes.
In this webinar we give an overview of advanced applications of the IVM system in preclinical research. IVIM technology is a provider of all-in-one intravital microscopy systems and solutions optimized for in vivo imaging of live animal models at sub-micron resolution. The system’s unique features and user-friendly software enables researchers to probe fast dynamic biological processes such as immune cell tracking, cell-cell interaction as well as vascularization and tumor metastasis with exceptional detail. This webinar will also give an overview of IVM being utilized in drug development, offering a view into the intricate interaction between drugs/nanoparticles and tissues in vivo and allows for the evaluation of therapeutic intervention in a variety of tissues and organs. This interdisciplinary collaboration continues to drive the advancements of novel therapeutic strategies.
Earliest Galaxies in the JADES Origins Field: Luminosity Function and Cosmic ...Sérgio Sacani
We characterize the earliest galaxy population in the JADES Origins Field (JOF), the deepest
imaging field observed with JWST. We make use of the ancillary Hubble optical images (5 filters
spanning 0.4−0.9µm) and novel JWST images with 14 filters spanning 0.8−5µm, including 7 mediumband filters, and reaching total exposure times of up to 46 hours per filter. We combine all our data
at > 2.3µm to construct an ultradeep image, reaching as deep as ≈ 31.4 AB mag in the stack and
30.3-31.0 AB mag (5σ, r = 0.1” circular aperture) in individual filters. We measure photometric
redshifts and use robust selection criteria to identify a sample of eight galaxy candidates at redshifts
z = 11.5 − 15. These objects show compact half-light radii of R1/2 ∼ 50 − 200pc, stellar masses of
M⋆ ∼ 107−108M⊙, and star-formation rates of SFR ∼ 0.1−1 M⊙ yr−1
. Our search finds no candidates
at 15 < z < 20, placing upper limits at these redshifts. We develop a forward modeling approach to
infer the properties of the evolving luminosity function without binning in redshift or luminosity that
marginalizes over the photometric redshift uncertainty of our candidate galaxies and incorporates the
impact of non-detections. We find a z = 12 luminosity function in good agreement with prior results,
and that the luminosity function normalization and UV luminosity density decline by a factor of ∼ 2.5
from z = 12 to z = 14. We discuss the possible implications of our results in the context of theoretical
models for evolution of the dark matter halo mass function.
Observation of Io’s Resurfacing via Plume Deposition Using Ground-based Adapt...Sérgio Sacani
Since volcanic activity was first discovered on Io from Voyager images in 1979, changes
on Io’s surface have been monitored from both spacecraft and ground-based telescopes.
Here, we present the highest spatial resolution images of Io ever obtained from a groundbased telescope. These images, acquired by the SHARK-VIS instrument on the Large
Binocular Telescope, show evidence of a major resurfacing event on Io’s trailing hemisphere. When compared to the most recent spacecraft images, the SHARK-VIS images
show that a plume deposit from a powerful eruption at Pillan Patera has covered part
of the long-lived Pele plume deposit. Although this type of resurfacing event may be common on Io, few have been detected due to the rarity of spacecraft visits and the previously low spatial resolution available from Earth-based telescopes. The SHARK-VIS instrument ushers in a new era of high resolution imaging of Io’s surface using adaptive
optics at visible wavelengths.
Observation of Io’s Resurfacing via Plume Deposition Using Ground-based Adapt...
Analysis of climate change on floods in pakistan
1. ANALYSIS OF
CLIMATE CHANGE ON
WATER RESOURCES
OF PAKISTAN
Graduate School of Water Resources
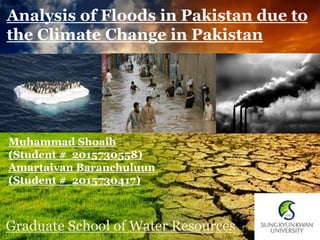
Analysis of Floods in Pakistan due to
the Climate Change in Pakistan
Graduate School of Water Resources
Muhammad Shoaib
(Student # 2015730558)
Amartaivan Baranchuluun
(Student # 2015730417)
3. And Then Something Started Changing forever
(Edwin L. Drake)
Up until 1859, oil had been gathered by
collecting whatever had seeped through
to the surface — known drilling methods
were deemed too dangerous.
On August 28, 1859, George
Bissell and Edwin L. Drake made
the first successful use of a drilling
rig on a well drilled especially to
produce oil, at a site on Oil Creek
near Titusville, Pennsylvania.
(www.businessinsider.com)
(Collecting oil from Water Surface)
The successful Oil exploration
method discovery brought a
revolution in the world. The vision
of the world changed. The polices
were changed. Thousands of oil well
drilling started world wide. People
started calling it as a
“BLACK GOLD”.
4. Why Petroleum is so important…?????
1 barrel oil = 158.98 liters
Energy contains in one barrel oil =
6.1 Gigajoules (5.8 million BTUs)
6.1 Gigajoules (5.8 million BTUs) =
25,000 hours of human labor
1 barrel oil will approximately move
this truck for 800 KMs.
If there were no oil, it would take
25 people to push it every day for
8 hours non stop for 125 days
to move it 800 KM.
A simple example ……
5. But……………..
Nothing is free; when you gain something you have
to loss to some ;Universal Fact
Alkanes Complete combustion of Alkanes
6. Energy arrives from the sun in the form of
visible light and ultraviolet radiation.
"
According to an ongoing temperature analysis conducted by scientists at
NASA’s Goddard Institute for Space Studies (GISS)…the average global
temperature on Earth has increased by about 0.8°Celsius
(1.4°Fahrenheit) .
7. Impact of Climate Change
Glaciers and snow cover have decreased in
regions both in the Northern and Southern
hemispheres, which has contributed to the rise
of sea levels
Average Arctic temperatures increased by nearly
twice the global average rate over the last 100
years (the IPCC also noted that Arctic
temperatures have are highly variable from
decade to decade).
The area covered by frozen ground in the Arctic
has decreased by approximately 7 percent since
1900, with seasonal decreases of up to 15
percent.
Precipitation has increased in eastern regions of
the Americas, northern Europe and parts of
Asia; other regions such as the Mediterranean
and southern Africa have experienced drying
trends
Droughts are more intense, have lasted longer
and covered larger areas than in the past.
Courtesy IPC Secretariats/ World
Meteorological Organization
(Photo Courtesy., Gary Braasch)
(Photo Courtesy ., Yousaf Nazar Staff of Pakistan)
8. As average temperatures in regions across the
country have gone up, more rain has fallen during
the heaviest downpours.
This happens because warmer air holds more
moisture. This fact is apparent when you see water
vapor hanging in the air after turning off a hot
shower. When warm air holding moisture meets
cooler air, the moisture condenses into tiny droplets
that float in the air. If the drops get bigger and
become heavy enough, they fall as precipitation.
If the emissions that cause global warming continue
unabated, scientists expect the amount of rainfall
during the heaviest precipitation events across
country to increase more than 40 percent by the end
of the century.
Courtesy .,Union of Concerned
Scientists (www.uscusa.org)
How Climate Change contribute in Floods………?
10. In 2003, Sindh province was badly affected when
above normal monsoon rainfall caused flooding in the
province. At least 484 people died and some 4,476
villages in the province were affected.
In 2007, Khyber-Pakhtunkhwa, Sindh and
coastal Baluchistan were badly affected due to
monsoon rainfall. At least 130 people died and 2,000
were displaced.
In 2010, almost all of Pakistan was affected
when massive flooding caused by record breaking
rains hit Khyber and Punjab. At least 2,000 people
died in this flood and almost 20 million people were
affected by it.
In September 2011, at least 361 people were killed,
some 5.3 million people and 1.2 million homes
affected as well 1.7 million acres of arable land
inundated when massive floods swept across the
province of Sindh as a result of monsoon rains.
In September 2012, more than 100 people died, and
thousands of homes destroyed, with thousands of
acres of arable land affected when intense rainfall
battered Khyber Pukhtunkhwa, Southern Punjab and
Upper Sindh. As a result of monsoon rains.
In September 2014 Due to massive rain in Jammu and
Kashmir as well as Azad Jammu and Kashmir and in
Punjab [9] Constituted flood situation in River
Chanab and River Jhelum.
Major Floods in Pakistan
12. Pakistan's monsoon rains normally emanate from
moisture swept in over India from the Bay of Bengal. In
typical years, the rains open up in the east, centered on
Punjab province, roughly near the cities of Lahore and
Faisalabad. Experts say the rains then migrate
northwest, dissipating by the time they reach the capital,
Islamabad, and ending in scattered rains before dying
out in Afghanistan.
But for the past few decades, PMD officials have noticed
that the center of Pakistan's monsoon has been gradually
shifting to the northwest, away from the nation's
watershed in Punjab.
The dominant component of the climate variations was
spatial shifts in the rainfall patterns, associated with
fluctuations in the general circulation of the atmosphere
in the region (Rodo, 2003).
"Over the past 25 to 30 years, there is a latitudinal
redistribution," Khan explained. "Previously, in the past,
our flooding was in these river systems [in Punjab], but
... the rainfall has shifted. Its main focus has changed
from the eastern parts to the western parts.“
Courtesy Publishing, LLC. www.eenews.ne
Theories behind
the flooding in
Pakistan.
13. Necessity
One of the very important necessities of research into climate change is to analyze
and detect historical changes in the climatic system (Houghton et al., 1996).
Rainfall is a principal element of the hydrological cycle, hence understanding
its behavior may be of profound social and economic significance. Detection
of trends and oscillations in the rainfall time series yields important information
for understanding the climate.
Proposal
Keeping in view the present flooding in Pakistan, it is important to analyze the main
reason behind the flooding in Pakistan.
In our project we will work on two aspects.
1. Either it is increase in precipitation or glacial snow melt that contribute major
factor in flooding of Pakistan.
2. Analysis of Monsoon Shift.
14. The Climatic Research Unit (CRU) is a component of
the University of East Anglia and is one of the leading
institutions concerned with the study of natural
and anthropogenic climate change.
Activities
At the time of its establishment the CRU set out four key
aims, which still remain valid:
To establish firmer knowledge of the history of climate in
the recent and distant past.
To monitor and report on current climatic developments on
a global scale.
To identify the processes (natural and man-made) at work
in climatic fluctuations and the characteristic timescales of
their evolution.
To investigate the possibilities of making advisory
statements about future trends of weather and climate from
a season to many years ahead, based on acceptable
scientific methods and in a form likely to be useful for long-
term planning purposes.
(http://www.cru.uea.ac.uk/)
1. Data Collection
Monthly rainfall data of Pakistan will be collected from the Global Gridded
Climatology of Climatic Research Unit Time Series (CRU TS 3.23) presented
at a new high resolution and made available by the Climate Impacts LINK
project, Climate Research Unit, University of East Anglia, Norwich, UK.
15.
16.
17.
18. 2.Data Analysis
1. Descriptive statistics of annual rainfall.
2. Normality tests will be used to determine whether a dataset can be described
by a normal distribution or not, or to compute how likely an underlying
random variable is to be normally distributed.
3. Analysis of precipitation shift during monsoon.
3.Result and Conclusion
References
Hydrology Time Series Analysis: Theory and Practice
By Deepash Machiwal
Madam Kumar Jha
Water Resources and
Climate Change
Kenneth Frederick
GLOBAL CLIMATIC CHANGE AND PAKISTAN’S
WATER-RESOURCES
Imtiaz Ahmed*
Ashrit, R.G., Kumar, R. and Kumar, K.K. (2001). ENSO-monsoon relationship in
greenhouse warming scenario. Geophysical Research Letters, 28: 1727-1730.
Beniston, M. and Stephenson, D.B. (2004). Extreme climatic events and their evolution
under changing climatic conditions. Global and Planetary Change, 44: 1-9.
19. The trans boundary Indus river basin has a
total area of 1.12 million km2distributed
between Pakistan (47 percent), India (39
percent), China (8 percent) and Afghanistan
(6 percent) .
The Indus river basin stretches from the
Himalayan mountains in the north to the
dry alluvial plains of Sindh province in
Pakistan in the south and finally flows out
into the Arabian Sea.
Annual precipitation ranges between 100
and 500 mm in the lowlands to a maximum
of 2 000 mm on mountain slopes. Snowfall
at higher altitudes (above 2 500 m)
accounts for most of the river runoff (Ojeh,
2006)
(Indus River in Blue Line)
Indus River…
28. WHY KARAKORAM GLACIERS ARE NOT
MELTING?
The high mountains of Asia,
including the Karakoram,
Himalayas and Tibetan Plateau,
combine to form a region of
perplexing hydro climate
changes. Glaciers have
exhibited mass stability or even
expansion in the Karakoram
region, contrasting with glacial
mass loss across the nearby
Himalayas and Tibetan Plateau,
a pattern that has been termed
the Karakoram anomaly.
Karakoram is a large mountain
range spanning the borders
between Pakistan, India and Ch
ina, located in the regions
of Gilgit–
Baltistan (Pakistan), Ladakh (In
dia), and
30. GFLDL – CM2.5 MODEL
Simulated snowfall show uniform significant annual
snowfall reductions across the region over the historical
record and future climate.
As a result, they can find changes in the mean climate,
but it is difficult to assess the significance of their
findings and signal emergence without continuous data.
Here we approach this problem using a combination of
observations and a unique multi-ensemble experiment
using a 50-km-resolution GCM to explore the region’s
seasonal cycle and climate change signals across space
and time to identify the potential meteorological
constraints on the hydro climate of high-mountain Asia.
31. a, CM2.5 elevation with three regions
of interest defined by grid cells in each
box above 2,500 m a.s.l. (non-
greyscale): northwest Himalaya and
Karakoram; central Himalaya;
southeast Himalaya and Tibetan
Plateau.
b, Mean CM2.5 annual snowfall.
c–n, Regional seasonal cycles: CM2.5
ensemble-averaged mean, CMIP5
mean and 1 standard deviation range
(1966–2005).
f–h, APHRODITE and TRMM (1998–
2007) total precipitation.
c,f, Pakistan station data (1960–
2007)
32. The team notes that their
model shows that the total
amount of precipitation along
most of the chain is increasing as
the planet heats up, during the
summer months. In the
Karakoram, on the other hand,
there is less snowfall in the
summer, but more in the winter—
thus the continued growing of the
glaciers. Their model suggests that
the glaciers are likely to continue
to persist in that part of the world,
right on up to 2100—after that, it
doesn't appear likely—not if global
warming continues at its current.
33. Analysis of Floods in Pakistan due to the Climate Change
in Pakistan
• Proposal
• Data Collection & Study
• Methodology
• Conclusion
Muhammad Shoaib
(Student # 2015730558)
Amartaivan Baranchuluun
(Student # 2015730417)
Graduate School of Water Resources
34. Methodology
As the Indus River flows starts from China and through Northern Pakistan it flows
through whole Pakistan and then through Southern Pakistan it flows in Arabian Sea.
(We started our observation from this point)
(Blue Line in the picture is Indus River)
First we study the temperature of this region from
1960-2014.
Then we study the precipitation of this region from
1960-2014.
Assumptions:
• In case of Temperature, the Mean Temperature
of the year considered & the chosen point was
50 square Kilometer. However, the area around
the region shows almost the same pattern,
graphically.
• In case of Precipitation, the Mean Precipitation
of the Monsoon Season considered.
35. Temperature
Location: Centre Latitude: 31.25 Centre Longitude: 81.75 Data: CRU TS Version: 3.23 Units: degrees C
Normality Tests
The following Numerical and Visual outputs must be investigated:
1. ------Skewness & Kutosis z-values must be in the span of somewhere between -1.96 to +1.96
To find the z-value we divide the measure by its Std. Error
In our case z-value of Skewness is = -.280/.322 = -0.86
In our case z-value of Kurtosis is = -.807/.634 = -1.27
36. 2.The Shapiro- Wilk Test P value must be above 0.05
3. Histograms, Normal Q-Q plots and Box Plot should visually indicate that our data is normal
In our case .139 > 0.05
Conclusion:
The temperature in this region and its surrounding
is approximately normally distributed over the last
44 years.
37. Precipitation
(Then we study the precipitation in this region
from (1960-2014))
Location:
Centre Latitude: 31.75
Centre Longitude: 80.25
Skewness z-value = .309/.322 = 0.95
Kutosis z-value = -.867/.634 = 1.367
39. Study Area 2
(Then we moved inside Pakistan and study the
behavior of this area)
Location: Centre Latitude: 33.25
Centre Longitude: 72.75
1.Precipitation
Skewness z-value = 1.145/.322 = 3.55
Kurtosis z-value = 1.693/.634 = 2.67
40. Shakiro-Wilk P value is also less than 0.05
Conclusion:
The mean Monsoon precipitation is not normally distributed in this region from 1960-2014
41. Y = 1.252(2025)-2269.1 = 266.2 mm/month
Y = 1.252(2050)-2269.1 = 297.5 mm/month
Y = 1.252(2100)-2269.1 = 360.1 mm/month
42. Study Area 3
(Then we study southern Pakistan )
Location: Centre Latitude: 27.75
Centre Longitude: 68.75
1.Precipitation
Skewness z-value = 1.701/.322 = 5.82
Kurtosis z-value = 2.910/.634 = 4.58
43. The Shapiro-Wilk P value is less than 0.05 , its .000
Conclusion:
The mean monsoon precipitation is
not normally distributed in this region.
Furthermore many outliers observed.
45. Causes of increased precipitation in Monsoon Season
The flooding event is one apparently due to intensification of the water cycle –
a common pattern seen in climate modeling as global temperatures increase –
causing an increase in atmospheric humidity and precipitation.
46. Deforestation is the removal of a forest or
stand of trees where the land is there
after converted to a non forest use.
Pakistan is known to have one of the
highest rates of deforestation in the
world.
Only 5% of Pakistan is now occupied by
forest due to excessive timber
harvesting.
Due to the lack of vegetation to intercept
the precipitation, flooding occurred
Deforestation
47. Conclusion
1. There is an insignificant change in the temperature and the precipitation in
North-East of Pakistan from (1960-2014) from where the Indus river starts.
Furthermore, the research conducted by (Mendeleyev ,..2014) shows the
Karakoram glaciers are not melting. Therefore we can assume that melting of
glacier didn’t contribute in Pakistan floods.
2.The study shows that in North of Pakistan the precipitation in Monsoon
season have increased over the span of last 44 year’s and the graphs
suggest that it will increase significantly by the end of this century. And the
increased precipitation in this and its surrounding have contributed mostly in
Pakistan floods. However the change of temperature in this region is
insignificant.
3.The study of southern Pakistan shows that the pattern of precipitation is
irregular in this region in last 44 years. However, the mean precipitation was very
low and it doesn’t indicate that this precipitation contributed in floods.
Temperature change in this region is also insignificant.
48. In order to avoid such consequences again in the future; the Pakistan Gov. should
research and find a way to minimize the flood damage in the future. They should build
more dams and re-forestation should be among the top priority of the country.
References
Harris, I., Jones, P.D., Osborn, T.J. and Lister, D.H. (2014), Updated high-
resolution grids of monthly climatic observations - the CRU TS3.10
Dataset. International Journal of Climatology 34, 623-642
Cramer.D. (1998) “Fundamental statistic for social research”. London:
Routledge.
Cramer.D & Howwit.D (2004) “The SAGE dictionary of statistics”.
London:SAGE
Doane.D.P & Seward.L.E (2011) “Measuring Skewness”. Journal of
statistical education. 19(2), 1-18.
Razali.N.M & Wah.Y.B (2011). Power comparisons for Shapiro-Wilk;
Kolmogorov-Smirnov, Lilliefors and Anderson-Darling tests. Journal of
Statistical Modeling and Analytics. (2)1 21-23
Shapiro.S.S & Wilk.M.B (1965) “An Analysis of Variance Test for
Normality”. (Complete samples) Biometrika 52(3/4) 591-611