PR-228: Geonet: Unsupervised learning of dense depth, optical flow and camera...Hyeongmin Lee
이번 논문은, Video로부터 Unsupervised 방식을 통해 Flow, Depth, Camera Ego-motion까지 뽑아내는 GeoNet이라는 알고리즘입니다. Computer Vision에서 다루는 3D Geometry에 대해 간략히 설명 드린 후에 GeoNet 알고리즘을 소개하는 영상입니다.
This is a straightforward image classification study to create and compare classifiers (KNN, Neural Networks and Adaboost) that decide the correct orientation of a given image i.e. 0°,90°,180° or 270°
This project finds real objects dimensions from their images using OpenCV Java using two methods - Reference Method and Stereo Method.
Code for this project is available on my GitHub:
https://github.com/shyamabhuvanendran/VirtualRuler_CV
The frame camera is used by users of digital single-lens reflex cameras (DSLRs) as a shorthand for an image sensor format which is the same size as 35mm format (36 mm × 24 mm) film.
Panoramic imagery is created either by digitally stitching together multiple images from the same position (left/right, up/down) or by rotating a camera with conventional optics, and an area or line sensor.
in these slides firstly I made it clear about types of contents starting from the concept of dimension and then go with different concepts about depth perception and many other types of content, then I go through the complete 3d production pipeline with different techniques of different phases.
Edge detection is the name for a set of mathematical methods which aim at identifying points in a digital image at which the image brightness changes sharply or, more formally, has discontinuities.
EGME 431 Term ProjectJake Bailey, CSU FullertonSpring .docxSALU18
EGME 431 Term Project
Jake Bailey, CSU Fullerton
Spring 2016
This document serves to set forth the requirements for your term project, and the criteria
which such project submissions shall be judged. This outline should be the first point of inquiry
for any questions you may have about your project.
The project consists of a thorough investigation, analysis, and set of design improvement sug-
gestions for a simplified automobile suspension model. The dynamics of this model are rather
complex: as such, I have provided a detailed derivation of the equations of motion for this system
to you in a separate document. Your responsibility will be that of the analyst: use the provided dy-
namic models to investigate the system’s response to typical inputs, judge these responses critically,
and suggest improvements to the system.
Your project submissions shall consist of a single analysis and design report. The project
report shall be turned in no later than the final class meeting of the semester, which is May 10,
2016 at 7:00 PM. As always, late assignments will not be accepted. The report shall, at a minimum,
include:
• A description of your analysis methodology
• A summary of the important results from your analyses, including plots and data tables where
appropriate
• A thorough defense of your analysis results, including (but not limited to):
– comparison with analytical approximations
– investigation of typical results of published investigations, and
– discussion and investigation of the approximate errors accrued in your simulations
• A succinct description of the modifications you propose to improve the performance of the
system, including justification of your choices
The dynamic models which have been provided to you include both a fully coupled, non-linear
model and a simplified, linearized version. It is up to you to decide which to use for each portion
of the tasks outlined below. Note, however, that you should, at a minimum, simulate both models
under a common input. This will server as a basis for comparison.
Your specific tasks for this project are as follows:
1. Find the response of the system to a variety of inputs, including steps, impulses, and harmonic
excitation.
2. Determine the Displacement Transmissibility Ratio and Force Transmissibility Ratio of the
system over a range of input frequencies.
1
3. Using judgment, analytical techniques, and/or optimization methods, find a new set of sys-
tem parameters (stiffnesses and damping coefficients) which will improve the response of the
system to the selected inputs.
4. Finally, prepare a report which thoroughly summarizes and defends your methodology and
results.
A final word on collaboration. You are encouraged to discuss your ideas and your solution
approach with your classmates and colleagues. You are, however, expressly forbidden from sharing
simulation data, code, spreadsheets, scripts, or the like with anyone. Two students submitting
substantially similar s ...
Francesca Gottschalk - How can education support child empowerment.pptxEduSkills OECD
Francesca Gottschalk from the OECD’s Centre for Educational Research and Innovation presents at the Ask an Expert Webinar: How can education support child empowerment?
Model Attribute Check Company Auto PropertyCeline George
In Odoo, the multi-company feature allows you to manage multiple companies within a single Odoo database instance. Each company can have its own configurations while still sharing common resources such as products, customers, and suppliers.
Biological screening of herbal drugs: Introduction and Need for
Phyto-Pharmacological Screening, New Strategies for evaluating
Natural Products, In vitro evaluation techniques for Antioxidants, Antimicrobial and Anticancer drugs. In vivo evaluation techniques
for Anti-inflammatory, Antiulcer, Anticancer, Wound healing, Antidiabetic, Hepatoprotective, Cardio protective, Diuretics and
Antifertility, Toxicity studies as per OECD guidelines
Operation “Blue Star” is the only event in the history of Independent India where the state went into war with its own people. Even after about 40 years it is not clear if it was culmination of states anger over people of the region, a political game of power or start of dictatorial chapter in the democratic setup.
The people of Punjab felt alienated from main stream due to denial of their just demands during a long democratic struggle since independence. As it happen all over the word, it led to militant struggle with great loss of lives of military, police and civilian personnel. Killing of Indira Gandhi and massacre of innocent Sikhs in Delhi and other India cities was also associated with this movement.
Honest Reviews of Tim Han LMA Course Program.pptxtimhan337
Personal development courses are widely available today, with each one promising life-changing outcomes. Tim Han’s Life Mastery Achievers (LMA) Course has drawn a lot of interest. In addition to offering my frank assessment of Success Insider’s LMA Course, this piece examines the course’s effects via a variety of Tim Han LMA course reviews and Success Insider comments.
Synthetic Fiber Construction in lab .pptxPavel ( NSTU)
Synthetic fiber production is a fascinating and complex field that blends chemistry, engineering, and environmental science. By understanding these aspects, students can gain a comprehensive view of synthetic fiber production, its impact on society and the environment, and the potential for future innovations. Synthetic fibers play a crucial role in modern society, impacting various aspects of daily life, industry, and the environment. ynthetic fibers are integral to modern life, offering a range of benefits from cost-effectiveness and versatility to innovative applications and performance characteristics. While they pose environmental challenges, ongoing research and development aim to create more sustainable and eco-friendly alternatives. Understanding the importance of synthetic fibers helps in appreciating their role in the economy, industry, and daily life, while also emphasizing the need for sustainable practices and innovation.
The French Revolution, which began in 1789, was a period of radical social and political upheaval in France. It marked the decline of absolute monarchies, the rise of secular and democratic republics, and the eventual rise of Napoleon Bonaparte. This revolutionary period is crucial in understanding the transition from feudalism to modernity in Europe.
For more information, visit-www.vavaclasses.com
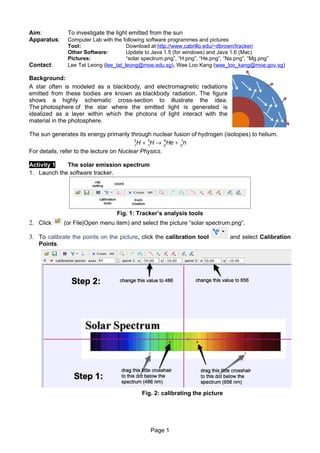
1. Aim: To investigate the light emitted from the sun
Apparatus: Computer Lab with the following software programmes and pictures
Tool: Download at http://www.cabrillo.edu/~dbrown/tracker/
Other Software: Update to Java 1.5 (for windows) and Java 1.6 (Mac)
Pictures: “solar spectrum.png”, “H.png”, “He.png”, “Na.png”, “Mg.png”
Contact: Lee Tat Leong (lee_tat_leong@moe.edu.sg), Wee Loo Kang (wee_loo_kang@moe.gov.sg)
Background:
A star often is modeled as a blackbody, and electromagnetic radiations
emitted from these bodies are known as blackbody radiation. The figure
shows a highly schematic cross-section to illustrate the idea.
The photosphere of the star where the emitted light is generated is
idealized as a layer within which the photons of light interact with the
material in the photosphere.
The sun generates its energy primarily through nuclear fusion of hydrogen (isotopes) to helium.
2
1
H + 3H → 2 He + 01n
1
4
For details, refer to the lecture on Nuclear Physics.
Activity 1 The solar emission spectrum
1. Launch the software tracker.
Fig. 1: Tracker’s analysis tools
2. Click (or File|Open menu item) and select the picture “solar spectrum.png”.
3. To calibrate the points on the picture, click the calibration tool and select Calibration
Points.
Fig. 2: calibrating the picture
Page 1
2. 4. Click Create and choose a track type from the menu of choices. Most moving objects
are tracked using a Line Profile.
• By holding down the shift key, left click & drag with the mouse across the spectrum to
create a line profile.
• Change the spread to about 5 to take an average reading of the intensity of the spectrum.
• The plot on the right hand side shows the brightness/intensity (luma) against the
wavelenght in nanometres.
Fig. 3: Creating a line profile
5. Right-click on the plot and choose analyse… in the popup menu.
• Select the Coordinate checkbox, move the crosshair to read the wavelength (x-axis) and
the corresponding intensity (y-axis).
What are the wavelengths that the spectrum intensity dips by a large amount? Suggest
with your reasoning why such dips occur.
………………………………………………………………………………………………………
………………………………………………………………………………………………………
………………………………………………………………………………………………………
………………………………………………………………………………………………………
Page 2
3. Fig. 4: detail data analysis
• Select the Data Builder … to build the Planck’s law for blackbody radiation.
2hc 2 1
I = constant × 5
λ hc
e λkT − 1
where I, h, c, λ , k and T are the intensity, Planck’s constant, speed of electromagnetic
radiation, wavelength (in m), Boltzmann constant and temperature of the body
respectively. The constant is about 3 × 10 −12 for this picture.
• Change the temperature T from the Data Builder… ranging from 4000 K to 7000 K,
observe how the smooth curve changes.
Deduce the surface temperature of the sun.
………………………………………………………………………………………………………
Activity 2Exploring the absorption lines in the solar spectrum for specific wavelengths
(Note: You do not need to use the Data Builder function for this activity)
Without closing the tracker software programme, analyse the emission spectrum of the Hydrogen,
Helium, Sodium and Magnesium (“solar spectrum.png”, “H.png”, “He.png”, “Na.png”, “Mg.png”) in
the same manner as the previous activity. Be systematic in naming the profile of the different
pictures.
Suggest how scientists might have deduced the elements that are present in the sun.
Hint: Summarise your finding for the two activities and relate the emission spectrum of the various
elements and the emission spectrum (and absorption lines) of the sun.
……………………………………………………………………………………………………………………
……………………………………………………………………………………………………………………
……………………………………………………………………………………………………………………
……………………………………………………………………………………………………………………
……………………………………………………………………………………………………………………
……………………………………………………………………………………………………………………
……………………………………………………………………………………………………………………
……………………………………………………………………………………………………………………
……………………………………………………………………………………………………………………
……………………………………………………………………………………………………………………
……………………………………………………………………………………………………………………
Page 3