A survey paper on sequence pattern mining with incremental
Applying predictive data mining and associative rule mining to spatio-temporal data
1.
Abstract—The intention of this paper is to present a model
to apply predictive data mining and Associative rule mining to
the ever changing spatio-temporal data. As the data is highly
varying, there is immense research importance to the models
that handle the highly variable spatio-temporal data
efficiently. The main issues are the management of large
volume of data and the amount of calculations to be done to
deal with such a data. We assume a general problem involving
n points in a u-dimensional space where each point having a
feature vector of v-dimensions denoting it’s properties.
I. INTRODUCTION
ssociactive rule mining is the discovery of association
rules showing attribute value conditions that occur
frequently together in a given data. The associative rule is
represented as A=>B which means that all the tuples in the
database that satisfy the conditions in A are likely to satisfy
the conditions in B where A and B are set of attributes.
A=A1^A2^A3^…Am and B=B1^B2^B3^….Bn For example
age( X,”4..9” ) => buys( X,”chocolate” ) ^ plays( X,”cricket” )
(support=3%,confidence =50%) means that among all the
people under study, 3% people are of age between 4 and 9.
And it is 50% probable that people of this age buy
chocolates and play cricket. Predictive data mining analyses
current and historical facts to determine the fate of future
event. We may also need predict the class to which the given
object belongs and estimate its value depending upon the
past experiences. is a template for Microsoft Word versions
6.0 or later.
This work was supported in as a part of semester project by the Indian
Institute Of Information Technology-Allahabad. We were under the
consistent mentorship of Dr.O.P.Vyas (DAAD Fellow (Technical
University of Kaiserslautern - Germany) AOTS Fellow (CICC-
Japan) )
Polisetti Vinay is a under graduate student of Indian Institute of
Information Technology pursuing in the Information Technology
stream (e-mail:vinaychitti@gmail.com, iit2007106@iiita.ac.in,
phone: 979-350-6423)
P.Sai Krishna Reddy is a under graduate student of Indian Institute
of Information Technology pursuing in the Information Technology
stream(e-mail:saikrishna.3490@gmail.com, phone: 979-523-5237)
Anirudh Perugu is a under graduate student of Indian Institute of
Information Technology pursuing in the Information Technology
stream (e-mail:akoolstud@gmail.com, iit2007060@iiita.ac.in, phone:
903-206-1867)
II. PROBLEM ADRESED
Suppose we have “n” points (nodes) in a plane of u-
dimensional space. Let each point be having a feature vector
of v-dimensions. As the spatial properties of points are their
location in space and the temporal co-ordinates are the
feature vector. With the progress of time, the points are
changing their positions in d-dimension plane along with
their feature vector. We need to find a mechanismto mine the
data which is varying both in spatial and temporal co-
ordinates.
III. REPRESENTATION OF DATA
Suppose we denote the spatial co-ordinate of any point as a
vector udddd ,...,, 321 and the feature vector of any
point is represented as vtttt ,...,, 321 .As all these values
are real numbers we maintain only a single vector of (u+v)
dimensions for each point called combined vector.In the
combined vector first u co-ordinates are spatial and next v
co-ordinates are temporal (features).We also maintain a
check board on which all the points are mapped. Let the
number of points be
k2
2 (i,e n=
k2
2 where k 2) .We can
map the points to the check board of size(
k
2 *
k
2 ).
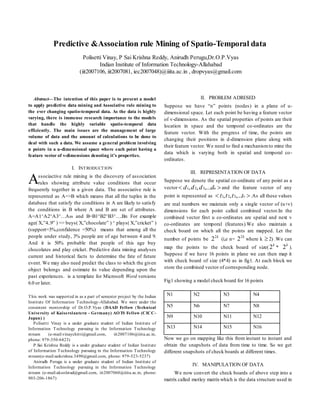
Suppose if we have 16 points in plane we can then map it
with check board of size (4*4) as in fig1. At each block we
store the combined vector of corresponding node.
Fig1 showing a model check board for 16 points
N1 N2 N3 N4
N5 N6 N7 N8
N9 N10 N11 N12
N13 N14 N15 N16
Now we go on mapping like this from instant to instant and
obtain the snapshots of data from time to time. So we get
different snapshots of check boards at different times.
IV. MANIPULATION OF DATA
We now convert the check boards of above step into a
matrix called motley matrixwhich is the data structure used in
Predictive &Association rule Mining of Spatio-Temporal data
Polisetti Vinay, P Sai Krishna Reddy, Anirudh Perugu,Dr.O.P.Vyas
Indian Institute of Information Technology-Allahabad
(iit2007106, iit2007081, iec2007048)@iiita.ac.in , dropvyas@gmail.com
A
2. mining the spatio-temporal data. We use the following
notation to produce motley matrix from any two consecutive
snapshots of check board. We replace each block of check
board with a proper color to obtain motley matrix. We denote
the points changing only spatially with blue color, the points
which change only temporal co-ordinates with green color,
the points which change both temporally and spatially with
red color and the points which do not change with white
color. For example from time 0T (snapshot of first check
board) to 1T (snapshot of second check board) if the node
changes only spatially but not temporally we replace it with
blue color and we do so for all the points. We finally obtain a
colorful check board obtained by replacing each node with
corresponding color depending on the changes occurred in
that node (point) in transition from 0T to 1T . We now divide
that colorful check board into four equal halves and each half
into further into four more equal halves and so on recursively
until we get color in the each boxto be same. The figure thus
obtained is called motley matrix.
Fig 2 showing the model of a possible motley matrix[2]
In the above figure we can observe that the figure was
divided recursively into 4 equal halves until we get same
color in the each and every block. Fromtime 0T to 1T we get a
check board and thus a motley matrix and similarly between
1T to 2T we get another check board and thus another
motley matrix. This process continues producing a motley
matrixper instant. We use this motley matrixto mine our data.
V. CONSTRUCTION OF OPTIONAL QUAD TREE
We now need a efficient data structure to emulate the
motley matrix of above section. We use Multi Version
optional quad tree (MVOQT) to represent the motley matrix
and we also use the following convention to convert motley
matrixto a tree that can be traversed in )log(n time.
Fig 3 showing the convention used to construct MVOQT
1 2
3 4
The root of the tree depicts the entire undivided motley
matrix. As we divide the motley matrixinto four equal halves,
we add four children to the root in the tree in the same order
as that is shown in fig 3. If each equal half of the matrix is
further divided then we add children to the corresponding
node of the tree. The tree for above motley matrix would be
as follows.
Fig 3 showing optional quad tree for motley matrixof fig 2 [2]
After the construction of quad tree we use it in many ways to
answer the queries. Infact we need an effective data structure
to represent the motley matrix and the requirement was that
we should be able to traverse the entire matrix in minimum
amount of time possible. So the effective data structure
which comes to mind is tree with considerable branching
factor (4 in case of MVOQT). We use this motley matrixand
MVOQT to find the patterns in the given data. We intend to
do classification, association rule mining and also predictive
data mining to answer the most probable queries.
VI. CLASSIFICATION RULE MINING
We now traverse the tree to mine the data. While building
3. the motley matrix we were checking whether the point has
changed spatially or temporally or both or not at all. That can
be done in the following way. Generate two randomnumbers
1r and 2r where ( ur 10 ) and ( vuru 21 )
recursively. If ( ))()!( 1
1
1
1
1 rNrN ii TT then we assume that
point
1
N has changed spatially from iT to 1iT . Continuing
the similar operations we can get to know about all the points
which changed spatially or temporally or both or not at all.
We indirectly have got some sort of classification here. Now
we can have an idea about what points are changing
spatially at what instant. We can analyze patterns fromthere
on knowing what points are changing at what rate. This
method will be very efficient because if we control the time
interval between two consecutive snapshots, very fewer
changes occur spatially and they can be tracked easily.
VII. ASSOCIATIVE RULE MINING
After building the MVOQT we ship the data to four linearly
accessable data structures (say a vector) as follows
Fig 4 showing four linearly accessable data structures
4T
3T
2T
1T
0T
4(a) Spatial Vector 4(b) Temporal Vector
4(c) Spatio-temporal Vector 4(d) Null vector
Once we build the MVOQT we ship the data to
corresponding linear data structure from instant to instant.
We store all the points which changed only spatially from
0T to 1T in spatial vector with label as 0T .At any instant (say
from iT to 1iT ) points which change only spatially are
stored in spatial vector under the label iT .Similarly we fill all
the linear vectors similarly. For example for two continuous
instances of spatial vector say instants 0T and 1T each entry
in the spatial vector will be as follows.
Fig 5 showing the entries in spatial vector
5(a) showing the entry in spatial vector at 0T
5(b) showing the entry in spatial vector at 1T
Now we can clearly observe five or six instances like this of
spatial vector (and all other vectors too) and frame rules to
mine the data. From the above two instances we can make
out that whenever both node 3 and node 4 changes spatially
and if node 4 doubles its co-ordinates < 21,dd > then node 3
also changes spatially and doubles only the co-ordinates
< 21,dd > and rest all don‟t change. Put the associative rule
),,(),,( 213214 ddNNodeddNNode .We can
also observe that when node 4 doesn‟t change its d3, d4 and
d5 co-ordinate values so does node 3.We can put this as
),,!,(),,!,( 54335434 dddNNodedddNNode
Thus as the time passes we can keep on building the
MVOQTs and from there on we can go on fill the entries of
respective vectors. We can start finding the patterns from
respective vectors. The main advantage of this MVOTQ is
we are able to reach a group of nodes having similar
properties in just one go. We can compare different motley
matrices and can also predict the class to which given node
4T
3T
2T
1T
0T
4T
3T
2T
1T
0T
4T
3T
2T
1T
0T
4. belongs to. For example if in motley matrix 1 the node
1
N is
green and in motley matrix2 it is also green and further if it is
also green in motley matrix 3 then we can predict that node
1
N will be green in 4th
motley matrix with the probability of
0.75.Similarly by analyzing the particular spatial or temporal
co-ordinate values fromdifferent motley matrices we can also
predict the value of a particular spatial or temporal co-
ordinate.
VIII. CONCLUSION
We conclude from this paper that b using these three data
structures motley matrix followed by Multi Version Optional
Quad Tree (MVOTQ) and further shipping the data to any
linearly accessable data structure such as a vector or array of
arrays we can effectively reduce the amount of manipulations
needed to reach a node of specified property.
ACKNOWLEDGMENT
Polisetti Vinay finally thank our Prof.Dr.O.P.Vyas for his
consistent encouragement and for motivating us right from
the beginning in all the aspects. I also thank Mr.Dheeraj
Tyagi for his whole hearted help throughout in presenting a
wonderful paper.
REFERENCES
[1]Multi version Linear Quadtree for Spatio-Temporal Data
by Theodoros Tzouramanis, Michael Vassilakopoulos, and
Yannis Manolopoulos Data Engineering Lab Department of
Informatics, Aristotle University
[2] Modeling Highly Variable Spatio-Temporal Data T-S. Yeh B. de
Cambray PRISM Laboratory (CNRS, Universities of Paris VI
and Versailles-St Quentin) & GDR Cassini
[3] M. J. Egenhofer. What's special about spatial?
Database requirements for vehicle navigation in geographic
space. In ACM SIGMOD, pages 398-402, May 1993
[4] Continuous Query Processing of Spatio-temporal Data
Streams in place
Mohamed F. Mokbel Xiaopeng Xiong Moustafa A. Hammad
Walid G. Aref_ Department of Computer Sciences, Purdue
University, West Lafayette, IN 47907-1398
[5] Data Mining Conceptions andTechniques
Jiawei Han and Micheline Kamber
[6] Mesrobian, E., Muntz, R., Shek, E., Santos, J.R., Yi, J., Ng, K.,
Chien, S.Y., Mechoso, C., Farrara, J., Stolorz, P. and
Nakamura, H. 1995. „Exploratory data mining and analysis
using CONQUEST‟. In Proc. IEEE Pacific Rim Conference
on Communications, Computers and Signal Processing,
IEEE, New York. 281-286.
[7] Koperski, K. and Han, J. 1995. „Discovery of Spatial
AssociationRules in Geographic Information Databases’. In
Proc. Fourth International Symposium on Large Spatial
Databases, Maine 47-6
![mining the spatio-temporal data. We use the following
notation to produce motley matrix from any two consecutive
snapshots of check board. We replace each block of check
board with a proper color to obtain motley matrix. We denote
the points changing only spatially with blue color, the points
which change only temporal co-ordinates with green color,
the points which change both temporally and spatially with
red color and the points which do not change with white
color. For example from time 0T (snapshot of first check
board) to 1T (snapshot of second check board) if the node
changes only spatially but not temporally we replace it with
blue color and we do so for all the points. We finally obtain a
colorful check board obtained by replacing each node with
corresponding color depending on the changes occurred in
that node (point) in transition from 0T to 1T . We now divide
that colorful check board into four equal halves and each half
into further into four more equal halves and so on recursively
until we get color in the each boxto be same. The figure thus
obtained is called motley matrix.
Fig 2 showing the model of a possible motley matrix[2]
In the above figure we can observe that the figure was
divided recursively into 4 equal halves until we get same
color in the each and every block. Fromtime 0T to 1T we get a
check board and thus a motley matrix and similarly between
1T to 2T we get another check board and thus another
motley matrix. This process continues producing a motley
matrixper instant. We use this motley matrixto mine our data.
V. CONSTRUCTION OF OPTIONAL QUAD TREE
We now need a efficient data structure to emulate the
motley matrix of above section. We use Multi Version
optional quad tree (MVOQT) to represent the motley matrix
and we also use the following convention to convert motley
matrixto a tree that can be traversed in )log(n time.
Fig 3 showing the convention used to construct MVOQT
1 2
3 4
The root of the tree depicts the entire undivided motley
matrix. As we divide the motley matrixinto four equal halves,
we add four children to the root in the tree in the same order
as that is shown in fig 3. If each equal half of the matrix is
further divided then we add children to the corresponding
node of the tree. The tree for above motley matrix would be
as follows.
Fig 3 showing optional quad tree for motley matrixof fig 2 [2]
After the construction of quad tree we use it in many ways to
answer the queries. Infact we need an effective data structure
to represent the motley matrix and the requirement was that
we should be able to traverse the entire matrix in minimum
amount of time possible. So the effective data structure
which comes to mind is tree with considerable branching
factor (4 in case of MVOQT). We use this motley matrixand
MVOQT to find the patterns in the given data. We intend to
do classification, association rule mining and also predictive
data mining to answer the most probable queries.
VI. CLASSIFICATION RULE MINING
We now traverse the tree to mine the data. While building](data:image/gif;base64,R0lGODlhAQABAIAAAAAAAP///yH5BAEAAAAALAAAAAABAAEAAAIBRAA7)