Download to read offline

This document discusses the removal of phenolic compounds from wastewater using locally available and low-cost activated carbons. It examines the adsorption efficiency of rice husk carbon, casuarina wood carbon, and saw dust carbon for removing phenols at various initial concentrations. The results show that all activated carbons were able to remove phenols, with saw dust carbon performing the best and rice husk carbon performing the worst. Specifically, saw dust carbon achieved phenol removals ranging from 18% at 2 mg/L to 64% at 20 mg/L. Overall, this study suggests using low-cost activated carbons derived from local materials can provide an affordable alternative to commercial activated carbon for phenol removal from wast


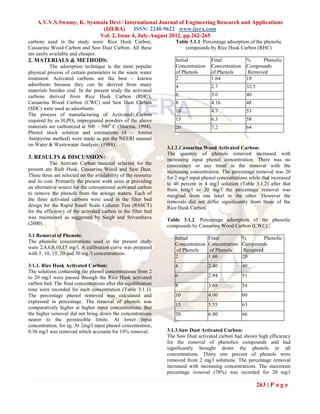
![Payal phd slides final1 [autosaved]](https://cdn.slidesharecdn.com/ss_thumbnails/payalphdslidesfinal1autosaved-210827172458-thumbnail.jpg?width=640&height=640&fit=bounds)


