Coconut coir dust ion exchange resins for removal of ni2+ ion
Β
Bj25364370
1. B. Veena Devi, A.A. Jahagirdar, M.N. Zulfiqar Ahmed / International Journal of Engineering
Research and Applications (IJERA) ISSN: 2248-9622 www.ijera.com
Vol. 2, Issue 5, September- October 2012, pp.364-370
Adsorption of Chromium on Activated Carbon Prepared from
Coconut Shell
B. Veena Devi*, A.A. Jahagirdar**, M.N. Zulfiqar Ahmed***
*
(Department of Chemistry, Dr. Ambedkar Institute of Technology, Bangalore - 560056, India)
**
(Department of Chemistry, Dr. Ambedkar Institute of Technology, Bangalore - 560056, India)
***
(Department of Chemistry, HKBK College of Engineering, Bangalore - 560045, India)
ABSTRACT
Activated carbon was prepared from environment. In such aqueous waste, Chromium
coconut shell by pyrolysis. It was characterized (VI) is present as either dichromate (Cr2O7 2-) in
by PXRD, and SEM. Different physical acidic environments or as chromate (CrO42- ) in
properties such as bulk density, moisture alkaline environments.
content, volatile matter content, ash content, Several treatment technologies have been developed
hardness, decolorizing power, phenol number, to remove chromium from water and waste water.
iodine number and surface area and porosity Common methods include chemical precipitation,
were also determined. The activated carbon was ion exchange, membrane separation, ultrafiltration,
used as adsorbent for the removal of chromium filtration, elctrocoagulation, solvent extraction,
from an electroplating industry. The effect of sedimentation, reverse osmosis, dialysis,
various parameters such as adsorbent dosage, electrodialysis, adsorption and filtration,
particle size, pH, contact time and stirring evaporation, cementation, dilution, air stripping,
speed was studied. The studies showed that the steam stripping, flocculation and chelation [2-6].
activated carbon can be used as a good adsorbent Reduction and chemical precipitation has
for the removal of hexavalent chromium from traditionally been the most used method. The most
electroplating industries. often used precipitation processes include
Key words - Activated carbon, adsorption, hydroxide, sulphide, carbonate and phosphate
electroplating industry, hexavalent chromium, precipitation techniques. The disadvantage of
SEM. precipitation technique is the production of sludge.
This process suffers from draw backs like
1. Introduction incomplete removal, requirement of sizable
Chromium (VI) is highly toxic in nature. quantities of treatment chemicals and production of
This is due to the fact that one of the reduction voluminous toxic sludge. It constitutes a solid waste
products of Chromium (VI) is Chromium (V). disposal problem. A variety of other treatment
Chromium (V) is a known carcinogen and will technologies were considered and evaluated.
lodge in any tissue to form cancerous growths. Techniques like ion exchange and adsorption with
There are reports that Chromium (V) is also a factor products obtained from naturally occurring materials
leading to premature senility in parts of Russia. The like activated carbon were considered as better
Chromium (VI) is a very strong oxidizing agent alternatives. The exorbitant cost involved with ion
(therefore very fast in reacting, unlike Chromium exchange makes it prohibitive for wide application
(III) and likely to form complexes). Chromium (VI) [7-9].
is not a very stable state when compared to Cr (III). Coconut shells are available in plenty in tropical
Chronic inhalation of Chromium (VI) compounds countries. The utilization of this waste material
increases the risk of lung, nasal and sinus cancer. helps in recycling waste and thus keeping the eco
Severe dermatitis skin ulcer can result from contact system clean. Mitigation measures based on low
with Chromium (VI) compounds. It can cause mild cost technologies hold promise of wide applicability
to severe liver abnormalities. Chromium (VI) in developing countries. This methodology can be
compounds are teratogenic to animals [1]. profitably employed by least developed and
Effluents from electroplating and tannery industries developing countries in mitigating pollution due to
is a major source of aquatic pollution in India with the heavy metal ion chromium [10-12].
high chemical oxygen demand (COD), biological
oxygen demand (BOD), and hexavalent chromium. 2. Materials and Methods
In India, there are a large number of tanneries The coconut shells were washed with water
scattered all over the country but the main areas of to remove sticking and lose matter and then sun
their concentration are Tamilnadu, Uttar Pradesh dried for 5 days (8 hours per day). The dried
and West Bengal. Nearly 80% of these tanneries are samples were then hammer broken to pieces and
engaged in the chrome tanning processes. Most of then converted to a powder using a mixer. Three
them discharge untreated wastewater into the temperature routes were followed for preparing
364 | P a g e
2. B. Veena Devi, A.A. Jahagirdar, M.N. Zulfiqar Ahmed / International Journal of Engineering
Research and Applications (IJERA) ISSN: 2248-9622 www.ijera.com
Vol. 2, Issue 5, September- October 2012, pp.364-370
active carbon by taking known quantities of obtained. The residue is reported as ash on
powdered coconut shell. percentage basis.
Samples were pyrolysed in a muffle furnace in the
presence of steam flow. A two step procedure was 2.1.5 Hardness
followed. Sample was carbonized at 550 0 C for 2 The percentage of particles passing through
hours and then a physical activation method was a screen of 275 mesh was determined. . Then the
followed for different periods of time. Through the particles were subjected to hammer force for five
inspection hole in the muffle furnace door a glass minutes and then the particles which passed through
tube was introduced which was connected to a a screen of 300 mesh were determined. The
steam generator. Thus a continuous flow of steam percentage of particles not broken to fine size was
was maintained. Three different samples were expressed as percentage of hardness.
prepared and coded as 750S40, 750S100 and
800S30. The samples 750S40 and 750S100 were 2.1.6 Decolorizing Power
prepared by heating the powders to 750 0C and Decolorizing power is the ability of
keeping them at 750 0C for 40 minutes and 100 activated carbon to decolorize a dilute blue colored
minutes respectively. In case of sample 800S30, the solution of methylene blue. It is expressed as mg/g.
powder was heated to 800 0C and then maintained at
that temperature for 30 minutes. 2.1.7 Phenol Number
100 cm3 of 30 ppm solution of phenol was
2.1 Characterization of Activated Carbon taken in a 250 cm3 leak proof reaction flask. The pH
Powders of the solution was adjusted to neutral by adding 0.1
2.1.1 Bulk Density N NaOH or 0.1 N H2SO4. A known weight of the
The activated carbon sample were packed activated carbon powder was added to it. The
in a previously weighed 25 cm3 specific gravity solution was equilibrated for 24 hours at room
bottle by repeatedly tapping the bottle so that temperature followed by filtration and subsequent
powder is filled upto the mark. The bottle was analysis of the filtrate for phenol concentration. The
weighed again. The difference in the weights gives concentration of phenol was determined by
the weight of powder taken in the bottle. The bulk spectrophotometric analysis for the colour resulting
density of the powder was calculated using equation from the reaction of phenol with 4-amino antipyrene
1. at a wave length of 600 nm.
[(π€πππ ππ‘ ππ πππ€πππ π‘ππππ ππ π‘ππ πππ‘π‘ππ )
π΅π’ππ ππππ ππ‘π¦ = (1)
25
2.1.8 Surface area and porosity
2.1.2 Moisture content
The BET surface area of activated carbon
About one gram of the powdered air dried
powder was determined by nitrogen adsorption
activated carbon powder was taken in a previously
desorption method. The instrument used was
weighed crucible. The crucible was placed in an
MICROMERITICS GEMINE 2375. Nitrogen gas
electric hot air oven maintained at about 110 0 C.
was allowed to adsorb on the powder at 77 K. The
After one hour the crucible is taken out, cooled in a
nitrogen adsorption and desorption isotherms were
desiccator and weighed again. The loss in weight of
used to determine parameters like surface area, pore
the powder reported on percentage basis gives
volume and pore size.
moisture content in the sample.
2.1.9 Iodine Number
2.1.3 Volatile Matter
Iodine number is defined as the number of
About one gram of the powdered air dried
milligrams of iodine absorbed by one gram of
activated carbon powder was taken in a previously
activated carbon powder. Iodine solution is prepared
weighed crucible. The crucible was placed in a
by dissolving 13 grams of iodine in 50 cm3 of
muffle furnace maintained at about 925 0 C. It was
glacial acetic acid and then diluting up to the mark
taken out after exactly 7 minutes. After first cooling
in a 1000 cm3 volumetric flask. A known weight of
in air, the crucible was cooled in a desiccator and
the activated carbon powder (about 0.25 g) was
weighed again. The loss in weight of the powder
suspended in 10 cm3 of carbon tetra chloride taken
reported on percentage basis gives volatile matter
in a 250 cm3 conical flask. To this a known volume
content in the sample.
of the prepared iodine solution was added. Similarly
2.1.4 Ash Content
a blank solution was also prepared by taking same
The residual activated carbon powder from the
volumes of carbon tetra chloride iodine solution as
above step was then heated in a muffle furnace at
in the previous case but without the activated carbon
750 0 C for about half an hour. After first cooling in
powder. Both the conical flasks were kept in a
air, the crucible was cooled in a desiccator and
shaking machine for one hour. Then the solution
weighed again. The heating, cooling and weighing
were is rapidly filtered using Whatman filter paper
cycle was repeated till a constant weight was
no. 41. 20 cm3 of the filtrate was transferred into a
250 cm3 conical flask. To this 20 ml of 15%
365 | P a g e
3. B. Veena Devi, A.A. Jahagirdar, M.N. Zulfiqar Ahmed / International Journal of Engineering
Research and Applications (IJERA) ISSN: 2248-9622 www.ijera.com
Vol. 2, Issue 5, September- October 2012, pp.364-370
potassium iodide and 100 ml of distilled water were The amount of chromium adsorbed qt was
added. The contents of both the flask were titrated calculated using equation 3.
against standard sodium thiosulphate using freshly πΆπ β πΆπ‘ π
ππ‘ = (3)
prepared starch as indicator. The volume of sodium ππ
thiosulphate solution consumed in case of both back where,
and ban titrations was determined. The difference in Co = initial chromium concentration in mg/L
initial and final concentrations of iodine was Ct = chromium concentration at time t
determined and from this the iodine number was mo = mass of activated carbon in g
calculated using equation 2. V - Volume of chromium solution in cm3
πΌπππππ ππ’ππππ = The effect of adsorbent dosage, particle size, pH,
π·πππππππππ ππ πππππππ‘πππ‘πππ ππ ππππππ ππ ππ contact time, stirring speed, initial concentration of
(2)
ππππ ππ‘ ππ πππ‘ππ£ππ‘ππ ππππππ ππ π Cr (VI) and temperature were studied by varying
any one of the parameters and keeping the other
2.2 X ray Diffraction parameters constant.
The structural analysis of the activated
carbon powder was determined by PXRD. The 3. Results and Discussions
PXRD pattern was recorded by using Philips PW 3.1 Bulk Density measurements
1051 X-ray diffractometer using Cu KΞ± radiation (Ξ» Bulk density is an important parameter of
= 1.5405 A0) with Nickel filter at a scanning rate of powdered solids. The American Water Work
20/minute. Association has set a lower limit on bulk density at
0.25 gm/ml for activated carbon to be of practical
2.3 FTIR Spectroscopy use. The bulk density values of the prepared are
The FTIR studies were conducted on given in table 1 of prepared samples satisfies this
activated carbon sample to determine the various condition. The bulk density data are in agreement
organic and inorganic groups on the surface. The with the values reported in literature [13-15].
instrument used to record the FTIR spectrum
Shimadzu with KBr as reference. Table 1. Bulk density values of the samples
Sl. Bulk density (g /
2.4 Scanning Electron Microscopy Sample
No. cm3)
The surface morphology of the activated
1 750S40 0.2641
carbon samples were studied by scanning electron
2 750S100 0.2592
microscopy. The SEM micrograph was recorded
3 800S30 0.2632
using JEOL JSM 5200 instrument.
2.5 Adsorption Studies 3.2 Moisture Content
An adsorbate stock solution of 1000 mg/l The moisture content values of the
of Cr (VI) was prepared by dissolving 2.829 g of prepared activated carbon samples are reported in
potassium dichromate in double distilled water. The table 2. The commercially available samples contain
stock solution was diluted suitably to get 100, 200, about 5-8% moisture [16].
300, 400 and 500 mg of Cr (VI) solutions. Batch
adsorption experiments were carried out by shaking Table 2. Moisture content values of the samples
500 mg of activated carbon with 100 ml of Sl. Percentage
potassium dichromate solution of known No. Sample moisture
concentration in 200 ml Erlenmeyer flasks at content
specified temperatures in a thermostated water bath 1 750S40 5.11
mechanical shaker. 2 750S100 5.31
The flasks were removed after the desired contact 3 800S30 5.21
time. A definite volume (5ml) of the solution was
withdrawn and quickly filtered through Whatmann 3.3 Volatile matter
No.40 filter paper. The filtrates were analyzed using The coconut shell samples were weighed
UV-Visible spectrophotometer (Hitachi 2000) at a before and after pyrolysis. Table 3 gives the
wavelength 540 nm using diphenyl carbazide as percentage conversion values for the samples after
complexing agent. In acidic media some part of pyrolysis.
chromium (VI) was reduced to the trivalent state. Table 3. Percentage conversion values for the
Hence Cr (III) is oxidized to Cr (VI) by potassium samples after pyrolysis
permanganate and sodium azide. The adsorbed Percentag
Weight Weight
chromium (VI) was calculated by taking the Sl. e
before after
difference of initial concentration and final No Sample of
Pyrolysi Pyrolysi
chromium concentration in the filtrate. . conversio
s s
n
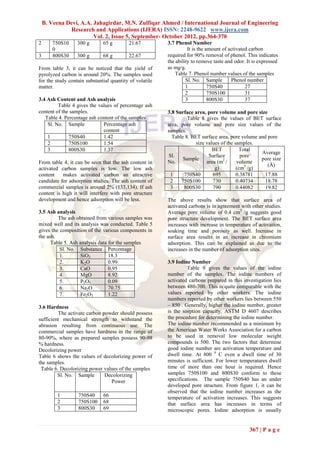
1 750S40 300 g 62 g 20.67
366 | P a g e
4. B. Veena Devi, A.A. Jahagirdar, M.N. Zulfiqar Ahmed / International Journal of Engineering
Research and Applications (IJERA) ISSN: 2248-9622 www.ijera.com
Vol. 2, Issue 5, September- October 2012, pp.364-370
2 750S10 300 g 65 g 21.67 3.7 Phenol Number
0 It is the amount of activated carbon
3 800S30 300 g 68 g 22.67 required for 90% removal of phenol. This indicates
the ability to remove taste and odor. It is expressed
From table 3, it can be noticed that the yield of as mg/g.
pyrolyzed carbon is around 20%. The samples used Table 7. Phenol number values of the samples
for the study contain substantial quantity of volatile Sl. No. Sample Phenol number
matter. 1 750S40 27
2 750S100 31
3.4 Ash Content and Ash analysis 3 800S30 37
Table 4 gives the values of percentage ash
content of the samples. 3.8 Surface area, pore volume and pore size
Table 4. Percentage ash content of the samples Table 8 gives the values of BET surface
Sl. No. Sample Percentage ash area, pore volume and pore size values of the
content samples.
1 750S40 1.42 Table 8. BET surface area, pore volume and pore
2 750S100 1.54 size values of the samples.
3 800S30 1.37 BET Total
Average
Sl. Surface pore
Sample 2 pore size
From table 4, it can be seen that the ash content in No. area (m / volume
(Γ )
activated carbon samples is low. The low ash g) (cm3 /g)
content makes activated carbon an attractive 1 750S40 695 0.38781 17.88
candidate for adsorption studies. The ash content of 2 750S100 730 0.40734 18.78
commercial samples is around 2% (133,134). If ash 3 800S30 790 0.44082 19.82
content is high it will interfere with pore structure
development and hence adsorption will be less. The above results show that surface area of
activated carbons is in agreement with other studies.
3.5 Ash analysis Average pore volume of 0.4 cm3 /g suggests good
The ash obtained from various samples was pore structure development. The BET surface area
mixed well and its analysis was conducted. Table 5 increases with increase in temperature of activation,
gives the composition of the various components in soaking time and porosity as well. Increase in
the ash. surface area results in an increase in chromium
Table 5. Ash analysis data for the samples adsorption. This can be explained as due to the
Sl. No. Substance Percentage increases in the number of adsorption sites.
1. SiO2 18.3
2. K 2O 0.99 3.9 Iodine Number
3. CaO 0.95 Table 9 gives the values of the iodine
4. MgO 8.92 number of the samples. The iodine numbers of
5. P2O5 0.09 activated carbons prepared in this investigation lies
6. Na2O 70.75 between 480-700. This is quite comparable with the
7. Fe2O3 1.22 values reported by other workers. The iodine
numbers reported by other workers lies between 550
3.6 Hardness β 850 . Generally, higher the iodine number, greater
The activate carbon powder should possess is the sorption capacity. ASTM D 4607 describes
sufficient mechanical strength to withstand the the procedure for determining the iodine number.
abrasion resulting from continuous use. The The iodine number recommended as a minimum by
commercial samples have hardness in the range of the American Water Works Association for a carbon
80-90%, where as prepared samples possess 90-98 to be used in removal low molecular weight
% hardness. compounds is 500. The two factors that determine
Decolorizing power good iodine number are activation temperature and
Table 6 shows the values of decolorizing power of dwell time. At 800 0 C even a dwell time of 30
the samples. minutes is sufficient. For lower temperatures dwell
Table 6. Decolorizing power values of the samples time of more than one hour is required. Hence
Sl. No. Sample Decolorizing samples 750S100 and 800S30 conform to these
Power specifications. The sample 750S40 has an under
developed pore structure. From figure 1, it can be
observed that the iodine number increases as the
1 750S40 66 temperature of activation increases. This suggests
2 750S100 68 that surface area has increases in terms of
3 800S30 69 microscopic pores. Iodine adsorption is usually
367 | P a g e
5. B. Veena Devi, A.A. Jahagirdar, M.N. Zulfiqar Ahmed / International Journal of Engineering
Research and Applications (IJERA) ISSN: 2248-9622 www.ijera.com
Vol. 2, Issue 5, September- October 2012, pp.364-370
associated with micro pores because of the small
size of iodine molecule.
Table 9. Iodine number values of the samples
Sl. No. Sample Iodine Number
1 750S40 478
2 750S100 562
3 800S30 682
Variation of Iodine Number in S samples
800
700 682
600
562
Figure 6 SEM micrograph of sample after adsorption of
Iodine Number
500
478
400
chromium
300
3.2 Adsorption Equilibrium Studies
200
3.2.1 Effect of Adsorbent Dosage
100
Figure 7 shows the effect of adsorbent
0
750S40 750S100 800S30 dosage on the removal of chromium. It is clear from
samples the figure that as the adsorbent dosage increases, the
Figure 1. Variation of iodine number of the samples adsorption also increases. This is due to fact that an
3.10 X-Ray Diffraction Studies increase in adsorbent dosage increases the number
Figure 2 shows the PXRD profile of the powdered of active sites available for adsorption. Optimum
sample. The PXRD pattern shows the presence of removal of chromium (about 94%) was achieved for
amorphous carbon in the sample. The crystalline an adsorbent dosage of 2 g of the adsorbent. Beyond
phases of Si, KCl, Fe, Zn are also present. The the optimum dosage, the adsorption negligible
peaks in the PXRD profile correspond to those increase in adsorption occurred.
reported in the literature for activated carbon. Dosage of Carbon and Removal of Cr
100
90
80
Amount of Cr romoved in %
70
60
50
40
30
20
10
0
0.5 g 1.0 g 1.5 g 2.0 g
Figure 2. PXRD profile of activated carbon sample Amount of carbon
Figure 7. Effect of adsorbent dosage
3.11 Scanning Electron Microscopy Studies
Figures 5 and 6 show the SEM
3.2.2 Effect of Particle Size
micrographs of the sample before and after
Various particle sizes of carbons were used
chromium coating. The porosity is less in case of
to conduct experiments to determine % removal of
figure 6 compared to that in case of figure 5 which chromium at 25 0C at an initial concentration of 200
indicates the adsorption of chromium in the pores of mg /dm3 . The removal of chromium at different
the sample.
particle sizes illustrated that removal rate increases
as the particle size decreases. As can be seen from
figure 8 that the adsorption increases as the particle
size decreases. The relatively higher adsorption rate
as the particle size decreases is due to the increase in
surface area. There is a tendency as fine particles
exhibit lesser time to equilibriate in shorter time.
Figure 5 SEM micrograph of sample before adsorption of
chromium
368 | P a g e
6. B. Veena Devi, A.A. Jahagirdar, M.N. Zulfiqar Ahmed / International Journal of Engineering
Research and Applications (IJERA) ISSN: 2248-9622 www.ijera.com
Vol. 2, Issue 5, September- October 2012, pp.364-370
particle size and % Cr removal
point charge (pHzpc) which lies between the two
values. The pHzpc is a point at which the adsorbent
120
surface groups either acidic or basic no longer
100
contribute to the pH of the solution. Maximum
adsorption of Cr (VI) ions at lower pH has been
80
reported [17, 18].
% Cr removal
60 Effect of pH on Cr removal for S samples
100 90
40
90 80
80 70
20
70
60
% Cr removal
60
0 50
50
0 50 100 150 200 250 300
40
mesh no. 40
30
30
20
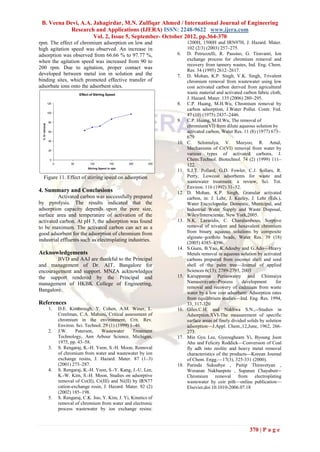
Figure 8. Effect of particle size on adsorption 20
10 10
0 0
3.2.3 Effect of pH 0 1 2 3 4 5 6 7 8
The effect of pH on the adsorption of pH
chromium by activated carbon was studied at pH
values of 1 to 7. 0.5g of activated carbon was 750S40, 750S100, 800S30
suspended in 100 ml of solution which contained 80 Figure 9. Efect of pH on adsorption
mg of chromium per liter. Different pH conditions
were maintained by adding HCl and acetic acid- 3.2.4 Effect of contact time on Adsorption
sodium acetate buffer. The adsorption of chromium Adsorption experiments were conducted as
was determined after an equilibration time of one a function of contact time and the results are shown
hour at a stirring speed of 200 rpm. in figure 10. The rate of Cr (VI) binding with
pH influences the adsorption of Cr(VI) ions on the adsorbent was greater in the initial stages, then
adsorbate as it affects the solubility of metal ions gradually decreased and remained almost constant
and hence the electrostatic binding of ions. From after an optimum period. After 60 minutes the
figure 9, it is evident that at lower pH between 2 and adsorption reaches an optimum value of 92%. This
3 the adsorption is maximum. This could be is because initially a large number of vacant sites are
attributed to the high concentration of H+ ions at available for adsorption and after some time the
lower pH values which neutralizes the negatively remaining sites may be difficult to occupy due to
charged adsorbate Cr2O72- ions. The decrease in the repulsive forces between adsorbate ions on the solid
adsorption efficiency at higher pH can be attributed and in the solution. Similar results have been
to increase in the concentration of OH- ions which reported by other investigators.
hinder the diffusion of Cr (VI) ions. Effect of time on Adsorption
The process of adsorption of metal ions on the 30
adsorbent involves the binding of metal ions by
Amount of Cr on adsorbate (mg)
electrostatic forces of attraction. The surface of the 25
adsorbent is positively chargede and hence 20
negatively charged Cr2O72- ions are held by
15
electrostatic forces of attraction.
It has been suggested that the mechanism for metal 10
adsorption is due to the acidic functional C=O 5
groups on the adsorbent surface. The presence of
0
oxygen functional groups make the adsorbent 0 50 100 150 200 250
surface negatively charged and therefore a repulsive time in minutes
electrostatic interaction between the adsorbent and Figure 10. Effect of contact on adsorption
the anion where as for a cation the negatively
charged group enhances the electrostatic interaction 3.2.5 Effect of Stirring Speed
with the negatively charged surface of the adsorbent The effect of the agitation of the
mainly through carboxylic ligands. sorbent/sorbate system in chromium adsorption was
According to the fig, the rates of adsorption are monitored at low, medium and high- agitation
weak with low values of pH (<2). Between 2 and 3 speeds (80, 100, 120, 150, 200 rpm). The results are
the rates of absorption increase rapidly. This is due shown in figure 11.
to the surface charge of the metal, which is strongly 0.5 gm of adsorbent and 50 ml of the solution
related to the pH of the solution. Maximum containing 100 mg/l of chromium at pH 3 was
adsorption capacity is observed in the pH range 2 to agitated between 90 and 210 rpm. Maximum of
3. This indicates that the pH corresponds to the zero 97.77 % chromium removal was achieved at 200
369 | P a g e
7. B. Veena Devi, A.A. Jahagirdar, M.N. Zulfiqar Ahmed / International Journal of Engineering
Research and Applications (IJERA) ISSN: 2248-9622 www.ijera.com
Vol. 2, Issue 5, September- October 2012, pp.364-370
rpm. The effect of chromium adsorption on low and 1200H, 1500H and IRN97H, J. Hazard. Mater.
high agitation speed was observed. An increase in 102 (2/3) (2003) 257β275.
adsorption was observed from 66.66 % to 97.77 %, 6. D. Petruzzelli, R. Passino, G. Tiravanti, Ion
when the agitation speed was increased from 90 to exchange process for chromium removal and
recovery from tannery wastes, Ind. Eng. Chem.
200 rpm. Due to agitation, proper contact was Res. 34 (1995) 2612β2617.
developed between metal ion in solution and the 7. D. Mohan, K.P. Singh, V.K. Singh, Trivalent
binding sites, which promoted effective transfer of chromium removal from wastewater using low
adsorbate ions onto the adsorbent sites. cost activated carbon derived from agricultural
Effect of Stirring Speed
waste material and activated carbon fabric cloth,
J. Hazard. Mater. 135 (2006) 280β295.
120 8. C.P. Huang, M.H.Wu, Chromium removal by
carbon adsorption, J.Water Pollut. Contr. Fed.
100
47 (10) (1975) 2437β2446.
80
9. C.P. Huang, M.H.Wu, The removal of
% Cr removal
chromium(VI) from dilute aqueous solution by
60 activated carbon, Water Res. 11 (8) (1977) 673β
679
40
10. C. Selomulya, V. Meeyoo, R. Amal,
20
Mechanisms of Cr(VI) removal from water by
various types of activated carbons, J.
0 Chem.Technol. Biotechnol. 74 (2) (1999) 111β
0 50 100 150 200 250
122.
Stirring Speed in rpm
11. S.J.T. Pollard, G.D. Fowler, C.J. Sollars, R.
Figure 11. Effect of stirring speed on adsorption Perry, Lowcost adsorbents for waste and
wastewater treatment: a review, Sci. Tot.
Environ. 116 (1992) 31β52.
4. Summary and Conclusions 12. D. Mohan, K.P. Singh, Granular activated
Activated carbon was successfully prepared carbon, in: J. Lehr, J. Keeley, J. Lehr (Eds.),
by pyrolysis. The results indicated that the Water Encyclopedia: Domestic, Municipal, and
adsorption capacity depends upon the pore size, Industrial Water Supply and Waste Disposal,
surface area and temperature of activation of the Wiley/Interscience, New York,2005.
activated carbon. At pH 3, the adsorption was found 13. N.K. Lazaridis, C. Charalambous, Sorptive
to be maximum. The activated carbon can act as a removal of trivalent and hexavalent chromium
good adsorbent for the adsorption of chromium from from binary aqueous solutions by composite
alginateβgoethite beads, Water Res. 39 (18)
industrial effluents such as electroplating industries.
(2005) 4385β4396.
14. S.Gueu, B.Yao, K.Adouby and G.AdoβHeavy
Acknowledgements Metals removal in aqueous solution by activated
BVD and AAJ are thankful to the Principal carbons prepared from coconut shell and seed
and management of Dr. AIT, Bangalore for shell of the palm treeβJournal of applied
encouragement and support. MNZA acknowledges Sciences 6(13); 2789-2793, 2003
the support rendered by the Principal and 15. Karuppanna Periaswamy and Chinnaiya
management of HKBK College of Engineering, Namasivayam--Process development for
removal and recovery of cadmium from waste
Bangalore.
water by a low cost adsorbent: Adsorption rates
from equilibrium studiesβInd. Eng. Res. 1994,
References 33, 317-320
1. D.E. Kimbrough, Y. Cohen, A.M. Winer, L. 16. Giles.C.H. and Nakhwa S.N.,--Studies in
Creelman, C.A. Mabuni, Critical assessment of Adsorption.XVI-The measurement of specific
chromium in the environment, Crit. Rev. surface areas of finely divided solids by solution
Environ. Sci. Technol. 29 (1) (1999) 1β46. adsorptionβJ.Appl. Chem.,12,June, 1962, 266-
2. J.W. Paterson, Wastewater Treatment 273.
Technology, Ann Arbour Science, Michigan, 17. Min Gyu Lee, Gyeougheam Yi, Byoung Joon
1975, pp. 43β58. Ahu and Felicity RoddickβConversion of Coal
3. S. Rengaraj, K.-H. Yeon, S.-H. Moon, Removal fly adh into zeolite and heavy metal removal
of chromium from water and wastewater by ion characteristics of the productsβKorean Journal
exchange resins, J. Hazard. Mater. 87 (1β3) of Chem. Engg.β17(3), 325-331 (2000).
(2001) 273β287. 18. Parinda Suksabye , Paitip Thiravetyan ,
4. S. Rengaraj, K.-H. Yeon, S.-Y. Kang, J.-U. Lee, Woranan Nakbanpote , Supanee Chayabutr--
K.-W. Kim, S.-H. Moon, Studies on adsorptive Chromium removal from electroplating
removal of Co(II), Cr(III) and Ni(II) by IRN77 wastewater by coir pithβonline publicationβ
cation-exchange resin, J. Hazard. Mater. 92 (2) Elsevier,doi 10.1010-2006.07.18
(2002) 185β198.
5. S. Rengaraj, C.K. Joo, Y. Kim, J. Yi, Kinetics of
removal of chromium from water and electronic
process wastewater by ion exchange resins:
370 | P a g e