Downloaded 48 times

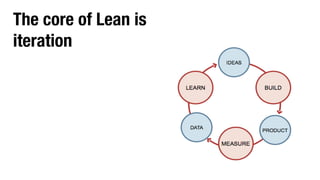

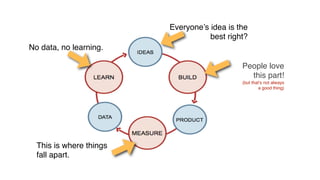
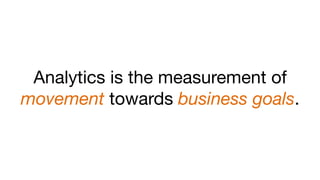

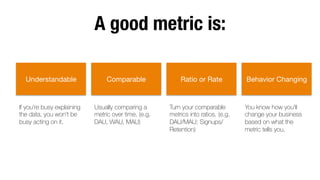
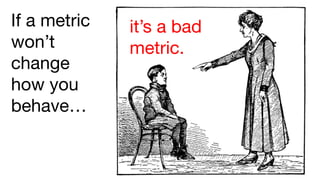

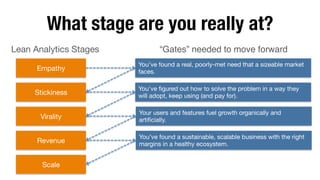
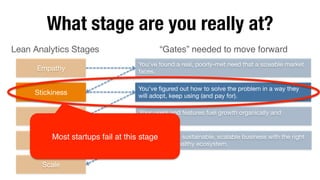


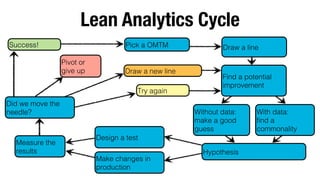


The document summarizes key concepts from the book "Lean Analytics" by Ben Yoskovitz. It discusses how analytics is the measurement of progress towards business goals and outlines important characteristics of good metrics like being understandable, comparable, and behavior changing. It also describes the lean analytics cycle of finding potential improvements, designing tests to validate hypotheses, measuring results, and iterating. Finally, it discusses different stages of business like empathy, stickiness, virality and revenue that companies need to progress through.
![[500DISTRO] Dissecting UX: Funnel Fixes & Other CRO Tips for Growth That Pays](https://cdn.slidesharecdn.com/ss_thumbnails/05neilpatelkiss-final-140806211641-phpapp01-thumbnail.jpg?width=640&height=640&fit=bounds)


![[CXL Live 16] From WTF to Hell Yes - How to Come Up With Copy That Persuades ...](https://cdn.slidesharecdn.com/ss_thumbnails/jenhavice-160404160628-thumbnail.jpg?width=640&height=640&fit=bounds)


![[#GHConf17] PPC Growth — 7 Hacks You Need to Test](https://cdn.slidesharecdn.com/ss_thumbnails/johnathandanefinal-170602224843-thumbnail.jpg?width=640&height=640&fit=bounds)


![[DSC Europe 25] Borko Kozomora - Optimizing business workflows with advances ...](https://cdn.slidesharecdn.com/ss_thumbnails/hbgekyb0txw0xpo4yfml-borko-kozomora-leading-ai-transformation-260122103838-cc29ee38-thumbnail.jpg?width=640&height=640&fit=bounds)

![[DSC Europe 25] Mikhail Rozhkov - AI Product Canvas: From Business Goals to T...](https://cdn.slidesharecdn.com/ss_thumbnails/d53doddtpgfqivmzqel6-mikhail-rozhkov-ai-product-canvas-v1-260121115910-9dd517a7-thumbnail.jpg?width=640&height=640&fit=bounds)


![[DSC Europe 25] Dubravko Culibrk - Deep Learning for Mammography.pptx](https://cdn.slidesharecdn.com/ss_thumbnails/yiscimuktacgqoiu4dkp-deep-learning-for-mammography-260119121559-aad59182-thumbnail.jpg?width=640&height=640&fit=bounds)
![[DSC Europe 25] Milovan Jovicic - Beyond AI's Reach: The Enduring Value of Ev...](https://cdn.slidesharecdn.com/ss_thumbnails/pyeij0hurgwq5jugmtnv-2-milovan-jovicic-beyond-ais-reach-the-enduring-value-of-evergreen-design-v2-260120105856-d6ee57e5-thumbnail.jpg?width=640&height=640&fit=bounds)


![[DSC Europe 25] Bojan Banjac - AI is always right when it comes to the matter...](https://cdn.slidesharecdn.com/ss_thumbnails/syoxtqierpydwxm5srcb-4-bojan-banjac-ai-is-always-right-when-it-comes-to-the-matters-of-taste-260119101519-694ee7d7-thumbnail.jpg?width=640&height=640&fit=bounds)
![[DSC Europe 25] Andrzej Kowalczyk - AI - how to start small and grow in the f...](https://cdn.slidesharecdn.com/ss_thumbnails/oy1zmo94qv6vpcqjvno2-andrzej-kowalczyk-ai-how-to-start-small-and-grow-in-the-future-1-260119121559-cf093b23-thumbnail.jpg?width=640&height=640&fit=bounds)

![[DSC Europe 25] Bojan Djuricic - Predictive Design Process.pdf](https://cdn.slidesharecdn.com/ss_thumbnails/5awdrbedqdek3gqu2ezy-4-the-predictive-design-bojan-djuricic-260120105856-6c399e9b-thumbnail.jpg?width=640&height=640&fit=bounds)


![[DSC Europe 25] Tamas Srancsik - How To Teach Your AI Football? An Argument f...](https://cdn.slidesharecdn.com/ss_thumbnails/bcjh1m9xtbosv20ucftb-tamas-srancsik-how-to-teach-your-ai-football-260121115910-08b53e9e-thumbnail.jpg?width=640&height=640&fit=bounds)
