AI for Data Analysis and
Visualization: Intelligent Tools for
Insight
Transforming Data into Actionable
Knowledge
Introduction - The Data Explosion
• We're drowning in data – volume, velocity, and variety are exploding.
Traditional analysis struggles to keep pace, often missing crucial insights.
• For too long, we've relied on manual methods to sift through growing
mountains of data. This often leads to slow, superficial analysis and missed
opportunities.AI-powered tools are emerging as the game-changer, offering
speed, depth, and automation to transform raw data into actionable
intelligence.
The
Limitations
of Traditional
Data
Analysis
• Untangling Complex Data Relationships
• Modern datasets often involve hundreds or
even thousands of variables. Identifying
intricate correlations and interactions
manually is incredibly difficult. Traditional
methods may miss non-linear relationships
and subtle dependencies.
• The Time Cost of Traditional Analysis
• Data collection, cleaning, and manual
analysis can be extremely time-consuming.
By the time insights are generated, they might
already be outdated. The need for faster, more
automated approaches to keep pace with
business needs.
• Mitigating Human Bias in Data
Interpretation
• Traditional analysis is susceptible to the
analyst's preconceived notions and biases.
Manual visualization choices can
unintentionally skew interpretations.
• Scaling Analysis with Growing Data
Sources
• Organizations are increasingly dealing with
data from diverse and evolving sources.
• Traditional tools often struggle to integrate
and analyze these disparate datasets
efficiently.
Artificial
Intelligence:
The
Intelligent
Assistant
• Artificial Intelligence enables machines to simulate
human intelligence—learning, reasoning, problem-
solving, and adapting.
• AI aims to create computer systems capable of tasks
that typically require human intelligence, such as
learning, reasoning, problem-solving, understanding
natural language, and perception. 1 In the realm of
data, AI provides the intellectual framework to
process, analyze, and extract valuable meaning from
raw information
AI’s Role in the Data-Driven World:
• Transforms vast data into smart decisions
• Uncovers hidden trends and insights
• Enhances speed, accuracy, and efficiency
• Automates complex tasks in real-time
The Synergy:
AI and Data
Analysis &
Visualization
• AI Supercharges Data Analysis:
Artificial Intelligence significantly elevates the
process of data analysis. It automates complex
and often time-intensive tasks, including data
preparation, feature selection, and the
identification of intricate patterns. AI algorithms
can uncover hidden correlations, subtle
relationships, and anomalies within datasets
that might escape traditional analytical
methods. Furthermore, AI empowers the
application of advanced analytical techniques
such as predictive modeling, time series
forecasting, and natural language processing,
enabling a more profound understanding of the
data's underlying story.
• AI Revolutionizes Data Visualization:
AI brings a transformative power to data visualization, moving beyond static charts to create
more engaging and informative experiences. Intelligent algorithms can analyze the
characteristics of the data and the specific analytical objectives to recommend the most
effective and insightful visualization types. Moreover, AI can automate the generation of textual
summaries and explanations that accompany the visuals, making complex insights more
accessible to a wider audience. The ability of AI to create dynamic and interactive visualizations
allows users to explore data more intuitively, leading to deeper personal understanding.
• The Outcome: Deeper and Faster Insights:
The powerful combination of AI's capabilities in both data analysis and visualization creates a
synergistic effect, leading to a more profound and accelerated path to actionable insights. This
integrated approach allows organizations to extract meaningful knowledge from their data more
efficiently and communicate these findings with greater clarity and impact. Ultimately, this
empowers more informed and timely data-driven decision-making across all levels of the
organization.
• Moving Beyond Description to Prediction and Action:
Traditional data analysis often focuses on describing historical events – understanding "what
happened." AI enables a crucial shift beyond this descriptive stage. By leveraging machine
learning and predictive modeling, we can gain insights into why certain outcomes occurred,
predict potential future trends and events with greater accuracy, and even prescribe optimal
actions and recommendations based on data-driven forecasts and analytical findings. This
moves us from simply understanding the past to shaping a better future.
AI for Data
Cleaning and
Preprocessing
• Laying the Foundation for Reliable Insights:
Data cleaning and preprocessing are crucial first steps in
any data analysis workflow. Raw data is often messy,
containing missing values, inconsistencies, errors, and
outliers, which can significantly impact the accuracy and
reliability of subsequent analysis and visualizations. AI-
powered tools are revolutionizing this stage by
automating and enhancing these critical tasks.
• Automated Identification and Handling of Missing
Values:
AI algorithms can intelligently identify patterns in missing
data and employ sophisticated techniques to handle
them. Instead of simple deletion or imputation with basic
statistics, AI can use machine learning models to predict
and impute missing values based on relationships with
other variables, leading to more accurate and less biased
datasets.
• Intelligent Detection and Correction of Inconsistencies and Errors:
AI can go beyond simple rule-based error detection. Machine learning models can
learn what "normal" data looks like and flag subtle inconsistencies or errors that
might be missed by manual inspection. For example, NLP techniques can identify
inconsistencies in text data, while statistical models can detect illogical
combinations of numerical values. AI can also suggest or automatically apply
corrections based on learned patterns.
• Automated Outlier Detection and Treatment:
Outliers, or data points that deviate significantly from the norm, can skew analysis
results. AI algorithms, such as anomaly detection models, can automatically
identify outliers based on statistical properties or learned patterns. Furthermore,
AI can assist in determining the appropriate treatment for outliers, whether it's
removal, transformation, or separate analysis, based on the context and the
underlying data distribution.
• AI-Powered Standardization and Normalization:
Many machine learning algorithms perform better when numerical data is
on a similar scale. AI can automate the process of standardization (scaling
data to have zero mean and unit variance) and normalization (scaling data
to a specific range, like 0 to 1). Intelligent algorithms can even select the
most appropriate scaling technique based on the data distribution and the
requirements of the subsequent analysis.
• Result: Higher Quality Data for Reliable Insights:
By automating and enhancing data cleaning and preprocessing, AI ensures
that the subsequent analysis and visualizations are based on high-quality,
reliable data. This leads to more accurate insights, better-informed
decisions, and a reduced risk of drawing incorrect conclusions due to data
quality issues.
Feature
Engineering
and
Selection
with AI
• Enhancing Data Representation:
AI plays a crucial role in transforming raw data into more
informative features that can significantly improve the
performance of analytical models. Feature engineering
involves creating new features from existing ones that better
capture the underlying patterns and relationships in the
data. AI algorithms can automate this process by identifying
potential combinations, transformations, and aggregations
of variables that might be relevant for the task at hand.
• Intelligent Feature Selection:
With a multitude of potential features, identifying the most
relevant ones is critical for building efficient and effective
models. Feature selection aims to choose a subset of the
original features that are most predictive or informative.
Machine learning models themselves can be used to assess
the importance of different features. Algorithms can rank
features based on their contribution to the model's
performance, allowing analysts to select the most impactful
variables and discard redundant or irrelevant ones.
• Reducing Dimensionality and Complexity: High-dimensional datasets (those
with a large number of features) can be challenging to analyze and model. AI-
powered dimensionality reduction techniques, such as Principal Component
Analysis (PCA) or t-distributed Stochastic Neighbor Embedding (t-SNE), can
reduce the number of features while preservingthe most important information.
This simplification can lead to more interpretable models and faster processing
times.
AI for
Anomaly and
Outlier
Detection
• AI, particularly through machine learning models,
provides powerful capabilities for automatically
detecting anomalies and outliers within datasets.
Anomalies are data points that deviate significantly
from the norm and can indicate errors, unusual
events, or critical issues.
• Machine Learning Models for Automated
Detection:
Various machine learning algorithms are employed
for anomaly detection:
• Statistical Methods: Distance-Based Methods:
• Density-Based Methods:
• Isolation Forest:
• One-Class Support Vector Machines (SVM):
• Autoencoders (Deep Learning):
Automated
Chart
Selection:
The Right
Visual for the
Right Data
• AI algorithms play a crucial role in automating the
often challenging task of selecting the most
appropriate chart type for a given dataset and
analytical objective. These algorithms analyze the
fundamental characteristics of the data, including its
type (e.g., numerical, categorical, temporal), the
relationships between different variables (e.g.,
correlation, distribution), and the specific analytical
goals (e.g., comparison, trend analysis, composition).
• This automated guidance ensures greater clarity in
data communication and helps users avoid selecting
chart types that could potentially misrepresent the
data or obscure key insights. By streamlining the chart
selection process, AI empowers users to quickly
create impactful and accurate visualizations,
ultimately leading to more effective data storytelling
and understanding.
Personalized
& Immersive
Visualizations
• Personalized and Adaptive Visualizations:
AI algorithms can learn individual user preferences, roles, and
information needs to deliver tailored visualizations. This
includes creating customized dashboards that highlight the
most relevant metrics and data views for each user. By
providing personalized experiences, AI enhances user
engagement, improves information consumption efficiency, and
empowers users to focus on the insights that matter most to
their specific responsibilities.
• Augmented Reality (AR) and Virtual Reality (VR) for Immersive
Data Experiences:
AI plays a crucial role in enabling the creation of immersive data
visualizations within augmented and virtual reality
environments. By leveraging AI, complex datasets, particularly
those with spatial components, can be represented in three
dimensions, allowing for more intuitive and comprehensive
understanding. Applications span various fields, including
architecture (visualizing building designs), engineering
(exploring product models), and scientific research (analyzing
molecular structures or geographical data). These immersive
experiences offer a deeper level of engagement and insight
through direct spatial interaction with the data.
AI data
visualization
tools
• AI data visualization tools are software
applications that combine artificial intelligence
with data visualization techniques to create
clear representations of complex data. These
tools go beyond traditional visualization
methods by integrating machine learning,
natural language processing (NLP), and
predictive analytics to uncover patterns,
generate actionable insights, and create
visuals.
• They don’t just show you the data—they help
you understand it. AI-powered tools help you
quickly identify patterns, spot anomalies, and
forecast future outcomes. They do all this while
saving you time and effort compared to slow
manual data analysis and design.
AI data visualization tool features
• AI data visualization tools are for everyone from analysts to
engineers to non-technical business leaders. Most provide an
intuitive user interface and AI-powered assistance to make it
easier for anyone to find meaning from data (and share those
insights).
AI data
visualiza
tion tool
features
Interactivity
Real-time analysis
Automated chart generation
Natural language queries
Data storytelling
Anomaly Detection
Benefits of AI tools for data visualization
Faster
decision-
making
Better
accuracy
Increased
efficiency
Actionable
insights
Accessibility
for all skill
levels
Improved
collaboration
Scalability
Desirable features while choosing an AI data
visualization tool
• Data integration capabilities
• Ease of Use
• Customization and flexibility
• Scalability and performance
• Security and compliance
Tableau
• Tableau is one of the most accessible, flexible data
tools—powerful enough for the most complex data
analytics but friendly enough that you won’t pull
your hair out using it.
• Its AI assistant, Ask Data, lets you type questions
like “Show me last month’s sales by region” and get
instant visualizations. While Tableau isn’t the
cheapest option out there, it’s become more
accessible to smaller teams, especially with its new
AI features that help you skip the manual data-
crunching and get straight to the insights.
Key features of Tableau
Speak data to
me
• Ask
questions in
plain English
and watch as
Tableau turns
your queries
into
visualizations
.
Smart
suggestions
that actually
help
• The AI looks at
your data and
recommends
the best ways
to show it (no
more guessing
which chart
type to use
Data
cleanup on
autopilot
• Automatically
spots and fixes
messy data so
you don’t have
to.
Team-
friendly
sharing:
• Collaborate in
real-time with
features that
make it easy to
share insights
across your
organization
Pattern
spotter
• Finds trends
and outliers
you might have
missed, even
in massive
datasets.
Microsoft
Power BI
• Power BI is the power drill with a
thousand attachments. Microsoft’s data
visualization is great at turning complex
business data into clear, actionable
insights. The AI capabilities baked into
Power BI (particularly its Smart Narratives
feature) save time by writing up key
findings from your charts automatically.
While it plays best with other Microsoft
tools, it’s flexible enough to work with just
about any data source you throw at it.
Key features of Microsoft Power BI
Natural
language
insights
• Handles
questions like
“What drove
our sales
increase?” and
gives plain-
English
explanations
alongside
visuals.
Smart data
prep
• Takes messy
data and
cleans it up
automatically,
figuring out
relationships
between tables
without you
lifting a finger.
AI-powered
trend
detection
• Spots patterns
and anomalies
in your data,
even
highlighting
seasonality
and key drivers
of change.
Quick
measures
• Creates
complex
calculations
with a few
clicks instead
of writing
complicated
formulas.
Automated
machine
learning
• Builds and
trains
predictive
models right in
your reports
without
needing a data
science
degree.
Google Looker
• Looker starts with your business
logic first. It’s impressive when
you’re dealing with real-time data,
and its AI features help you spot
trends the moment they emerge.
There’s a steeper learning curve
than some alternatives, but the
payoff in terms of depth and
flexibility is worth it.
Key features of google looker
AI-powered
exploration
• Type in what
you want to
know, and
Looker guides
you by
suggesting
relevant
visualizations
and metrics
along the way.
Smart data
modeling
• Automatically
understands
relationships
in your data
and suggests
the best ways
to structure it
for analysis.
Real-time
analytics
• Processes
and visualizes
live data
streams with
ease.
Predictive
insights
• Uses machine
learning to
forecast
trends and
help you make
data-driven
decisions
about what’s
coming next
Embedded
analytics
• Lets you build
AI-powered
dashboards
right into your
own
applications
(complete
with natural
language
querying).
Qlik Sense
• Qlik Sense is always looking for hidden connections and patterns
you might have missed. Its associative engine combines with AI
that actually learns how you explore data. While other tools might
show you what happened, Qlik Sense helps you understand why it
happened. It’s great at handling messy, real-world data without
requiring you to be a data cleaning expert first.
Key features of Qlik Sense
Insight Advisor
• Works like built-
in data
scientists to
automatically
generate
insights and
visualizations
based on your
data and
business
context
Associative
exploration
• Remembers
all the
relationships
in your data
and shows
you
connections
you might
have missed.
Natural
language
processing
• Lets you chat
with your data
in everyday
language and
gets smarter
the more your
team uses it.
Automated
analysis
• Digs through
your data to
find outliers,
clusters, and
correlations
without you
having to ask
specific
questions.
Augmented
intelligence
• Suggests next
steps in your
analysis
based on your
previous
explorations
and what’s
worked for
similar users.
Observable
• Observable is a modern, collaborative, and
innovative AI data visualization tool. It’s
built by the creators of D3.js and
revolutionizes how teams work with data by
making complex visualizations both
powerful and approachable. Its notebook-
style interface combines live code,
visualizations, and AI-powered analytics all
in one place. Think of it as Google Docs
meets data science.
Key features of Observable
AI-assisted
exploration
• Suggests
relevant
visualizations
and analyses
based on your
data structure
and past
exploration
patterns.
Live
collaboration
• Multiple team
members can
work on the
same
visualization in
real-time.
Smart
templates
• Starts you off
with intelligent
visualization
suggestions
based on your
data type and
goals
Interactive
storytelling
• Creates
dynamic,
narrative-driven
dashboards that
adapt to user
interactions and
questions.
Code
intelligence
• Helps you write
better
visualization
code with AI-
powered
suggestions and
automatic error
detection.
ThoughtSpot
• ThoughtSpot pioneered the search-first
approach to data analysis—just type what
you want to know, and it does the heavy
lifting. It learns from every question asked
across your organization, getting smarter
over time. While it’s not the cheapest
option out there, it’s a great fit for teams
that want to democratize data access
without sacrificing depth of analysis.
Key features of ThoughtSpot
SpotIQ
analytics
• Takes your
initial question
and
automatically
explores
thousands of
related facts to
surface hidden
insights you
hadn’t even
thought to look
for.
Natural
language
search
• Understands
complex
questions
about your data
and translates
them into
visualizations
in seconds (no
code required).
Automated
insights
generation
• Creates written
explanations of
your data
findings.
AI-driven
recommendati
ons
• Learns from
how your team
explores data
and suggests
relevant
analyses based
on past
patterns.
Smart data
modeling
• Automatically
maps
relationships
between
different data
sources.
Zoho Analytics
• Zoho Analytics isn’t trying to be the
fanciest tool in the shed, but it
delivers where it counts—especially
for small to mid-sized businesses
watching their budget. What makes it
stand out is how it combines AI
smarts with an affordable price tag.
Its AI assistant, Zia, is capable at
understanding what you’re looking
for, even if you’re not sure how to ask
for it.
Key features of Zoho Analytics
Zia AI insights
• Acts like your
personal data
analyst,
answering
questions and
spotting trends
you might have
missed in your
data.
Smart data
blending
• Combines
information
from different
sources
without
requiring you to
be a database
expert.
Automated
report
scheduling
• Sets up regular
reports that
update
themselves and
notify the right
people at the
right time.
Predictive
analytics
• Makes
educated
guesses about
future trends
based on your
historical data.
Collaborative
intelligence
• Learns from
how different
team members
interact with
data to make
better
suggestions
over time.

AI for Data Analysis and Visualization.pdf

  • 1.
    AI for DataAnalysis and Visualization: Intelligent Tools for Insight Transforming Data into Actionable Knowledge
  • 2.
    Introduction - TheData Explosion • We're drowning in data – volume, velocity, and variety are exploding. Traditional analysis struggles to keep pace, often missing crucial insights. • For too long, we've relied on manual methods to sift through growing mountains of data. This often leads to slow, superficial analysis and missed opportunities.AI-powered tools are emerging as the game-changer, offering speed, depth, and automation to transform raw data into actionable intelligence.
  • 3.
    The Limitations of Traditional Data Analysis • UntanglingComplex Data Relationships • Modern datasets often involve hundreds or even thousands of variables. Identifying intricate correlations and interactions manually is incredibly difficult. Traditional methods may miss non-linear relationships and subtle dependencies. • The Time Cost of Traditional Analysis • Data collection, cleaning, and manual analysis can be extremely time-consuming. By the time insights are generated, they might already be outdated. The need for faster, more automated approaches to keep pace with business needs.
  • 4.
    • Mitigating HumanBias in Data Interpretation • Traditional analysis is susceptible to the analyst's preconceived notions and biases. Manual visualization choices can unintentionally skew interpretations. • Scaling Analysis with Growing Data Sources • Organizations are increasingly dealing with data from diverse and evolving sources. • Traditional tools often struggle to integrate and analyze these disparate datasets efficiently.
  • 5.
    Artificial Intelligence: The Intelligent Assistant • Artificial Intelligenceenables machines to simulate human intelligence—learning, reasoning, problem- solving, and adapting. • AI aims to create computer systems capable of tasks that typically require human intelligence, such as learning, reasoning, problem-solving, understanding natural language, and perception. 1 In the realm of data, AI provides the intellectual framework to process, analyze, and extract valuable meaning from raw information AI’s Role in the Data-Driven World: • Transforms vast data into smart decisions • Uncovers hidden trends and insights • Enhances speed, accuracy, and efficiency • Automates complex tasks in real-time
  • 6.
    The Synergy: AI andData Analysis & Visualization • AI Supercharges Data Analysis: Artificial Intelligence significantly elevates the process of data analysis. It automates complex and often time-intensive tasks, including data preparation, feature selection, and the identification of intricate patterns. AI algorithms can uncover hidden correlations, subtle relationships, and anomalies within datasets that might escape traditional analytical methods. Furthermore, AI empowers the application of advanced analytical techniques such as predictive modeling, time series forecasting, and natural language processing, enabling a more profound understanding of the data's underlying story.
  • 7.
    • AI RevolutionizesData Visualization: AI brings a transformative power to data visualization, moving beyond static charts to create more engaging and informative experiences. Intelligent algorithms can analyze the characteristics of the data and the specific analytical objectives to recommend the most effective and insightful visualization types. Moreover, AI can automate the generation of textual summaries and explanations that accompany the visuals, making complex insights more accessible to a wider audience. The ability of AI to create dynamic and interactive visualizations allows users to explore data more intuitively, leading to deeper personal understanding. • The Outcome: Deeper and Faster Insights: The powerful combination of AI's capabilities in both data analysis and visualization creates a synergistic effect, leading to a more profound and accelerated path to actionable insights. This integrated approach allows organizations to extract meaningful knowledge from their data more efficiently and communicate these findings with greater clarity and impact. Ultimately, this empowers more informed and timely data-driven decision-making across all levels of the organization. • Moving Beyond Description to Prediction and Action: Traditional data analysis often focuses on describing historical events – understanding "what happened." AI enables a crucial shift beyond this descriptive stage. By leveraging machine learning and predictive modeling, we can gain insights into why certain outcomes occurred, predict potential future trends and events with greater accuracy, and even prescribe optimal actions and recommendations based on data-driven forecasts and analytical findings. This moves us from simply understanding the past to shaping a better future.
  • 8.
    AI for Data Cleaningand Preprocessing • Laying the Foundation for Reliable Insights: Data cleaning and preprocessing are crucial first steps in any data analysis workflow. Raw data is often messy, containing missing values, inconsistencies, errors, and outliers, which can significantly impact the accuracy and reliability of subsequent analysis and visualizations. AI- powered tools are revolutionizing this stage by automating and enhancing these critical tasks. • Automated Identification and Handling of Missing Values: AI algorithms can intelligently identify patterns in missing data and employ sophisticated techniques to handle them. Instead of simple deletion or imputation with basic statistics, AI can use machine learning models to predict and impute missing values based on relationships with other variables, leading to more accurate and less biased datasets.
  • 9.
    • Intelligent Detectionand Correction of Inconsistencies and Errors: AI can go beyond simple rule-based error detection. Machine learning models can learn what "normal" data looks like and flag subtle inconsistencies or errors that might be missed by manual inspection. For example, NLP techniques can identify inconsistencies in text data, while statistical models can detect illogical combinations of numerical values. AI can also suggest or automatically apply corrections based on learned patterns. • Automated Outlier Detection and Treatment: Outliers, or data points that deviate significantly from the norm, can skew analysis results. AI algorithms, such as anomaly detection models, can automatically identify outliers based on statistical properties or learned patterns. Furthermore, AI can assist in determining the appropriate treatment for outliers, whether it's removal, transformation, or separate analysis, based on the context and the underlying data distribution.
  • 10.
    • AI-Powered Standardizationand Normalization: Many machine learning algorithms perform better when numerical data is on a similar scale. AI can automate the process of standardization (scaling data to have zero mean and unit variance) and normalization (scaling data to a specific range, like 0 to 1). Intelligent algorithms can even select the most appropriate scaling technique based on the data distribution and the requirements of the subsequent analysis. • Result: Higher Quality Data for Reliable Insights: By automating and enhancing data cleaning and preprocessing, AI ensures that the subsequent analysis and visualizations are based on high-quality, reliable data. This leads to more accurate insights, better-informed decisions, and a reduced risk of drawing incorrect conclusions due to data quality issues.
  • 11.
    Feature Engineering and Selection with AI • EnhancingData Representation: AI plays a crucial role in transforming raw data into more informative features that can significantly improve the performance of analytical models. Feature engineering involves creating new features from existing ones that better capture the underlying patterns and relationships in the data. AI algorithms can automate this process by identifying potential combinations, transformations, and aggregations of variables that might be relevant for the task at hand. • Intelligent Feature Selection: With a multitude of potential features, identifying the most relevant ones is critical for building efficient and effective models. Feature selection aims to choose a subset of the original features that are most predictive or informative. Machine learning models themselves can be used to assess the importance of different features. Algorithms can rank features based on their contribution to the model's performance, allowing analysts to select the most impactful variables and discard redundant or irrelevant ones.
  • 12.
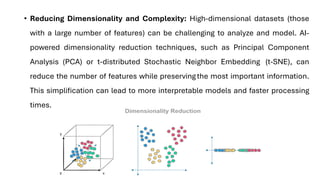
    • Reducing Dimensionalityand Complexity: High-dimensional datasets (those with a large number of features) can be challenging to analyze and model. AI- powered dimensionality reduction techniques, such as Principal Component Analysis (PCA) or t-distributed Stochastic Neighbor Embedding (t-SNE), can reduce the number of features while preservingthe most important information. This simplification can lead to more interpretable models and faster processing times.
  • 13.
    AI for Anomaly and Outlier Detection 
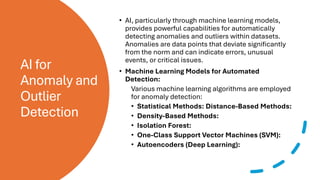
•AI, particularly through machine learning models, provides powerful capabilities for automatically detecting anomalies and outliers within datasets. Anomalies are data points that deviate significantly from the norm and can indicate errors, unusual events, or critical issues. • Machine Learning Models for Automated Detection: Various machine learning algorithms are employed for anomaly detection: • Statistical Methods: Distance-Based Methods: • Density-Based Methods: • Isolation Forest: • One-Class Support Vector Machines (SVM): • Autoencoders (Deep Learning):
  • 14.
    Automated Chart Selection: The Right Visual forthe Right Data • AI algorithms play a crucial role in automating the often challenging task of selecting the most appropriate chart type for a given dataset and analytical objective. These algorithms analyze the fundamental characteristics of the data, including its type (e.g., numerical, categorical, temporal), the relationships between different variables (e.g., correlation, distribution), and the specific analytical goals (e.g., comparison, trend analysis, composition). • This automated guidance ensures greater clarity in data communication and helps users avoid selecting chart types that could potentially misrepresent the data or obscure key insights. By streamlining the chart selection process, AI empowers users to quickly create impactful and accurate visualizations, ultimately leading to more effective data storytelling and understanding.
  • 15.
    Personalized & Immersive Visualizations • Personalizedand Adaptive Visualizations: AI algorithms can learn individual user preferences, roles, and information needs to deliver tailored visualizations. This includes creating customized dashboards that highlight the most relevant metrics and data views for each user. By providing personalized experiences, AI enhances user engagement, improves information consumption efficiency, and empowers users to focus on the insights that matter most to their specific responsibilities. • Augmented Reality (AR) and Virtual Reality (VR) for Immersive Data Experiences: AI plays a crucial role in enabling the creation of immersive data visualizations within augmented and virtual reality environments. By leveraging AI, complex datasets, particularly those with spatial components, can be represented in three dimensions, allowing for more intuitive and comprehensive understanding. Applications span various fields, including architecture (visualizing building designs), engineering (exploring product models), and scientific research (analyzing molecular structures or geographical data). These immersive experiences offer a deeper level of engagement and insight through direct spatial interaction with the data.
  • 16.
    AI data visualization tools • AIdata visualization tools are software applications that combine artificial intelligence with data visualization techniques to create clear representations of complex data. These tools go beyond traditional visualization methods by integrating machine learning, natural language processing (NLP), and predictive analytics to uncover patterns, generate actionable insights, and create visuals. • They don’t just show you the data—they help you understand it. AI-powered tools help you quickly identify patterns, spot anomalies, and forecast future outcomes. They do all this while saving you time and effort compared to slow manual data analysis and design.
  • 17.
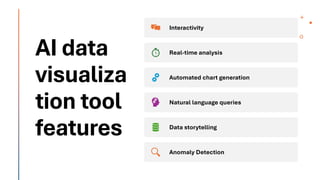
    AI data visualizationtool features • AI data visualization tools are for everyone from analysts to engineers to non-technical business leaders. Most provide an intuitive user interface and AI-powered assistance to make it easier for anyone to find meaning from data (and share those insights).
  • 18.
    AI data visualiza tion tool features Interactivity Real-timeanalysis Automated chart generation Natural language queries Data storytelling Anomaly Detection
  • 19.
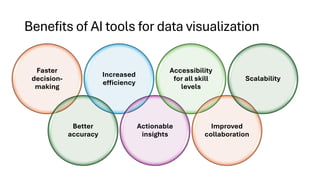
    Benefits of AItools for data visualization Faster decision- making Better accuracy Increased efficiency Actionable insights Accessibility for all skill levels Improved collaboration Scalability
  • 20.
    Desirable features whilechoosing an AI data visualization tool • Data integration capabilities • Ease of Use • Customization and flexibility • Scalability and performance • Security and compliance
  • 21.
    Tableau • Tableau isone of the most accessible, flexible data tools—powerful enough for the most complex data analytics but friendly enough that you won’t pull your hair out using it. • Its AI assistant, Ask Data, lets you type questions like “Show me last month’s sales by region” and get instant visualizations. While Tableau isn’t the cheapest option out there, it’s become more accessible to smaller teams, especially with its new AI features that help you skip the manual data- crunching and get straight to the insights.
  • 22.
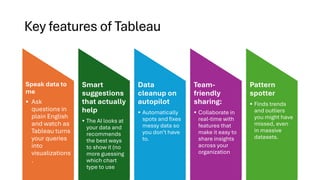
    Key features ofTableau Speak data to me • Ask questions in plain English and watch as Tableau turns your queries into visualizations . Smart suggestions that actually help • The AI looks at your data and recommends the best ways to show it (no more guessing which chart type to use Data cleanup on autopilot • Automatically spots and fixes messy data so you don’t have to. Team- friendly sharing: • Collaborate in real-time with features that make it easy to share insights across your organization Pattern spotter • Finds trends and outliers you might have missed, even in massive datasets.
  • 23.
    Microsoft Power BI • PowerBI is the power drill with a thousand attachments. Microsoft’s data visualization is great at turning complex business data into clear, actionable insights. The AI capabilities baked into Power BI (particularly its Smart Narratives feature) save time by writing up key findings from your charts automatically. While it plays best with other Microsoft tools, it’s flexible enough to work with just about any data source you throw at it.
  • 24.
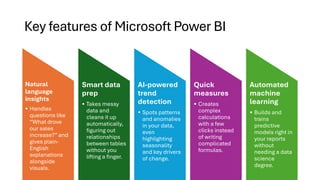
    Key features ofMicrosoft Power BI Natural language insights • Handles questions like “What drove our sales increase?” and gives plain- English explanations alongside visuals. Smart data prep • Takes messy data and cleans it up automatically, figuring out relationships between tables without you lifting a finger. AI-powered trend detection • Spots patterns and anomalies in your data, even highlighting seasonality and key drivers of change. Quick measures • Creates complex calculations with a few clicks instead of writing complicated formulas. Automated machine learning • Builds and trains predictive models right in your reports without needing a data science degree.
  • 25.
    Google Looker • Lookerstarts with your business logic first. It’s impressive when you’re dealing with real-time data, and its AI features help you spot trends the moment they emerge. There’s a steeper learning curve than some alternatives, but the payoff in terms of depth and flexibility is worth it.
  • 26.
    Key features ofgoogle looker
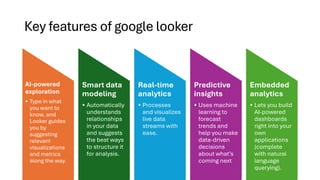
 AI-powered exploration • Type in what you want to know, and Looker guides you by suggesting relevant visualizations and metrics along the way. Smart data modeling • Automatically understands relationships in your data and suggests the best ways to structure it for analysis. Real-time analytics • Processes and visualizes live data streams with ease. Predictive insights • Uses machine learning to forecast trends and help you make data-driven decisions about what’s coming next Embedded analytics • Lets you build AI-powered dashboards right into your own applications (complete with natural language querying).
  • 27.
    Qlik Sense • QlikSense is always looking for hidden connections and patterns you might have missed. Its associative engine combines with AI that actually learns how you explore data. While other tools might show you what happened, Qlik Sense helps you understand why it happened. It’s great at handling messy, real-world data without requiring you to be a data cleaning expert first.
  • 28.
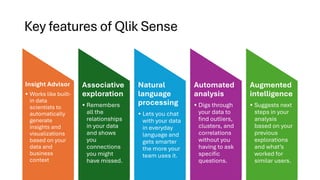
    Key features ofQlik Sense Insight Advisor • Works like built- in data scientists to automatically generate insights and visualizations based on your data and business context Associative exploration • Remembers all the relationships in your data and shows you connections you might have missed. Natural language processing • Lets you chat with your data in everyday language and gets smarter the more your team uses it. Automated analysis • Digs through your data to find outliers, clusters, and correlations without you having to ask specific questions. Augmented intelligence • Suggests next steps in your analysis based on your previous explorations and what’s worked for similar users.
  • 29.
    Observable • Observable isa modern, collaborative, and innovative AI data visualization tool. It’s built by the creators of D3.js and revolutionizes how teams work with data by making complex visualizations both powerful and approachable. Its notebook- style interface combines live code, visualizations, and AI-powered analytics all in one place. Think of it as Google Docs meets data science.
  • 30.
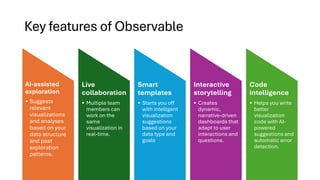
    Key features ofObservable AI-assisted exploration • Suggests relevant visualizations and analyses based on your data structure and past exploration patterns. Live collaboration • Multiple team members can work on the same visualization in real-time. Smart templates • Starts you off with intelligent visualization suggestions based on your data type and goals Interactive storytelling • Creates dynamic, narrative-driven dashboards that adapt to user interactions and questions. Code intelligence • Helps you write better visualization code with AI- powered suggestions and automatic error detection.
  • 31.
    ThoughtSpot • ThoughtSpot pioneeredthe search-first approach to data analysis—just type what you want to know, and it does the heavy lifting. It learns from every question asked across your organization, getting smarter over time. While it’s not the cheapest option out there, it’s a great fit for teams that want to democratize data access without sacrificing depth of analysis.
  • 32.
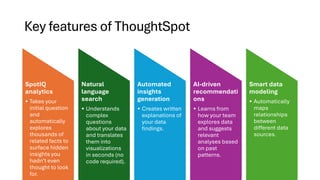
    Key features ofThoughtSpot SpotIQ analytics • Takes your initial question and automatically explores thousands of related facts to surface hidden insights you hadn’t even thought to look for. Natural language search • Understands complex questions about your data and translates them into visualizations in seconds (no code required). Automated insights generation • Creates written explanations of your data findings. AI-driven recommendati ons • Learns from how your team explores data and suggests relevant analyses based on past patterns. Smart data modeling • Automatically maps relationships between different data sources.
  • 33.
    Zoho Analytics • ZohoAnalytics isn’t trying to be the fanciest tool in the shed, but it delivers where it counts—especially for small to mid-sized businesses watching their budget. What makes it stand out is how it combines AI smarts with an affordable price tag. Its AI assistant, Zia, is capable at understanding what you’re looking for, even if you’re not sure how to ask for it.
  • 34.
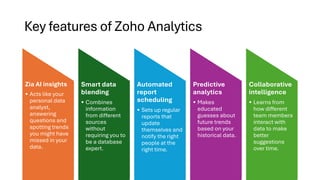
    Key features ofZoho Analytics Zia AI insights • Acts like your personal data analyst, answering questions and spotting trends you might have missed in your data. Smart data blending • Combines information from different sources without requiring you to be a database expert. Automated report scheduling • Sets up regular reports that update themselves and notify the right people at the right time. Predictive analytics • Makes educated guesses about future trends based on your historical data. Collaborative intelligence • Learns from how different team members interact with data to make better suggestions over time.