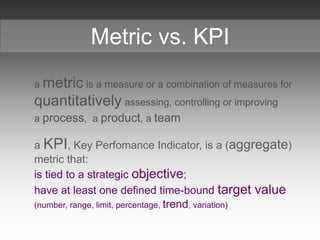
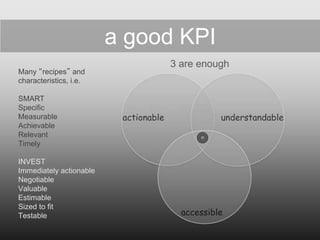
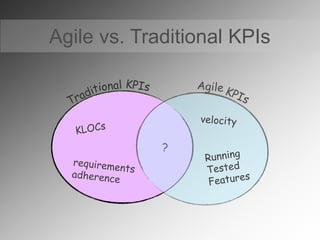
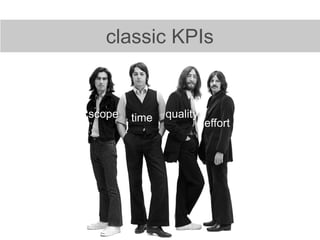
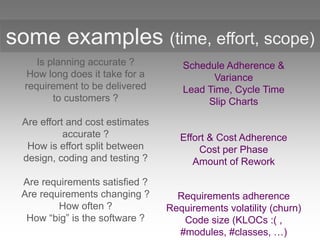
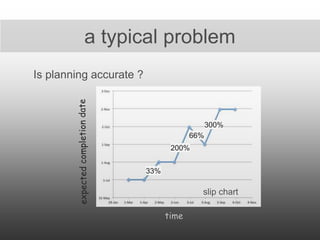
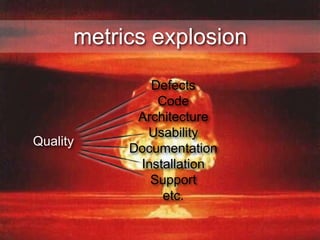
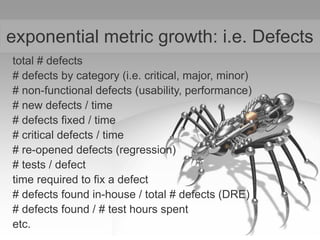
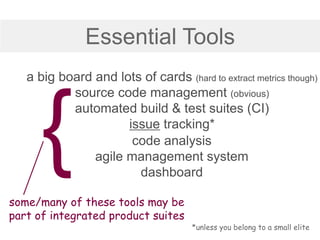
This document discusses key performance indicators (KPIs) for measuring agile projects. It begins by defining metrics and KPIs, noting that KPIs should be tied to strategic objectives and have defined targets. It then discusses characteristics of good KPIs and provides examples of both traditional and agile KPIs related to time, effort, scope, and quality. The document cautions that too many KPIs can be useless and advocates keeping metrics simple. It also discusses challenges like cheating on metrics and provides tips for using tools and dashboards to effectively measure agile performance.
XBOSoft runs through the Top 10 Agile Metrics revealing the most fundamental data points Agile methodology requires to work effectively, and will put you on the highly targeted path to successful implementation of your Agile processes.
XBOSoft and Go2Group run through the top data points you should be measuring in your Agile Workflow. We’ll show you what to track, when and how often, and most importantly – why. Many believe that metrics are useless, but unless you measure, how can you systematically improve or know how you are doing? And with velocity as an overarching objective in agile, you should be tracking other things so that you know what else you could be impacting by going faster. But, with all the metrics so readily available to us today, how do we filter through to the most meaningful?
Seven Key Metrics to Improve Agile PerformanceTechWell
It’s been said: If you can’t measure it, you can’t improve it. For most agile teams burndown charts and some type of velocity measurement are all they are doing. However, with just a few more metrics, you can gain substantial insight into how teams are performing and identify improvement opportunities. Andrew Graves explores seven key metrics―Effort by Class of Service, Accuracy of Estimation, Cost per Point, and four others―to measure how your team is doing and make adjustments in real time. Andrew illustrates how to use these metrics to communicate progress to stakeholders. Discover how to use these metrics to identify and analyze trends that lead to performance improvement ideas and strategies. Learn how to use these seven metrics to monitor the impact of changes made to verify they are bringing the hoped-for difference.
Agile metrics: Measure and Improve:
Mattia Battiston (SKY) and David Leach (Reed Online) share their expert views on velocity, agile ROI, reporting and measuring impact.
Sponsored by Wemanity - www.wemanity.com - the agile driving force
We are doing Agile well..We have been Agile now.. Is it just an assumption or do we have data to support it? Do metrics add any value or they are just a fad? Good metrics affirm & reinforce Agile principles. They open up the conversation and help the teams to improve. They are not only for management, it is for everyone who wants to inspect and adapt.
So this presentation is about how metrics can be used effectively in Agile to enable transparency and improve the overall efficiency at the team/ program and portfolio level.
Having reviewed a number of Agile adoption approaches by big consulting companies given to organizations within the Kingdom, it's clear that many of them don't have the appropriate backgrounds to perform Agile transformations.
This session will discuss the Agile transformation adoption roadmap from real practitioners with numerous Agile adoptions in Saudi Arabia.
We will discuss what to try, what not to avoid, and some general things to consider.
Presenter:
Dr. Gail Ferreira, Agile Practice Leader, MATRIX Resources, San Francisco Center of Excellence
Rapid scale directly impacts all levels of decision-making, planning, execution, culture, and communications for executives in hypergrowth companies. In this session, we will discuss how to organize, support, and tailor agile practices for teams and sub-teams in companies with a rapid growth cycle. We will share contemporary case studies of hypergrowth companies who have delivered agile at scale.
Topics will include:
• Basic agile and lean methods
• Scrum of Scrums
• SAFe
• Disciplined Agile Delivery (DAD)
• Agility at Scale (Ambler/Lines)
• Spotify model (Tribes, Squads, Chapters & Guilds, DSDM).
Have you tried assessing the maturity of your Agile teams? Have you developed your own unique approach or adopted an approach found online? Have you found the assessments valuable and continued them?
This material introduces a very simple, straightforward approach for Agile and Scrum maturity assessments without the complexity and pitfalls of numerous more sophisticated approaches.
The author has used five different approaches to assess Agile maturity over the past decade, three developed by Agile coaching staff and two developed by himself, before adopting this simpler retrospective Agile maturity assessment.
Shared at Agile New England as an Agile 101 topic in June 2023.
Agile Metrics : A seminal approach for calculating Metrics in Agile ProjectsPrashant Ram
A seminal approach for calculating Metrics in Agile Projects. Overview, Analysis and Detailed Description of a proposed set of comprehensive metrics for Agile Projects.
Keynote: Testing and Quality in the Scaled Agile Framework for Lean Enterpris...Derk-Jan de Grood
Scaled Agile Framework for Lean Enterprises (SAFe) is the most popular framework used by large programs and companies to achieve business agility. It challenges how testers, Q&A and test managers, and test specialists work together with the entire organisation. Derk-Jan de Grood and Mette Bruhn-Pedersen explain how test professionals can contribute with their knowledge and expertise in a SAFe organisation.
Scaled Agile Framework for Lean Enterprises (SAFe) is becoming the most popular framework used to help large programs and entire companies achieve business agility. It builds on well-known agile-lean principles and methodologies, and puts them together to address challenges not only on team level, but also on program, large solution and portfolio level. Although the framework is described in more details than other comparable frameworks it is not very elaborate on how testing and quality practices fit in. This raises new challenges for testers, Q&A and test managers, test architects, test specialists and people in similar roles together with the entire organisation. Derk-Jan de Grood and Mette Bruhn-Pedersen describe what guidance SAFe actually provides and suggest additional ways test and QA professionals can contribute with their special knowledge and expertise.
The presentation is based on the authors’ experience and an expert session at the 22nd Testing Retreat (2017, Hereford UK). The Testing Retreat is a peer-conference where leaders in the testing and quality profession share their experiences and insights. The participants discussed quality measures and actions that test professionals can take to ensure quality when using SAFe throughout the Software Development Lifecycle (SDLC). We thank all for their valuable contributions.
A. Kamran's DoD and DoR: Definition of Done and Definition of Ready in ScrumArman Kamran
Definition of what constitutes as a "Ready" PBI (Product Backlog Item) for the Development team to pull into a Sprint, and what makes that PBI considered as "Done" for the Product Owner to review and accept or reject, is a vital factor in building and maintaining a functional and ever improving relationship between PO and the Dev Team.
Here he look at best practices in doing so!
This presentation includes an overview of the various estimation techniques used in Agile projects. I've also put in a slide for explaining the importance of business value for Agile requirements. A simple mechanism on capacity planning before weaving it all together to come up with a reasonably foolproof plan.
This slides-share describes best practices to implement Jira in software development organizations who practice Agile.
The focus is on simple implementation based on Jira core and portfolio to achieve high ROI
This presentation introduces agile methodology, talks about scrum and the pros and cons of agile from a various perspectives. It also talks about cost of an agile project
This slide gives an excellent overview of Agile Planning and Estimation.
Will be really helpful, if presented to a Scrum/Agile Team to understand activities related to Release Planning, Sprint Planning and Estimation
AgileLIVE Webinar: Measuring the Success of Your Agile Transformation - Part 2VersionOne
The key to a successful agile journey is to identify concrete, measurable goals. Whether your challenge is to improve software quality, time to market, productivity, customer satisfaction, innovation, employee engagement, or some combination of these, agile metrics are crucial to your success. How do you use agile metrics early and often to know that you’re going in the right direction? And how do you know when your goals have been met? This set of slides shows you how to do it using VersionOne. Watch the recording here: http://bit.ly/1m1nXEl
The 3 Revolutions (Agile, Lean, Lean Startup)Claudio Perrone
This is the (long overdue) translation of my opening keynote at the Italian Agile Day. I just presented it for IASA Ireland (International Association Software Architects).
The a3thinker.com iphone/ipad app I mentioned (on Lean problem solving, 5 Whys, etc) went on sale on the Apple store on Mar 18. The A3 Thinker's Action Deck (physical cards) is going to be on sale shortly...and it is just awesome ;-)
Pin the tail on the metric v00 75 min versionSteven Martin
This presentation shows a different approach to metrics. Instead of listing the Top 10 field-tested metrics, we first talk about goals as prerequisites for metrics. Next, we discuss characteristics of good and bad metrics. We end with walking through an activity called “Pin the Tail on the Metric,” a technique to facilitate the critical thinking needed to determine what types of metrics can help your organization discuss trade-offs, options, and ultimately make better forward-looking decisions.
Pin the tail on the metric v01 2016 octSteven Martin
This presentation takes a different approach to metrics. Instead of listing the Top 10 field-tested metrics, we first talk about goals as prerequisites for metrics. Next, we discuss characteristics of good and bad metrics. We end with walking through an activity called “Pin the Tail on the Metric,” a technique to facilitate the critical thinking needed to determine what types of metrics can help your organization discuss trade-offs, options, and ultimately make better forward-looking decisions.
Team Foundation Server - Tracking & ReportingSteve Lange
Comprehensive presentation detailing reporting and tracking capabilities of Team Foundation Server. Focuses on Excel workbooks and Reporting Services, but touches on other technologies as well.
Isabel Evans - Working Ourselves out of a Job: A Passion For Improvement - Eu...TEST Huddle
EuroSTAR Software Testing Conference 2010 presentation on Working Ourselves out of a Job: A Passion For Improvement by Isabel Evans.
See more at: http://conference.eurostarsoftwaretesting.com/past-presentations/
AEM Maxed = Agile + Automation.
Time Warner Cable and iCiDIGITAL reveal how a stellar agile development team delivers an award-winning website using Adobe Experience Manager. Highlights include team interactions, scaling the team, collaborative moments, testing automation, and continuous integration. Also, they will share previews of a few open source attractions that will accelerate your Adobe Experience Manager delivery.
Case Study: Time Warner Cable's Formula for Maximizing Adobe Experience Manager Mark Kelley
Time Warner Cable and iCiDIGITAL reveal how a stellar agile development team delivers an award-winning website using Adobe Experience Manager. Highlights include team interactions, scaling the team, collaborative moments, testing automation, and continuous integration. Also, they share previews of a few open source attractions that will accelerate your Adobe Experience Manager delivery.
PROJECT STORYBOARD: Reducing Software Bug Fix Lead Time From 25 to 15 daysGoLeanSixSigma.com
GoLeanSixSigma.com Green Belt Eduardo Torres did a great job of cutting waste out of the process of fixing software bugs. The use of software is growing fast, and with no known way to guarantee new software is error-free, rapidly fixing bugs found is critical. Eduardo not only cut nearly 40% of the process time, but also cut the variability in half, greatly improving reliability!
– Susan Tighe, GoLeanSixSigma.com Master Black Belt
Coach
---
Eduardo Torres is a Senior Project Manager and Lean Six Sigma Green Belt with expertise in the Telecommunications Field. For his Green Belt Project, he decided to tackle the long lead time for software bug fixes – reducing the total lead time from 25 to 15 days!
Measure what matters for your agile projectMunish Malik
While working with Agile projects, we simply can't get away from tracking and showcasing the progress of the project. A typical Agile project would be working with estimates, story points, velocities, burn-up or burn-down charts.
I have witnessed numerous sprint reviews and showcases where the business is only waiting to see those few slides of the presentation where there is the "actual" red worm, running against the "planned" green worm, trying to catch-up. If the red worm is ahead, I have seen a smile on the faces of the stakeholders. If it matches the green one, there is a sigh of relief. And as a development team you should just pray that the poor red guy is not falling behind the green one, lest it might lead to a lot of questions starting with why, how, what etc.
There have also been times where there have been some unfortunate heated discussions that last forever on why did the team end up not claiming a few points that they had committed. What gets lost is what the team accomplished in the sprint that adds good value to the product. There have also been times where the estimates are being questioned by the product owner or account managers. If you are working in a distributed setup where the product owner is working out of a different country, the problem is even bigger.
Let us think about a scenario where the project gets completed on time, budget and scope. Majority (or all) of estimates were correct. However, when the product went live to the market it failed big time. What is the use of building such a product?
Are we focusing too much on numbers and points and overlooking the other important aspects of Agile software development such as producing software that delights the customers and looking for ways on how we can measure that? Are we measuring if we are creating a solid, robust and a scalable platform that is ready for future developments and enhancements? Are we measuring the outcomes of the time we are spending in the shoes of the people who will actually use the software?
The objective of this presentation is to promote the thinking of measuring what matters for your project. To measure the goals that your software development wants to achieve. I don't plan to showcase an exhaustive list of measurements that can solve all your problems, however, I instead want to highlight some samples that I have used in my projects with the help of my team, that helped us to measure things that add value to the business and development v/S simply creating burn down charts.
Majorly, I want to encourage thinking out of the box to identify what measurements will really matter for your projects. Perhaps from the eyes of the users and business and see what things if measured will add a lot more value than simply estimates, and will help in creating a valuable product that will truly delight the business and the users of the product.
Pre Mortem Retrospectives are a powerful way to prevent project failures before they occur.
Resting on the standard Agile Retrospective format you flash-forward to a date after the scheduled release date and assume that the project has failed miserably
Slack (or Teams) Automation for Bonterra Impact Management (fka Social Soluti...Jeffrey Haguewood
Sidekick Solutions uses Bonterra Impact Management (fka Social Solutions Apricot) and automation solutions to integrate data for business workflows.
We believe integration and automation are essential to user experience and the promise of efficient work through technology. Automation is the critical ingredient to realizing that full vision. We develop integration products and services for Bonterra Case Management software to support the deployment of automations for a variety of use cases.
This video focuses on the notifications, alerts, and approval requests using Slack for Bonterra Impact Management. The solutions covered in this webinar can also be deployed for Microsoft Teams.
Interested in deploying notification automations for Bonterra Impact Management? Contact us at sales@sidekicksolutionsllc.com to discuss next steps.
Essentials of Automations: Optimizing FME Workflows with ParametersSafe Software
Are you looking to streamline your workflows and boost your projects’ efficiency? Do you find yourself searching for ways to add flexibility and control over your FME workflows? If so, you’re in the right place.
Join us for an insightful dive into the world of FME parameters, a critical element in optimizing workflow efficiency. This webinar marks the beginning of our three-part “Essentials of Automation” series. This first webinar is designed to equip you with the knowledge and skills to utilize parameters effectively: enhancing the flexibility, maintainability, and user control of your FME projects.
Here’s what you’ll gain:
- Essentials of FME Parameters: Understand the pivotal role of parameters, including Reader/Writer, Transformer, User, and FME Flow categories. Discover how they are the key to unlocking automation and optimization within your workflows.
- Practical Applications in FME Form: Delve into key user parameter types including choice, connections, and file URLs. Allow users to control how a workflow runs, making your workflows more reusable. Learn to import values and deliver the best user experience for your workflows while enhancing accuracy.
- Optimization Strategies in FME Flow: Explore the creation and strategic deployment of parameters in FME Flow, including the use of deployment and geometry parameters, to maximize workflow efficiency.
- Pro Tips for Success: Gain insights on parameterizing connections and leveraging new features like Conditional Visibility for clarity and simplicity.
We’ll wrap up with a glimpse into future webinars, followed by a Q&A session to address your specific questions surrounding this topic.
Don’t miss this opportunity to elevate your FME expertise and drive your projects to new heights of efficiency.
GDG Cloud Southlake #33: Boule & Rebala: Effective AppSec in SDLC using Deplo...James Anderson
Effective Application Security in Software Delivery lifecycle using Deployment Firewall and DBOM
The modern software delivery process (or the CI/CD process) includes many tools, distributed teams, open-source code, and cloud platforms. Constant focus on speed to release software to market, along with the traditional slow and manual security checks has caused gaps in continuous security as an important piece in the software supply chain. Today organizations feel more susceptible to external and internal cyber threats due to the vast attack surface in their applications supply chain and the lack of end-to-end governance and risk management.
The software team must secure its software delivery process to avoid vulnerability and security breaches. This needs to be achieved with existing tool chains and without extensive rework of the delivery processes. This talk will present strategies and techniques for providing visibility into the true risk of the existing vulnerabilities, preventing the introduction of security issues in the software, resolving vulnerabilities in production environments quickly, and capturing the deployment bill of materials (DBOM).
Speakers:
Bob Boule
Robert Boule is a technology enthusiast with PASSION for technology and making things work along with a knack for helping others understand how things work. He comes with around 20 years of solution engineering experience in application security, software continuous delivery, and SaaS platforms. He is known for his dynamic presentations in CI/CD and application security integrated in software delivery lifecycle.
Gopinath Rebala
Gopinath Rebala is the CTO of OpsMx, where he has overall responsibility for the machine learning and data processing architectures for Secure Software Delivery. Gopi also has a strong connection with our customers, leading design and architecture for strategic implementations. Gopi is a frequent speaker and well-known leader in continuous delivery and integrating security into software delivery.
Software Delivery At the Speed of AI: Inflectra Invests In AI-Powered QualityInflectra
In this insightful webinar, Inflectra explores how artificial intelligence (AI) is transforming software development and testing. Discover how AI-powered tools are revolutionizing every stage of the software development lifecycle (SDLC), from design and prototyping to testing, deployment, and monitoring.
Learn about:
• The Future of Testing: How AI is shifting testing towards verification, analysis, and higher-level skills, while reducing repetitive tasks.
• Test Automation: How AI-powered test case generation, optimization, and self-healing tests are making testing more efficient and effective.
• Visual Testing: Explore the emerging capabilities of AI in visual testing and how it's set to revolutionize UI verification.
• Inflectra's AI Solutions: See demonstrations of Inflectra's cutting-edge AI tools like the ChatGPT plugin and Azure Open AI platform, designed to streamline your testing process.
Whether you're a developer, tester, or QA professional, this webinar will give you valuable insights into how AI is shaping the future of software delivery.
PHP Frameworks: I want to break free (IPC Berlin 2024)Ralf Eggert
In this presentation, we examine the challenges and limitations of relying too heavily on PHP frameworks in web development. We discuss the history of PHP and its frameworks to understand how this dependence has evolved. The focus will be on providing concrete tips and strategies to reduce reliance on these frameworks, based on real-world examples and practical considerations. The goal is to equip developers with the skills and knowledge to create more flexible and future-proof web applications. We'll explore the importance of maintaining autonomy in a rapidly changing tech landscape and how to make informed decisions in PHP development.
This talk is aimed at encouraging a more independent approach to using PHP frameworks, moving towards a more flexible and future-proof approach to PHP development.
Key Trends Shaping the Future of Infrastructure.pdfCheryl Hung
Keynote at DIGIT West Expo, Glasgow on 29 May 2024.
Cheryl Hung, ochery.com
Sr Director, Infrastructure Ecosystem, Arm.
The key trends across hardware, cloud and open-source; exploring how these areas are likely to mature and develop over the short and long-term, and then considering how organisations can position themselves to adapt and thrive.
"Impact of front-end architecture on development cost", Viktor TurskyiFwdays
I have heard many times that architecture is not important for the front-end. Also, many times I have seen how developers implement features on the front-end just following the standard rules for a framework and think that this is enough to successfully launch the project, and then the project fails. How to prevent this and what approach to choose? I have launched dozens of complex projects and during the talk we will analyze which approaches have worked for me and which have not.
The Art of the Pitch: WordPress Relationships and SalesLaura Byrne
Clients don’t know what they don’t know. What web solutions are right for them? How does WordPress come into the picture? How do you make sure you understand scope and timeline? What do you do if sometime changes?
All these questions and more will be explored as we talk about matching clients’ needs with what your agency offers without pulling teeth or pulling your hair out. Practical tips, and strategies for successful relationship building that leads to closing the deal.
State of ICS and IoT Cyber Threat Landscape Report 2024 previewPrayukth K V
The IoT and OT threat landscape report has been prepared by the Threat Research Team at Sectrio using data from Sectrio, cyber threat intelligence farming facilities spread across over 85 cities around the world. In addition, Sectrio also runs AI-based advanced threat and payload engagement facilities that serve as sinks to attract and engage sophisticated threat actors, and newer malware including new variants and latent threats that are at an earlier stage of development.
The latest edition of the OT/ICS and IoT security Threat Landscape Report 2024 also covers:
State of global ICS asset and network exposure
Sectoral targets and attacks as well as the cost of ransom
Global APT activity, AI usage, actor and tactic profiles, and implications
Rise in volumes of AI-powered cyberattacks
Major cyber events in 2024
Malware and malicious payload trends
Cyberattack types and targets
Vulnerability exploit attempts on CVEs
Attacks on counties – USA
Expansion of bot farms – how, where, and why
In-depth analysis of the cyber threat landscape across North America, South America, Europe, APAC, and the Middle East
Why are attacks on smart factories rising?
Cyber risk predictions
Axis of attacks – Europe
Systemic attacks in the Middle East
Download the full report from here:
https://sectrio.com/resources/ot-threat-landscape-reports/sectrio-releases-ot-ics-and-iot-security-threat-landscape-report-2024/
JMeter webinar - integration with InfluxDB and GrafanaRTTS
Watch this recorded webinar about real-time monitoring of application performance. See how to integrate Apache JMeter, the open-source leader in performance testing, with InfluxDB, the open-source time-series database, and Grafana, the open-source analytics and visualization application.
In this webinar, we will review the benefits of leveraging InfluxDB and Grafana when executing load tests and demonstrate how these tools are used to visualize performance metrics.
Length: 30 minutes
Session Overview
-------------------------------------------
During this webinar, we will cover the following topics while demonstrating the integrations of JMeter, InfluxDB and Grafana:
- What out-of-the-box solutions are available for real-time monitoring JMeter tests?
- What are the benefits of integrating InfluxDB and Grafana into the load testing stack?
- Which features are provided by Grafana?
- Demonstration of InfluxDB and Grafana using a practice web application
To view the webinar recording, go to:
https://www.rttsweb.com/jmeter-integration-webinar
UiPath Test Automation using UiPath Test Suite series, part 3DianaGray10
Welcome to UiPath Test Automation using UiPath Test Suite series part 3. In this session, we will cover desktop automation along with UI automation.
Topics covered:
UI automation Introduction,
UI automation Sample
Desktop automation flow
Pradeep Chinnala, Senior Consultant Automation Developer @WonderBotz and UiPath MVP
Deepak Rai, Automation Practice Lead, Boundaryless Group and UiPath MVP
Let's dive deeper into the world of ODC! Ricardo Alves (OutSystems) will join us to tell all about the new Data Fabric. After that, Sezen de Bruijn (OutSystems) will get into the details on how to best design a sturdy architecture within ODC.
3. a metric is a measure or a combination of measures for
quantitatively assessing, controlling or improving
a process, a product, a team
a KPI, Key Perfomance Indicator, is a (aggregate)
metric that:
is tied to a strategic objective;
have at least one defined time-bound target value
(number, range, limit, percentage, trend, variation)
Metric vs. KPI
5. actionable understandable
accessible
Many “recipes” and
characteristics, i.e.
SMART
Specific
Measurable
Achievable
Relevant
Timely
INVEST
Immediately actionable
Negotiable
Valuable
Estimable
Sized to fit
Testable
a good KPI
3 are enough
8. some examples (time, effort, scope)
Is planning accurate ?
How long does it take for a
requirement to be delivered
to customers ?
Are effort and cost estimates
accurate ?
How is effort split between
design, coding and testing ?
Are requirements satisfied ?
Are requirements changing ?
How often ?
How “big” is the software ?
Schedule Adherence &
Variance
Lead Time, Cycle Time
Slip Charts
Effort & Cost Adherence
Cost per Phase
Amount of Rework
Requirements adherence
Requirements volatility (churn)
Code size (KLOCs :( ,
#modules, #classes, …)
11. exponential metric growth: i.e. Defects
total # defects
# defects by category (i.e. critical, major, minor)
# non-functional defects (usability, performance)
# new defects / time
# defects fixed / time
# critical defects / time
# re-opened defects (regression)
# tests / defect
time required to fix a defect
# defects found in-house / total # defects (DRE)
# defects found / # test hours spent
etc.
15. Metrics should not scare or threaten people
Enforced metrics are often cheated or ignored
16. Cheating
copy & paste some code,
copy & paste unit tests making slight modifications
result: increased code coverage
write some buggy code and
quickly fix it
result: increased number of fixed bugs
(maybe you also get credit for additional LOCs!)
17. Sex, Lies & Statistics
(beware of wrong/biased numbers)
1920: “most criminals are farmers”
actually most people where farmers at that time
1940: “twins more likely if mothers are in their 25s-30s”
most mothers gave birth in their 25s-30s at that time
growth much easier when
starting from a small base
18. Code Quality Metrics
KLOCs
code reviews & specific analysis tools needed
how fragile you are
Complexity
Duplication
Smells
Churn
20. some Agile principles:
Create Value for the customer as early as
possible
Eliminate Waste (WIP, YAGNI)
Drive and Respond to Change, quickly
Time/Capacity Boxing (see Scrum and Kanban)
Provide Visibility into project progress
Enter Agile
21. productivity defects efficiency
effort customer satisfaction
velocity time requirements
size trend quality burndown roi
schedule business value capacity
complexity cumulative flow effectiveness
Googling with KPIs
22. Story Point
an arbitrary value to express effort, complexity and risk
associated to a user story, feature, task
Velocity
S
Velocity
# story points / interval (where
interval is usually a sprint or more
in general time)
Velocity is a team specific metric, it
cannot be used to compare
different teams
Velocity Improvement is a key goal
for Agile teams
24. -100
0
100
200
300
400
500
600
1 2 3 4 5 6 7 8 9 10 11 12 13 14
added SP
SP carried over from
previous sprint
SP todo from initial list
ideal trend
velocity
added SP trend
actual trend
Release Burndown Chart
sprint
velocity
delay
new expected
completion date
SPs have to be dropped
to get back on track
25. 0
50
100
150
200
250
0 1 2 3 4 5 6 7 8 9 10 11 12 13 14 15 16 17 18 19 20
real SP left
real Xtra time
left
ideal burndown
ideal Xtra time
left
Sprint Burndown Chart
bad
baddays
delay
look, ma
instant feedback!
Xtra time = time reserved
for other tasks (emergencies,
bug fixing, reviews, etc.)
26. each story has one or more automated tests
when tests pass the story has been completed
=> you are forced to become agile:
cannot do BDUF*, must do automated testing/
continuous integration
must deliver early value
Compile
Build
Test
Deploy
Running Tested FeaturesRon Jeffries
C.I. Quality Feedback Loop*Big Design Up Front
27. Backlog
Story
Points
Value For
Customer
Value
Delivered
(*100)
story 1 13 21 162
story 2 21 13 62
story 3 34 21 62
story 4 5 8 160
story 5 5 5 100
story 6 13 3 23
story 7 8 8 100
story 8 3 1 33
story 9 13 5 38
story 10 21 5 24
Early Value Delivery (again)
Business Value Points
Desire of Customer
Value =
Cost of providing functionality
68.3% of value
already delivered
here
same velocity
greater value!
story points
28. Iteration Related Metrics
(%) Stories & Story Points Completed
(%) Stories added/removed (Sprint & Release)
Stories unfinished/moved to Next Sprint
Sprints Moved to Next Release
Lead & Cycle Time (Stories & Defects)
Average Age of Stories and Defects
(%) Failed Builds, (%) Failed Tests
Defects Added & Fixed (absolute & trend)
29. WIP
Cumulative Flow Diagram
to do
doing
done
cycle time
cycle time
WIP
WIP is
increasing
done
doing
to do
Work In Process (WIP) and Cycle Time
should be minimized
30. Some Kanban Specific Metrics
Cycle Time =
Number of Things in Process/
Average Completion Rate
Little’s Law
time spent in each lane ?
bottlenecks ?
cycle time
lead time
Flow = Speed * Density,
Density Speed
=> Traffic Jam
40 60 25
ouch!
ouch!
31. first thing in the morning: dashboard!
Short Term vs. Long Term Dashboard.
Short Term: build ok, automated tests ok, value earned, schedule
(burndown), critical bugs entered, critical bugs still there, impediments, ...
Long Term: trends: failed builds, failed tests, # of tests, velocity, earned
value per month, # and type of bugs, …
i.e. increase test coverage
32. Essential Tools
a big board and lots of cards (hard to extract metrics though)
source code management (obvious)
automated build & test suites (CI)
issue tracking*
some/many of these tools may be
part of integrated product suites
*unless you belong to a small elite
code analysis
agile management system
dashboard