Download to read offline
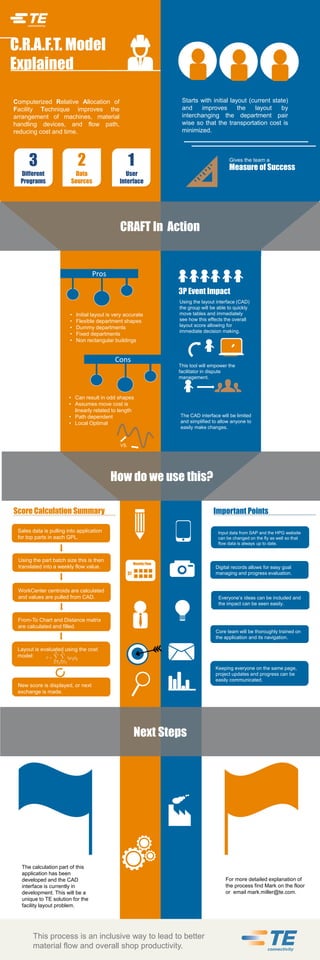

This document discusses the CRAFT (Computerized Relative Allocation of Facility Technique) model, which aims to improve factory layouts to reduce costs and increase efficiency. It will provide a CAD interface to allow users to quickly modify layouts and see the impact on productivity. Key steps include inputting data into the tool, using it to iteratively exchange departments to minimize transportation costs, and tracking progress towards the goal of improved material flow and shop productivity. Training will be provided to users on how to navigate and utilize the application.


