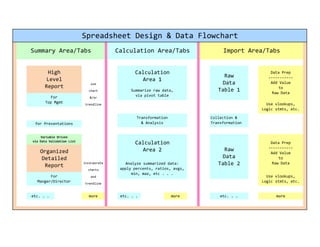
The document discusses spreadsheet design and data flow. It recommends incorporating charts and trendlines to visualize data. It suggests using functions like VLOOKUPs and logic statements to transform, analyze, and calculate data from raw data tables. The transformed data can then be organized into detailed reports and summarized further by applying calculations like percentages, ratios, averages, minimums and maximums. This summarized data can be presented in high-level reports tailored for managers/directors or top management using techniques like variable-driven data validation lists.
It discusses about capacity management in the telecommunications sector and also the factors that affect them. Talks about internal and external capacity management.
The EV-CR contains data at the WBS level of program perform. Using R and built in functions, the contents of IPMR Box a,b,c can be produced using this data and compared to the contents of 6 a,b,c provided in the current IPMR submittal.
PNM's GIS department has been using FME Desktop (Workbench) since 2002, when they hired Safe to create some workspaces for a major gas data conversion project. The PNM employee who worked with Safe realized FME's potential and started spreading the word. Today, in 2016, several GIS professionals at the company employ FME, using it for various ends. These include data conversion, extracts, reports, analyses, data quality and improvement, and error checking. This presentation will provide a brief overview of the many ways we use FME at PNM, exploring a couple of projects in greater detail. Presented by Aaron Allen and Rene Carrillo from PNM.
The Wisconsin Department of Natural Resources directly
produces the state’s Digital Flood Insurance Rate Maps
(DFIRMs) under FEMA’s Map Modernization Program. This
presentation will discuss how we use an ArcMap 9.2 extension,
Flood Map Desktop 9™ (FMD), to create FEMA-compliant
DFIRM data, metadata, and map deliverables. The FMD tool
has greatly improved our program’s work flow and efficiency.
As we demonstrate the FMD structure and FMD toolbars, we
will discuss geodatabase creation and management, topology,
domain tables, formatting style files, symbology, label creation
and storage, data exporting, and project settings which form the
base templates for our maps.
MÓDULOS ADMINISTRATIVOS EN EL CONTEXTO DE LA SOCIEDAD POSTMODERNA.
UNIVERSIDAD FERMÍN TORO
DECANATO DE INVESTIGACIÓN Y POSTGRADO
MAESTRÍA EN GERENCIA EMPRESARIAL
MATERIA: INTRODUCCIÓN A LA GESTIÓN ADMINISTRATIVA
Клуб Робототехники и ТехТворчества в IT СлободеGoodKarma.me
IT Слобода - клуб робототехники и технического творчества в Севастополе для детей 7-16 лет. http://goo.gl/vgQzdu
Увлекательные занятия проходят по направлениям «Сделай Сам», «Программирование роботов», «Схемотехника в Minecraft», «Робототехника Lego Mindstorms»
На занятиях детей учат думать, генерировать идеи, мастерить, программировать роботов, создавать полезные и актуальные вещи своими руками. Это возможность дать ребенку получать самые современные знания и полезные навыки в интересной и увлекательной форме.
Задача наших занятий — дать детям стимул к творчеству, научить нешаблонно мыслить, помочь самостоятельно построить в голове научную картину мира.
Занятия состоят из блоков теории, после каждого из которых, ребенку предоставляется возможность самостоятельно применить знания на практике.
Serverless as a Collaborative Economy EnablerBart Blommaerts
In recent years, the uprise of the cloud has brought us a lot of new and disruptive technology. Everybody is talking about SaaS, PaaS, IaaS and other aaS’es. In 2014 Amazon launched AWS Lambda as the pinnacle of the cloud computing. It allows developers to focus on code, without spending time on managing servers. The goal of this talk is not only introducing the serverless architecture style, but also tackle popular myths regarding “No More Servers” and “No More Ops”. Throughout the talk, we will focus on a “collaborative economy” approach to explain these concepts.
Reflecting On Assessment A Tale Of Hope And Ideals 2010John McCarthy
Eliminating Grade Fog
How do we know what students know or don't know? If the primary purpose of grades is giving academic data on a student's learning progress. The challenge is to use a grading process that tells a clear picture of learning, unfogged by non-academic factors.
http://wb4all.blogspot.com
Reflecting On Assessment A Tale Of Hope And Ideals 2010
My_Speadsheet_Design_Approach
1. use
chart
&/or
trendline
incorporate
charts
and
trendline
etc. . . more etc. . . more etc. . . more
.
For
Manger/Director
Use vlookups,
Logic stmts, etc.
Transformation
& Analysis
Collection &
Transformation
Use vlookups,
Logic stmts, etc.
for Presentations
Variable Driven
via Data Validation List
Calculation
Area 2 Raw
Data
Table 2
Data Prep
-----------
Add Value
to
Raw Data
Organized
Detailed
Report Analyze summarized data:
apply percents, ratios, avgs,
min, max, etc . . .
Spreadsheet Design & Data Flowchart
Summary Area/Tabs Calculation Area/Tabs Import Area/Tabs
High
Level
Report
Calculation
Area 1
Raw
Data
Table 1
Data Prep
-----------
Add Value
to
Raw Data
Summarize raw data,
via pivot tableFor
Top Mgmt