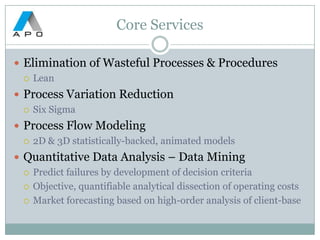
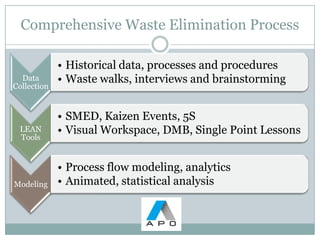
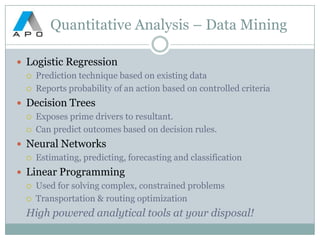
APO, Inc. provides optimization services including Lean, Six Sigma, and data analysis tools to eliminate waste, reduce variation, and model processes. Their services include waste elimination, statistical process modeling with 2D and 3D animation, and quantitative data mining techniques like logistic regression, decision trees, and neural networks.
Making Improvement Standard: Making Agile Practices Dynamic through Lean Stan...LitheSpeed
Continuous improvement and adaptation is practically the definition of agility, but teams have to start somewhere. This session will explore how common tools like agile practice self-assessments have been combined with lean “standard work” practices to provide early agile teams with focused guidance, while encouraging them to raise their own standards as they mature and learn.
We will describe a framework for management and coaching roles involved in driving and supporting agile development efforts, based upon our experiences in both small companies and large enterprises at various stages of adoption.
Visual management is an integral part of a Lean management system. Visual management uses displays, metrics and controls to help establish and maintain continuous flow, and giving everyone a view of the work along the value stream. It includes a set of techniques that make operation standards visible so that people can follow them more easily. These techniques expose waste so that it can be prevented and eliminated.
LEARNING OBJECTIVES:
1. Understand that visual management is an integral part of Lean transformation
2. Familiarize with the common visual tools such as red tagging, activity boards, A3 storyboards, mistake-proofing, one-point lessons, standard work, kanban, etc.
3. Gain knowledge on how to apply visual tools to add structure and stability to operations, reducing variation and increasing efficiency
CONTENTS:
Introduction
5S - The foundation for a visual workplace
Types of visual management
Visual displays
Visual metrics
Visual controls
Mistake-proofing
Andons
Warning sensors
Common visual tools
Red tagging
Activity board
A3 storyboard
One-point lesson
Standard work chart
Takt time versus actual
Kanban
To download this complete presentation, please visit: http://www.oeconsulting.com.sg
What do 'Lean' manufacturing techniques have to offer service companies? Lean production practices generally reduce costs, eliminate waste, and increase efficiency. However, translating these practices to an office environment is often less than obvious. Fully achieving 'Lean' also entails value stream mapping, root cause problem solving, and 5S methodology (to name a few). But these ideas are far from difficult to grasp and often enlightening.
Lean Office is a management philosophy based on the Toyota Production System (TPS). With Lean Office, you will be able to enhance value for your customers by improving and smoothing the process flow and eliminating waste. Simply put, by becoming a Lean Office, you will be able to increase productivity and create greater customer value with less resources.
By teaching this presentation to managers and employees working in Office/Service environments, they will have a better understanding of the Lean principles and approach to eliminating waste, and will be more forthcoming to lead and participate in the Lean implementation process.
NUMBER OF SLIDES: 127
LEARNING OBJECTIVES:
By the end of the program, you would be able to:
1. Understand the principles and key concepts of Lean
2. Identify value and waste
3. Gain an overview of key Lean principles and tools, and their applications
4. Apply 5S principles to improve office organization and efficiency
5. Apply a simple problem solving process
CONTENTS:
1. Introduction to Lean Office
2. Key Concepts of Lean Office
3. Overview of Lean Methods & Tools
4. Ways to develop "Kaizen Eyes"
5. Lean Roles
6. Sustaining a Lean Office
To download this complete presentation, please visit: http://www.oeconsulting.com.sg
A PowerPoint presentation of an AME webinar from April 8, 2016 focusing on lean management and lean leadership.
For more information about this topic at our 2017 International Conference in Boston, visit http://bit.ly/2oHMiTh
Visual Management - Making it easier to be in control
Thursday 30th July 2015
by David Hart and Jane Royden, E AND H Limited
APM Scotland branch event in Edinburgh
It is about the visual management in an organization. This presentation contains introduction part, Importance, Benefits, Process, Different phases, tools and techniques of a visual management system.
OEE Financial Benefits From Component ImprovementLean Teams USA
OEE has long been used as a Lean measure for the effectiveness of production equipment. It is mainly used to determine where to focus improvement efforts, Availability, Performance, or Quality. This presentation provides an explanation of OEE and a case study of how improvements to each of the OEE factors can demonstrate financial results
[Note: To download this poster, visit:
https://www.oeconsulting.com.sg/training-presentations]
The poster depicts the 8 steps of Focused Improvement (Kobetsu Kaizen).
After discussing the Lean in Accounts Payable Process, here I am discussing, commonly used Lean tools which are used to control different types of wastes. An organization or a manufacturing unit can implement different tool for different process considering the type of waste which is to be controlled.
Understand the ideas, goals of Lean Visual Management & 5S. The 4 Phases to Visual Management explained by Nilesh Arora, a founder of AddValue Consulting Inc.
Standard Work for Leaders is a lean approach and method to enable leaders to provide daily support in both strategy deployment and culture development. The leaders follow a three step process of developing the daily standard tasks to check on strategy deployment, installing visual management at the value stream to understand the progress and results, and finally using the Gemba walk to ensure daily progress.
Lean Solution for
- increasing efficiency at work,
- reducing time and complexity,
- better controlling the cost,
- optimizing the workflow
- better working environment
[Note: This is a partial preview. To download this presentation, visit:
https://www.oeconsulting.com.sg/training-presentations]
This is a comprehensive set of checklists for waste-finding in manufacturing companies. The checklists are based on the eight types of Lean waste:
1. Overproduction
2. Inventory
3. Waiting
4. Motion
5. Transportation
6. Defects
7. Overprocessing
8. Intellectual
The checklists have a combined total of 65 waste items which could be potentially found on the shopfloor. For each checklist item, the magnitude of waste can be quantified under four levels:
Magnitude 0 : No waste found
Magnitude 1 : Very little waste
Magnitude 2 : Some waste
Magnitude 3 : A lot of waste
The checklists can be applied generally to all manufacturing departments. Users may adopt the checklists as they are, or customize them to suit your specific application. Add or delete the checklist items as needed.
The checklists form the basis of a structured improvement plan. Waste items can be ranked or prioritized and assigned to a person or team to develop an action plan for eliminating the identified waste within a certain timeframe.
CONTENTS:
1. Summary of the Eight Types of Lean Waste
2. Waste-finding Checklists
2.1 Waste-finding Checklist: Overproduction
2.2 Waste-finding Checklist: Inventory
2.3 Waste-finding Checklist: Waiting
2.4 Waste-finding Checklist: Motion
2.5 Waste-finding Checklist: Transportation
2.6 Waste-finding Checklist: Defects
2.7 Waste-finding Checklist: Overprocessing
2.8 Waste-finding Checklist: Intellectual
2.9 Major Waste-finding Checklist
Waste identification and elmination exercise materials todd mc cann rev 23leansavant
The Waste Identification and Elimination exercise was created to instruct sutdents to Learn to See waste using a Flight Simulator scenario. Enjoy, Todd McCann GANBARE!
A small office kaizen team identified errors resulting from not using a mistake-proofing tool and revised and updated that tool. They also increased the visual work flow to identify areas that needed more training and allowed for better planning in their department.
This presentation is a collection of 24 useful tools for problem solving. It includes the basic and advanced QC tools and are applicable to all types of industries.
Simply presented using a 'Purpose', 'When To Use' and 'Procedure' format, these tools can be applied to add greater breadth and depth to your PDCA, DMAIC, or 8D, etc. problem solving projects.
The tools include the following:
1. Flow Chart
2. Brainstorming
3. Gantt Chart
4. Stratification
5. Check Sheet
6. Bar Chart
7. Waterfall Chart
8. Line Graph
9. Pie Chart
10. Belt Graph
11. Radar Chart
12. Control Chart
13. Pareto Chart
14. Cause & Effect Diagram
15. 5 Whys
16. Histogram
17. Scatter Diagram
18. Affinity Diagram
19. Relations Diagram
20. Tree Diagram
21. Matrix Diagram
22. Matrix Data Analysis Chart
23. Arrow Diagram
24. Process Decision Program Chart
How To Achieve Process Transformation In Any Organization PowerPoint Presenta...SlideTeam
It covers all the important concepts and has relevant templates which cater to your business needs. This complete deck has PPT slides on How To Achieve Process Transformation In Any Organization PowerPoint Presentation Slides with well suited graphics and subject driven content. This deck consists of total of thirty six slides. All templates are completely editable for your convenience. You can change the colour, text and font size of these slides. You can add or delete the content as per your requirement. Get access to this professionally designed complete deck presentation by clicking the download button below. https://bit.ly/39VWkJj
PwC Accelerator - Local to Global Expo - November 20, Crystal Park, Luxembourg.
Presentation from the event, which brought together ten innovative companies active in the areas of enterprise software, Big Data, IT security and financial technology from all around the world including Silicon Valley, South Africa, Europe and Russia.
Find out what Bizagi did to be named 'Most Promising Company' by the PwC Jury, which saw the BPM provider compete against 10 companies from 7 different countries to gain the award.
This paper presents comparison study among three
of the most famous Business Process Management
Systems, Bizagi, ProcessMaker, and Joget. Bizagi is
close source, while ProcessMaker and Joget are open
source. The comparison framework has been devel-
oped based on the most features that needed to be in-
teracted when developing work
ow system. Simple
business process has been used as case study that de-
scribes the online application for master applicants
at modern Arab university. Systems have been devel-
oped using those tools. After that the comparison was
done according to the framework. Finally the results
are pointing according the given measurement.
According to our framework and selected features the
study found that the Bizagi has the best performance
and the second is ProcessMaker. However, this by no
means is a complete comparison.
In business process modelling Bizagi outperforms the
other tools. However in form aspects ProcessMaker
and Joget outperform Bizagi.
The world of corporate learning is moving toward the 70+20+10% model. This suggests about 70% of learning happens on the job, 20% via feedback from colleagues and peers and 10% in formal training. SharePoint is one of the key enablers of this move, with its widespread use for blogging, wikis and document repositories. Assessments (quizzes, surveys, tests and exams) are a critical part of learning—helping diagnose what you need to learn, giving feedback on learning, measuring and reinforcing what you have learned. Assessments are also useful in SharePoint for those using it for more formal training and also to keep track of compliance with regulations within SharePoint.
Sander Klous - Op de 1e editie van Data DonderdagDataDonderdag
Tijdens de eerste editie van Data Donderdag sprak Sander Klous, hoofd van het Big Data en Analytics team bij KPMG over Big Data ecosystemen in bedrijfsleven en maatschappij.
Bersin by Deloitte - Demystifying Big DataNetDimensions
- How to start with the data you already have
- How data integration is essential to analytics
- How to move from transactional metrics to business metrics
Larn how to leverage BPM, cloud technology, social collaboration and mobility to drive market success.
Appian Vice President Malcolm Ross will outline the new technology imperatives for process improvement, and how industry leaders are using them to drive value. He will also pay special attention to enterprise mobility issues such as security, cost, and governance to show how next-generation BPM ensures safe and secure mobile participation in critical business processes.
In addition, you will learn how the Appian BPM Suite extends process participation across the organization – from executives to partners and customers.
The Appian BPM Suite creates agile organizations that respond quickly to change – the hallmark of competitive advantage.
The Digital Enterprise - Alfresco Summit Keynote 2014John Newton
US Fed Reserve says that productivity growth been declining in the 21st Century and IT has not necessarily been the solution. In Europe, growth has stalled completely and economies are facing the prospect of deflation. Business and operational models from the 20th Century no longer scale as we face exponential growth in information, activity and connections. We no longer give workers the scope or space to get work done. Waste and ad hoc process are killing us. We must reorganise how the company works and the way we do work. We must eliminate the waste of unnecessary paperwork, busy work and communication by digitising, automating and measuring that work into a Digital Enterprise. We must allow The Digital Enterprise will integrate information, processes, work and people to collaborate more efficiently and effectively to produce more valuable products and services.
Lecture slides by Mustafa Jarrar at Birzeit University, Palestine.
Course Title: Data and Business Process Modeling
See the course webpage and video lectures at: http://jarrar-courses.blogspot.com/2015/01/data-and-business-process-modelling.html
and http://www.jarrar.info
Business Model Disruption - The Step-wise Transition to Remote OperationsYokogawa1
Many assets have reached the “point of diminishing returns” in their pursuit of optimization benefits using conventional business models. To reach the next horizon of value, these assets must undergo digital process re-engineering, digital re-organization and digital business transformation. In many cases, the entire operations management system needs to be re-written and re-implemented. The first step in transitioning to a new operating model involves defining the end-state and achieving a step-wise approach toward it. That end state might be a centralized optimization center, remote integrated operations center, minimal manning facility, or a fully automated facility. The internal rate of return (IRR) associated with the transition to remote operations depends on the extent to which operating cost savings can be traded for capital investment. Through various case studies, this session will explore the key considerations in making a successful transition and the important factors driving IRR variability and operational risk.
Rapid Deployment of ERP solutions using agile practices by Husni Roukbi Agile ME
Economic climate demands a faster return on investment, often within the same year of the implementation. Implementing ERP solutions in the traditional waterfall way that takes up to 18 months before a customer can see the value of it is no longer acceptable. This presentation will discuss how we reduced ERP implementation time from 18 months to 6 months using a combination of DevOps and agile practices.
Leveraging OEE to Minimize Downtime and Maximize PerformanceSafetyChain Software
Join SafetyChain and Vern Campbell, president of Process Management Consulting, for this webinar on how to implement OEE to maximize performance and cost savings across your organization.
What is Lean Six Sigma? Lean Six Sigma Explained - Invensis LearningInvensis Learning
This presentation on What is Lean Six Sigma? explains the need of Lean Six Sigma, and how it can be implemented along with its benefits.
Areas Covered:
1. What is Lean Six Sigma?
2. Why Lean Six Sigma?
3. Understanding Lean & Six Sigma
4. What are Wastes/ Downtime?
4. DMAIC vs DMADV
#WhatIsLeanSixSigma #LeanSixSigma #InvensisLearning
Subscribe to our channel: https://bit.ly/3dmqNQS
Click here to check upcoming webinars on Quality Management: https://goo.gl/M9v8oP
About Invensis Learning:
Invensis Learning is a pioneer in providing globally-recognized certification training courses for individuals and enterprises worldwide. We have trained and certified 15,000+ professionals from 50+ courses through multiple training delivery modes.
Invensis Learning provides live online training on Lean Six Sigma Certification Belts. These Lean Six Sigma courses are accredited by IASSC.
Lean Six Sigma Yellow Belt: https://bit.ly/3o9SD8H
Lean Six Sigma Green Belt: https://bit.ly/2VmvdAM
Lean Six Sigma Black Belt: https://bit.ly/3lm8WO1
Other Lean Six Sigma Trainings: https://bit.ly/3g0c54T
For more information please visit our website: https://www.invensislearning.com
Follow Us on:
Facebook: https://www.facebook.com/invensislearn/
LinkedIn: https://www.linkedin.com/company/inve...
Twitter: https://twitter.com/invensiselearn/
Characteristics of high maturity organisations - how CMMI & LSS integration can improve product quality, processes, bottom line and customer satisfaction
Software Delivery At the Speed of AI: Inflectra Invests In AI-Powered QualityInflectra
In this insightful webinar, Inflectra explores how artificial intelligence (AI) is transforming software development and testing. Discover how AI-powered tools are revolutionizing every stage of the software development lifecycle (SDLC), from design and prototyping to testing, deployment, and monitoring.
Learn about:
• The Future of Testing: How AI is shifting testing towards verification, analysis, and higher-level skills, while reducing repetitive tasks.
• Test Automation: How AI-powered test case generation, optimization, and self-healing tests are making testing more efficient and effective.
• Visual Testing: Explore the emerging capabilities of AI in visual testing and how it's set to revolutionize UI verification.
• Inflectra's AI Solutions: See demonstrations of Inflectra's cutting-edge AI tools like the ChatGPT plugin and Azure Open AI platform, designed to streamline your testing process.
Whether you're a developer, tester, or QA professional, this webinar will give you valuable insights into how AI is shaping the future of software delivery.
Essentials of Automations: Optimizing FME Workflows with ParametersSafe Software
Are you looking to streamline your workflows and boost your projects’ efficiency? Do you find yourself searching for ways to add flexibility and control over your FME workflows? If so, you’re in the right place.
Join us for an insightful dive into the world of FME parameters, a critical element in optimizing workflow efficiency. This webinar marks the beginning of our three-part “Essentials of Automation” series. This first webinar is designed to equip you with the knowledge and skills to utilize parameters effectively: enhancing the flexibility, maintainability, and user control of your FME projects.
Here’s what you’ll gain:
- Essentials of FME Parameters: Understand the pivotal role of parameters, including Reader/Writer, Transformer, User, and FME Flow categories. Discover how they are the key to unlocking automation and optimization within your workflows.
- Practical Applications in FME Form: Delve into key user parameter types including choice, connections, and file URLs. Allow users to control how a workflow runs, making your workflows more reusable. Learn to import values and deliver the best user experience for your workflows while enhancing accuracy.
- Optimization Strategies in FME Flow: Explore the creation and strategic deployment of parameters in FME Flow, including the use of deployment and geometry parameters, to maximize workflow efficiency.
- Pro Tips for Success: Gain insights on parameterizing connections and leveraging new features like Conditional Visibility for clarity and simplicity.
We’ll wrap up with a glimpse into future webinars, followed by a Q&A session to address your specific questions surrounding this topic.
Don’t miss this opportunity to elevate your FME expertise and drive your projects to new heights of efficiency.
Search and Society: Reimagining Information Access for Radical FuturesBhaskar Mitra
The field of Information retrieval (IR) is currently undergoing a transformative shift, at least partly due to the emerging applications of generative AI to information access. In this talk, we will deliberate on the sociotechnical implications of generative AI for information access. We will argue that there is both a critical necessity and an exciting opportunity for the IR community to re-center our research agendas on societal needs while dismantling the artificial separation between the work on fairness, accountability, transparency, and ethics in IR and the rest of IR research. Instead of adopting a reactionary strategy of trying to mitigate potential social harms from emerging technologies, the community should aim to proactively set the research agenda for the kinds of systems we should build inspired by diverse explicitly stated sociotechnical imaginaries. The sociotechnical imaginaries that underpin the design and development of information access technologies needs to be explicitly articulated, and we need to develop theories of change in context of these diverse perspectives. Our guiding future imaginaries must be informed by other academic fields, such as democratic theory and critical theory, and should be co-developed with social science scholars, legal scholars, civil rights and social justice activists, and artists, among others.
"Impact of front-end architecture on development cost", Viktor TurskyiFwdays
I have heard many times that architecture is not important for the front-end. Also, many times I have seen how developers implement features on the front-end just following the standard rules for a framework and think that this is enough to successfully launch the project, and then the project fails. How to prevent this and what approach to choose? I have launched dozens of complex projects and during the talk we will analyze which approaches have worked for me and which have not.
GraphRAG is All You need? LLM & Knowledge GraphGuy Korland
Guy Korland, CEO and Co-founder of FalkorDB, will review two articles on the integration of language models with knowledge graphs.
1. Unifying Large Language Models and Knowledge Graphs: A Roadmap.
https://arxiv.org/abs/2306.08302
2. Microsoft Research's GraphRAG paper and a review paper on various uses of knowledge graphs:
https://www.microsoft.com/en-us/research/blog/graphrag-unlocking-llm-discovery-on-narrative-private-data/
Key Trends Shaping the Future of Infrastructure.pdfCheryl Hung
Keynote at DIGIT West Expo, Glasgow on 29 May 2024.
Cheryl Hung, ochery.com
Sr Director, Infrastructure Ecosystem, Arm.
The key trends across hardware, cloud and open-source; exploring how these areas are likely to mature and develop over the short and long-term, and then considering how organisations can position themselves to adapt and thrive.
UiPath Test Automation using UiPath Test Suite series, part 3DianaGray10
Welcome to UiPath Test Automation using UiPath Test Suite series part 3. In this session, we will cover desktop automation along with UI automation.
Topics covered:
UI automation Introduction,
UI automation Sample
Desktop automation flow
Pradeep Chinnala, Senior Consultant Automation Developer @WonderBotz and UiPath MVP
Deepak Rai, Automation Practice Lead, Boundaryless Group and UiPath MVP
Connector Corner: Automate dynamic content and events by pushing a buttonDianaGray10
Here is something new! In our next Connector Corner webinar, we will demonstrate how you can use a single workflow to:
Create a campaign using Mailchimp with merge tags/fields
Send an interactive Slack channel message (using buttons)
Have the message received by managers and peers along with a test email for review
But there’s more:
In a second workflow supporting the same use case, you’ll see:
Your campaign sent to target colleagues for approval
If the “Approve” button is clicked, a Jira/Zendesk ticket is created for the marketing design team
But—if the “Reject” button is pushed, colleagues will be alerted via Slack message
Join us to learn more about this new, human-in-the-loop capability, brought to you by Integration Service connectors.
And...
Speakers:
Akshay Agnihotri, Product Manager
Charlie Greenberg, Host
Transcript: Selling digital books in 2024: Insights from industry leaders - T...BookNet Canada
The publishing industry has been selling digital audiobooks and ebooks for over a decade and has found its groove. What’s changed? What has stayed the same? Where do we go from here? Join a group of leading sales peers from across the industry for a conversation about the lessons learned since the popularization of digital books, best practices, digital book supply chain management, and more.
Link to video recording: https://bnctechforum.ca/sessions/selling-digital-books-in-2024-insights-from-industry-leaders/
Presented by BookNet Canada on May 28, 2024, with support from the Department of Canadian Heritage.
Epistemic Interaction - tuning interfaces to provide information for AI supportAlan Dix
Paper presented at SYNERGY workshop at AVI 2024, Genoa, Italy. 3rd June 2024
https://alandix.com/academic/papers/synergy2024-epistemic/
As machine learning integrates deeper into human-computer interactions, the concept of epistemic interaction emerges, aiming to refine these interactions to enhance system adaptability. This approach encourages minor, intentional adjustments in user behaviour to enrich the data available for system learning. This paper introduces epistemic interaction within the context of human-system communication, illustrating how deliberate interaction design can improve system understanding and adaptation. Through concrete examples, we demonstrate the potential of epistemic interaction to significantly advance human-computer interaction by leveraging intuitive human communication strategies to inform system design and functionality, offering a novel pathway for enriching user-system engagements.
Kubernetes & AI - Beauty and the Beast !?! @KCD Istanbul 2024Tobias Schneck
As AI technology is pushing into IT I was wondering myself, as an “infrastructure container kubernetes guy”, how get this fancy AI technology get managed from an infrastructure operational view? Is it possible to apply our lovely cloud native principals as well? What benefit’s both technologies could bring to each other?
Let me take this questions and provide you a short journey through existing deployment models and use cases for AI software. On practical examples, we discuss what cloud/on-premise strategy we may need for applying it to our own infrastructure to get it to work from an enterprise perspective. I want to give an overview about infrastructure requirements and technologies, what could be beneficial or limiting your AI use cases in an enterprise environment. An interactive Demo will give you some insides, what approaches I got already working for real.
LF Energy Webinar: Electrical Grid Modelling and Simulation Through PowSyBl -...DanBrown980551
Do you want to learn how to model and simulate an electrical network from scratch in under an hour?
Then welcome to this PowSyBl workshop, hosted by Rte, the French Transmission System Operator (TSO)!
During the webinar, you will discover the PowSyBl ecosystem as well as handle and study an electrical network through an interactive Python notebook.
PowSyBl is an open source project hosted by LF Energy, which offers a comprehensive set of features for electrical grid modelling and simulation. Among other advanced features, PowSyBl provides:
- A fully editable and extendable library for grid component modelling;
- Visualization tools to display your network;
- Grid simulation tools, such as power flows, security analyses (with or without remedial actions) and sensitivity analyses;
The framework is mostly written in Java, with a Python binding so that Python developers can access PowSyBl functionalities as well.
What you will learn during the webinar:
- For beginners: discover PowSyBl's functionalities through a quick general presentation and the notebook, without needing any expert coding skills;
- For advanced developers: master the skills to efficiently apply PowSyBl functionalities to your real-world scenarios.
2. Core Services
Elimination of Wasteful Processes & Procedures
Lean
Process Variation Reduction
Six Sigma
Process Flow Modeling
2D & 3D statistically-backed, animated models
Quantitative Data Analysis – Data Mining
Predict failures by development of decision criteria
Objective, quantifiable analytical dissection of operating costs
Market forecasting based on high-order analysis of client-base
3. Comprehensive Waste Elimination Process
• Historical data, processes and procedures
Data • Waste walks, interviews and brainstorming
Collection
• SMED, Kaizen Events, 5S
LEAN • Visual Workspace, DMB, Single Point Lessons
Tools
• Process flow modeling, analytics
Modeling • Animated, statistical analysis
4. LEAN – Data Collection
Historical Data
Data collected manually
Historian data from Level 1-2 systems
Customer feedback
Likert surveys
Quality Management Systems (QMS)
Let‟s learn from the past!
5. LEAN – Data Collection
Processes and Procedures
ISO 9001:2000
Standard Operating Procedures (SOP)
Manufacturer’s Operating Guidelines
Operator’s Individual Work Practices
Division of Work
Training
What operating policies are currently in place?
6. LEAN – Data Collection
Waste Walks
As a team, become the part or “Thing” that is being
processed
Physically walk or follow the “Thing” through the
process
Individually and independently record Value Added
(VA) and Non-Value Added (NVA) Time in process
Spaghetti diagrams can illustrate the chaos.
Let‟s find out what‟s REALLY going on!
7. LEAN – Data Collection
Interviews and Brainstorming
Talk to the people operating the process –They
know best!
Talk to the managers
Discuss as a group and flesh out inconsistencies
and variations from perceived standard.
What is perception vs. reality?
8. LEAN Tools
SMED
Single Minute Exchange of Dies – Changeover
time in processing.
Staging of tools, equipment and materials
Eliminate the need for complex set-up
Externalize processes that have been done during
changeover
Reduce time it takes to make good first part.
Let‟s rethink how we do our changeovers and calibrations!
9. LEAN Tools
Kaizen Events
Typically a five day “Blitz” using all resources from in
department and beyond to achieve a clearly defined
improvement initiative.
Cross-functional teams. Team is the functional word!
Exuberant management involvement and encouragement
is mandatory.
Planning, planning, planning… Execution, celebration.
Build morale and keep the momentum going.
Ok guys, let‟s knock this thing out! Get „er done!
10. LEAN Tools
5S
A technique used to eliminate clutter, standardize
workspace tools, parts and procedures, expose equipment
failures, and organize a work area. Use with Kaizen.
1. Sort – Remove items that are non-essential to work
function
2. Straighten – Label, organize work area
3. Shine – Clean equipment to expose failures (leaks)
4. Standardize – Everyone uses the same tools and
procedures
5. Sustain – Checklists and audits to maintain success
No one likes to work in a pig sty. It‟s UNSAFE!
11. LEAN Tools
Visual Workspace
Shadow boxes
Go, No-go indicators
Alarms, out-of tolerance warnings
Centralization of critical operating information
Safety lines of demarcation
Critical knowledge at a glance!
12. LEAN Tools
Daily Management Boards (DMB)
Located at the operation
All Key Performance Indicating (KPI) data is displayed
Safety information is displayed.
A layman can walk by and know if the process is doing well or
not
All important documentation is available.
(SOP, SJP, ECP, etc.)
Daily meetings held at shift changeover to review state of the
operation
This is the “dashboard” of the operation!
13. LEAN Tools
Single Point Lessons
A standardized, controlled document used to display
a single point of instruction through visual aids and
concise descriptions.
Displayed on a single page.
Used for equipment inspection, assembly
steps, breakdown of complex procedure.
Uses pictures and/or graphics
Even I can understand this! Its so clear to me now!
14. LEAN – Modeling
Process Flow Modeling
Graphical representation of process using
standard symbols and nomenclature
Typically descriptive of the process and provides
a “flow chart” look at the system
Can contain decision blocks, but lacks statistical
backbone and decision algorithms
A good first step in understanding the process!
15. LEAN – Modeling
Statistical, Animated Modeling
Express process performance as a function of the recorded
data.
Display the process flow as an animated model. Value stream
mapping.
Quantify and understand the effects of waste in the system as
delays, bottlenecks, over/under utilization, and profit loss
Determine ROI of an improvement project with
quantifiable, presentable data.
Experiment with changes to the system virtually before
implementation to mitigate risk.
Deploy improvements in a systematic and planned manner
This is the APO, Inc. difference! We bring it all together!
16. Comprehensive Six Sigma Process
• Historical data, processes and procedures
Data
Collection
• Time studies, interviews and brainstorming
• Cpk, SPC, OEE, Voice of Customer
Six Sigma • DOE, House of Quality, FMEA
• High-order statistical analysis
Modeling • Model based solutions
17. Six Sigma – Data Collection
Historical Data
Data collected manually
Historian data from Level 1-2 systems
Defect & Failure Rates
Quality Management Systems (QMS)
Let‟s learn from the past!
18. Six Sigma – Data Collection
Processes and Procedures
ISO 9001:2000
Standard Operating Procedures (SOP)
Manufacturer’s Operating Guidelines
Operator’s Individual Work Practices
Division of Work
Training
What operating policies are currently in place?
19. Six Sigma – Data Collection
Time Studies
Observe operation and record data manually
Rate or schedule of receiving precursor
Cycle time
Takt time
Uptime/Downtime (Scheduled and otherwise)
Changeovers
Failures and defects
Breakdowns
Let‟s take an honest look at our process!
20. Six Sigma – Data Collection
Interviews and Brainstorming
Talk to the people operating the process –They know
best!
Talk to the managers
Discuss as a group and flesh out inconsistencies and
variations from perceived standard.
Do we collect our data the same way?
Does incentivization, or lack thereof, skew or inhibit
Truth in Reporting?
What is perception vs. reality?
21. Six Sigma - Tools
Process Capability (Cpk)
What is your process capable of?
Will it meet and/or exceed the specifications of
your client?
Do you account for the 1.5σ drift in unassignable
variability?
Know what you‟re capable of before making promises!
22. Six Sigma - Tools
Statistical Process Control (SPC)
SPC charts allow you to monitor the process and
determine if you are “out of control”
Determine your process UCL & LCL
Know your clients USL & LSL
Create a system for consistent, reliable performance!
23. Six Sigma - Tools
Voice of the Customer (VOC)
Itis important to know what is critical to the
customer
Focus your energy in the proper direction
Align your initiatives with the customer’s needs
Do things for the right reasons!
Resources are finite and exhaustible!
24. Six Sigma - Tools
Design of Experiments (DOE)
Powerful, matrix based troubleshooting tool
Allows for controlled step changes to a system for
diagnostic purposes
Money saving, thorough technique
Powerful analytic tool to get it right the first time!
25. Six Sigma - Tools
House of Quality
Powerful, matrix based assessment tool
Relates VOC to company improvement initiatives
Prioritizes projects by VOC
Determines correlations in initiatives
It‟s ALL about the customer (internal or external)!
26. Six Sigma - Tools
Failure Mode Effect Analysis (FMEA)
Reduce failures (errors, defects, shut-downs)
Determine imminent threats to process
Prioritize equipment repairs by risk level
Move into a Reliability Centered Maintenance
(RCM) program
Predict failures instead of reacting to them!
27. Six Sigma – Modeling
Statistical, Animated Modeling
Express process performance as a function of the recorded
data.
Display the process flow as an animated model
Quantify and understand the effects of waste in the system as
delays, bottlenecks, over/under utilization, and profit loss
Determine ROI of an improvement project with
quantifiable, presentable data.
Experiment with changes to the system virtually before
implementation to mitigate risk.
Deploy improvements in a systematic and planned manner
This is the APO, Inc. difference! We bring it all together!
28. Quantitative Analysis – Data Mining
Logistic Regression
Prediction technique based on existing data
Reports probability of an action based on controlled criteria
Decision Trees
Exposes prime drivers to resultant.
Can predict outcomes based on decision rules.
Neural Networks
Estimating, predicting, forecasting and classification
Linear Programming
Used for solving complex, constrained problems
Transportation & routing optimization
High powered analytical tools at your disposal!