Download as PDF, PPTX
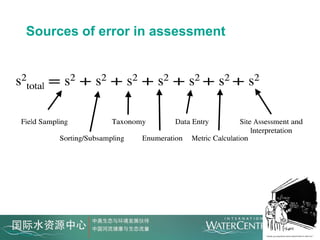

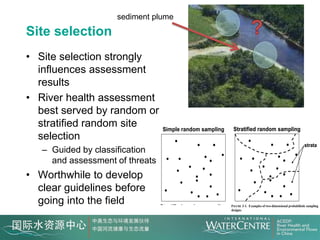
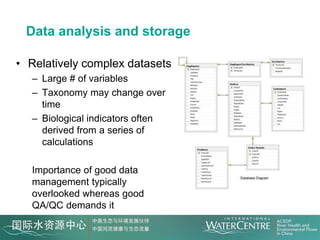
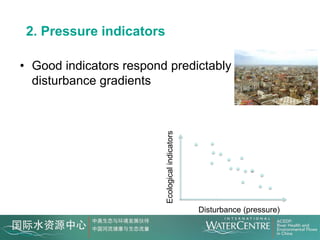
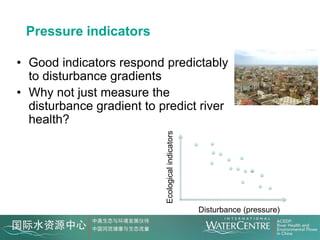
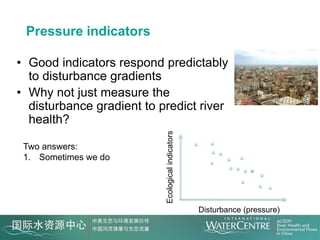
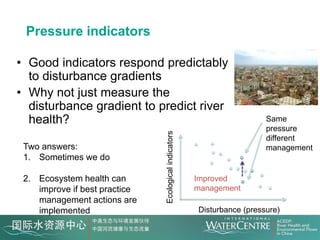
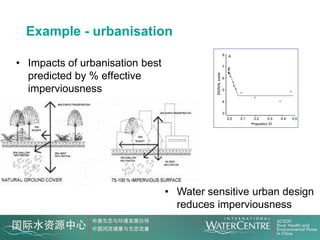
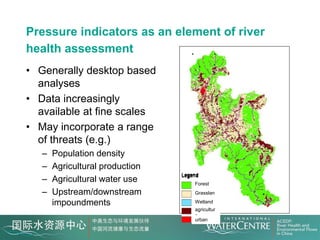
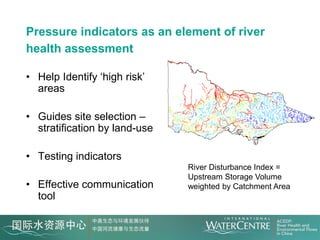
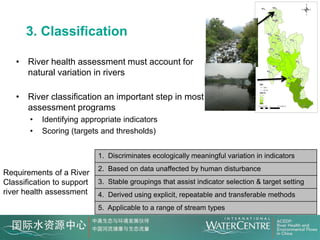

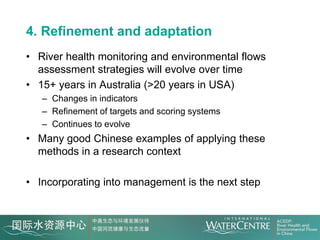


This document discusses additional considerations for river health assessment, including quality assurance, site selection, pressure indicators, classification, and refinement over time. Quality assurance requires scientific basis, quality control, data interpretation, and evaluation of results. Site selection is important and best done randomly or stratified randomly. Pressure indicators can predict health and identify high risk areas. Classification accounts for natural variation and aids in indicator selection. River assessments evolve over many years through refinement.


