Download to read offline


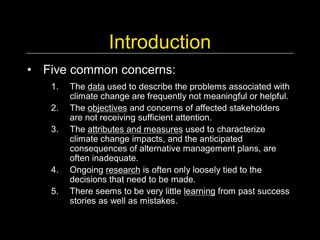


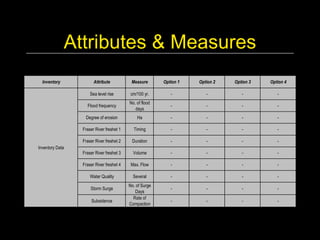

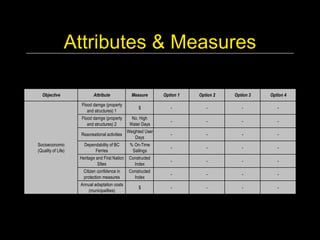

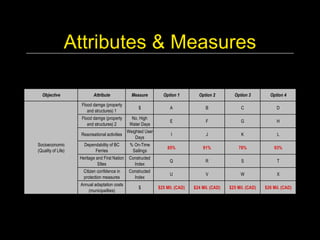


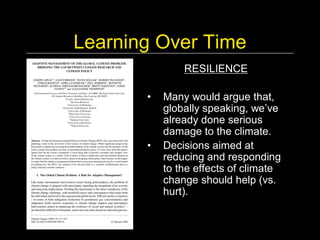


This document discusses five obstacles to effective climate change decision making: 1) data used is often not meaningful or helpful, 2) stakeholder objectives and concerns are not sufficiently addressed, 3) attributes and measures used to characterize impacts are inadequate, 4) research is loosely tied to decisions that need to be made, and 5) there is little learning from past successes and mistakes. The document examines these obstacles in more detail and provides examples to illustrate challenges with using complex data, addressing stakeholder objectives, developing appropriate attributes and measures, and incorporating learning over time into the decision process.