This document discusses indicators that can be used to assess the dynamics and sustainability of fishery resources. It defines indicators as data collected for analytical or policy purposes. Good fishery indicators should be practical, cost-effective, and evaluate the state of fisheries systems and the impacts of policy changes. The document outlines several types of indicators, including biological indicators like relative biomass and biomass ratios, economic and social indicators like employment levels and trade, as well as data sources needed. It emphasizes using a suite of indicators that cover different issues and time scales.
Fish Stock Assessment in the Philippines. Chapter 1GinaGallano
A stock assessment is the process of collecting, analyzing, and reporting demographic information to determine changes in the abundance of fishery stocks in response to fishing and, to the extent possible, predict future trends of stock abundance.
Indicators are data or a combination of data collected and processed for a clearly defined analytical or policy purpose. That purpose should be explicitly specified and taken into account when interpreting the value of an indicator.
Biophysical Foundations of Production and Consumption of Human Economy Source...ijtsrd
Three major problems associated with our management of the world's ecosystems are already causing significant harm to some people, particularly the poor, and unless addressed will substantially diminish the long term benefits we obtain from ecosystems First, approximately 60 15 out of 24 of the ecosystem services examined during the Millennium Ecosystem Assessment are being degraded or used unsustainably, including fresh water, capture fisheries, air and water purification, and the regulation of regional and local climate, natural hazards, and pests. The full costs of the loss and degradation of these ecosystem services are difficult to measure, but the available evidence demonstrates that they are substantial and growing. Many ecosystem services have been degraded as a consequence of actions taken to increase the supply of other services, such as food. These trade offs often shift the costs of degradation from one group of people to another or defer costs to future generations. Second, there is established but incomplete evidence that changes being made in ecosystems are increasing the likelihood of nonlinear changes in ecosystems including accelerating, abrupt, and potentially irreversible changes that have important consequences for human well being. Dr. Anshumala Chandangar "Biophysical Foundations of Production and Consumption of Human Economy Sources and Sink Functions of the Ecosystem" Published in International Journal of Trend in Scientific Research and Development (ijtsrd), ISSN: 2456-6470, Volume-5 | Issue-6 , October 2021, URL: https://www.ijtsrd.com/papers/ijtsrd47663.pdf Paper URL : https://www.ijtsrd.com/economics/other/47663/biophysical-foundations-of-production-and-consumption-of-human-economy-sources-and-sink-functions-of-the-ecosystem/dr-anshumala-chandangar
The fishery performance indicators for global tuna fisheriesChristina Parmionova
Even when measures are approved, compliance is imperfect because fishing nations are individually responsible for implementation within each distinct regional jurisdiction, but enforcement often relies on voluntary compliance11 or coastal states to prevail upon their patron fishing nations to impose sanctions against their own fleets, who heavily rely on the very same resource rent to support their national economies.
Reporting the first year of results towards a Canada-wide evaluation of fresh...James Snider
Presentation at the Genomes to Biomes 2014 joint meeting of the Canadian Society of Ecology and Evolution, Canadian Society of Zoology, and the Limnology Society of Canada.
Paths to Fisheries Subsidies Reform: Creating sustainable fisheries through t...The Rockefeller Foundation
The world depends on the oceans for food and livelihood. More than a billion people worldwide depend on fish as a source of protein, including some of the poorest populations on earth. According to the United Nations Food and Agriculture Organization (FAO), the world must produce 70 percent more food to meet coming hunger needs.
Fishing activities support coastal communities and hundreds of millions of people who depend on fishing for all or part of their income. Of the world’s fishers, more than 95 percent engage in small-scale and artisanal activity and catch nearly the same amount of fish for human consumption as the highly capitalized industrial sector. Small-scale and artisanal fishing produces a greater return than industrial operations by unit of input, investment in catch, and number of people employed.
Today, overfishing and other destructive fishing practices have severely decreased the world’s fish populations. The FAO estimates that 90 percent of marine fisheries worldwide are now overexploited, fully exploited, significantly depleted, or recovering from overexploitation.
The Pennsylvania Dept. of Conservation and Natural Resources began a detailed study of the impacts from Marcellus Shale drilling more than three years ago. This is the first in what will be a series of reports outlining the impacts of drilling on state-owned lands, including state forests. This first report can be summed up in a comment from the opening preface to the report: "...shale-gas production on state forest lands is neither benign nor catastrophic. There are clearly impacts and tradeoffs associated with this activity. The question is what tradeoffs are acceptable. The Bureau of Forestry considers these tradeoffs and attempts to balance the various uses and values of the forest."
Similar to Indicators_of_dynamics_in_fishery_resource_7.ppt (20)
Comparing Evolved Extractive Text Summary Scores of Bidirectional Encoder Rep...University of Maribor
Slides from:
11th International Conference on Electrical, Electronics and Computer Engineering (IcETRAN), Niš, 3-6 June 2024
Track: Artificial Intelligence
https://www.etran.rs/2024/en/home-english/
Observation of Io’s Resurfacing via Plume Deposition Using Ground-based Adapt...Sérgio Sacani
Since volcanic activity was first discovered on Io from Voyager images in 1979, changes
on Io’s surface have been monitored from both spacecraft and ground-based telescopes.
Here, we present the highest spatial resolution images of Io ever obtained from a groundbased telescope. These images, acquired by the SHARK-VIS instrument on the Large
Binocular Telescope, show evidence of a major resurfacing event on Io’s trailing hemisphere. When compared to the most recent spacecraft images, the SHARK-VIS images
show that a plume deposit from a powerful eruption at Pillan Patera has covered part
of the long-lived Pele plume deposit. Although this type of resurfacing event may be common on Io, few have been detected due to the rarity of spacecraft visits and the previously low spatial resolution available from Earth-based telescopes. The SHARK-VIS instrument ushers in a new era of high resolution imaging of Io’s surface using adaptive
optics at visible wavelengths.
Slide 1: Title Slide
Extrachromosomal Inheritance
Slide 2: Introduction to Extrachromosomal Inheritance
Definition: Extrachromosomal inheritance refers to the transmission of genetic material that is not found within the nucleus.
Key Components: Involves genes located in mitochondria, chloroplasts, and plasmids.
Slide 3: Mitochondrial Inheritance
Mitochondria: Organelles responsible for energy production.
Mitochondrial DNA (mtDNA): Circular DNA molecule found in mitochondria.
Inheritance Pattern: Maternally inherited, meaning it is passed from mothers to all their offspring.
Diseases: Examples include Leber’s hereditary optic neuropathy (LHON) and mitochondrial myopathy.
Slide 4: Chloroplast Inheritance
Chloroplasts: Organelles responsible for photosynthesis in plants.
Chloroplast DNA (cpDNA): Circular DNA molecule found in chloroplasts.
Inheritance Pattern: Often maternally inherited in most plants, but can vary in some species.
Examples: Variegation in plants, where leaf color patterns are determined by chloroplast DNA.
Slide 5: Plasmid Inheritance
Plasmids: Small, circular DNA molecules found in bacteria and some eukaryotes.
Features: Can carry antibiotic resistance genes and can be transferred between cells through processes like conjugation.
Significance: Important in biotechnology for gene cloning and genetic engineering.
Slide 6: Mechanisms of Extrachromosomal Inheritance
Non-Mendelian Patterns: Do not follow Mendel’s laws of inheritance.
Cytoplasmic Segregation: During cell division, organelles like mitochondria and chloroplasts are randomly distributed to daughter cells.
Heteroplasmy: Presence of more than one type of organellar genome within a cell, leading to variation in expression.
Slide 7: Examples of Extrachromosomal Inheritance
Four O’clock Plant (Mirabilis jalapa): Shows variegated leaves due to different cpDNA in leaf cells.
Petite Mutants in Yeast: Result from mutations in mitochondrial DNA affecting respiration.
Slide 8: Importance of Extrachromosomal Inheritance
Evolution: Provides insight into the evolution of eukaryotic cells.
Medicine: Understanding mitochondrial inheritance helps in diagnosing and treating mitochondrial diseases.
Agriculture: Chloroplast inheritance can be used in plant breeding and genetic modification.
Slide 9: Recent Research and Advances
Gene Editing: Techniques like CRISPR-Cas9 are being used to edit mitochondrial and chloroplast DNA.
Therapies: Development of mitochondrial replacement therapy (MRT) for preventing mitochondrial diseases.
Slide 10: Conclusion
Summary: Extrachromosomal inheritance involves the transmission of genetic material outside the nucleus and plays a crucial role in genetics, medicine, and biotechnology.
Future Directions: Continued research and technological advancements hold promise for new treatments and applications.
Slide 11: Questions and Discussion
Invite Audience: Open the floor for any questions or further discussion on the topic.
Seminar of U.V. Spectroscopy by SAMIR PANDASAMIR PANDA
Spectroscopy is a branch of science dealing the study of interaction of electromagnetic radiation with matter.
Ultraviolet-visible spectroscopy refers to absorption spectroscopy or reflect spectroscopy in the UV-VIS spectral region.
Ultraviolet-visible spectroscopy is an analytical method that can measure the amount of light received by the analyte.
Richard's aventures in two entangled wonderlandsRichard Gill
Since the loophole-free Bell experiments of 2020 and the Nobel prizes in physics of 2022, critics of Bell's work have retreated to the fortress of super-determinism. Now, super-determinism is a derogatory word - it just means "determinism". Palmer, Hance and Hossenfelder argue that quantum mechanics and determinism are not incompatible, using a sophisticated mathematical construction based on a subtle thinning of allowed states and measurements in quantum mechanics, such that what is left appears to make Bell's argument fail, without altering the empirical predictions of quantum mechanics. I think however that it is a smoke screen, and the slogan "lost in math" comes to my mind. I will discuss some other recent disproofs of Bell's theorem using the language of causality based on causal graphs. Causal thinking is also central to law and justice. I will mention surprising connections to my work on serial killer nurse cases, in particular the Dutch case of Lucia de Berk and the current UK case of Lucy Letby.
This pdf is about the Schizophrenia.
For more details visit on YouTube; @SELF-EXPLANATORY;
https://www.youtube.com/channel/UCAiarMZDNhe1A3Rnpr_WkzA/videos
Thanks...!
Multi-source connectivity as the driver of solar wind variability in the heli...Sérgio Sacani
The ambient solar wind that flls the heliosphere originates from multiple
sources in the solar corona and is highly structured. It is often described
as high-speed, relatively homogeneous, plasma streams from coronal
holes and slow-speed, highly variable, streams whose source regions are
under debate. A key goal of ESA/NASA’s Solar Orbiter mission is to identify
solar wind sources and understand what drives the complexity seen in the
heliosphere. By combining magnetic feld modelling and spectroscopic
techniques with high-resolution observations and measurements, we show
that the solar wind variability detected in situ by Solar Orbiter in March
2022 is driven by spatio-temporal changes in the magnetic connectivity to
multiple sources in the solar atmosphere. The magnetic feld footpoints
connected to the spacecraft moved from the boundaries of a coronal hole
to one active region (12961) and then across to another region (12957). This
is refected in the in situ measurements, which show the transition from fast
to highly Alfvénic then to slow solar wind that is disrupted by the arrival of
a coronal mass ejection. Our results describe solar wind variability at 0.5 au
but are applicable to near-Earth observatories.
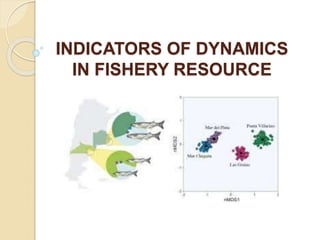
2. Indicators of dynamics in fishery resource
What are indicators?
Indicators are data or combination of data collected and processes
for a clearly defined analytical or policy purpose.
That purpose should be explicitly specified and taken into account
when interpreting the value of an indicator.
Fisheries indicators should provide practical and cost-effective
means for the evaluation of the state and the development of
fisheries systems and the effects that policy changes have on those
systems.
In considering the concept of indicators of sustainable
development, a necessary first step is to define the sustainable
development in the context of fisheries.
3. Indicators of dynamics in fishery resource conted….
What are indicators?
Sustainable development is generally defined as being
development that meets the needs of the current generation without
compromising the ability of future generations to meet their own
needs.
In the fisheries sector, the use of biological indicators in the
development of fisheries assessments and management plans has
been standard practice, in most OECD countries for many years.
However relatively little attention has paid to the development of
economic and social indicators that serve to assess progress on
other aspects of sustainable development.
4. Indicators of dynamics in fishery resource conted….
What are indicators?
With respect to criteria for success it has been found, both
theoretically and empirically that good indicators are easily
measured, cost effective to collect to calculate, and easily interpreted
( to avoid confusion about the state of the system they are
reflecting).
Simple indicators are consistently found to out perform more
complex (model-dependent) indicators, which were sensitive to data
quality.
There is consensus on the need for a suite rather than a single
indicator and on the types of indicators that perform well regardless
of system types.
These indicators are:
5. Economic and Social Indicators
For the indicators to be effective and workable in assessing the economic and social
performance of fisheries, they should:
Have a clear policy relevance and in particular:
A. Provide balanced coverage of some of the key issues of common concern to
OECD countries, and reflect changes over time;
B. Be easy to interpret (that is, movements in each indicator should have clear
link to overall sustainability);
C. Allow comparisons across countries;
D. Lend themselves to being adapted to different national contexts, analysed at
different levels of aggregation and linked to more detailed indicator sets.
Be analytically sound in technical and scientific terms, based on internationally
accepted standards and broadly accepted by stakeholders.
Be based on data that are available, of known quality and regularly updated.
6. Economic and Social Indicators conted….
What are indicators used for ?
The main purpose in developing a set of sustainability indicators is to
assist in assessing the performance of fisheries policy and
management and to stimulate action to better pursue to sustainability
objectives.
This can occur in a number of areas. For example, indicators can be
used for ex-post evaluations of the impacts of management initiatives;
assessment of progress towards medium and/or long-term objectives;
and assessment of the impacts of fisheries.
They can also enhance communication, transparency,
effectiveness and accountability in fisheries management.
7. Economic and Social Indicators conted….
What are indicators used for ?
In this regard, indicators can be developed and reported at various
levels of aggregation- international, national, regional and local levels.
Many of the environmental indicators for fisheries referred to above
are focused on the fishery level.
Other aggregates that are regularly reported, such as the
contribution of fisheries to exports, are reported at a national level.
Yet others relate to fisheries that are managed regionally as
straddling and/or highly migratory stocks.
8. Biological indicators
Relative biomass:
specifically of gelatinous zooplankton, cephalopods, small pelagic,
scanvengers, demersal fish, piscivores, top predators, and biogenic
habitat (cover forming species).
Ease of sampling differs strongly between these groups (for
instance external bodies, such as NGOs, often monitor the
charismatic top predators, tourism can focus attention on coral reef
fishes, snapshots of mangrove forests and shallow benthic habitat
may be available from satellite images.
It is possible to find proxies for even some of the most difficult
groups. For example, changes in relative biomass of gelatinous
zooplankton may be captured by frequency of bloom events, as this
is a much more easily obtainable statistic due to the ability to
generate it from expert information and fisher interviews.
9. Biological indicators conted….
Biomass ratios: The rapidity with which leaving materials can be
replaced itself is measured by biomass ratio. In particular the biomass
ratios of piscivore: planktivore (PS:ZP), pelagic: demersal (P:D) and
infauna: epifauna. The last of these is probably not feasible in data
poor situations, but the other two can be done.
Size spectra: which give an indication of perturbation in system
structure (using the slope of the curve), but can also highlight changes
in system productivity (via the intercept).
Maximum (or mean) length: This indicator is observed to work in
practice even if simple rules of thumb regarding are used. Caution is
needed regarding market driven changing in preferred sizes, however.
10. Biological indicators conted….
Total fisheries removals: (catch + bycatch + discards):
This indicator considers the total biomass removed from the system
versus what is left cycling in the system. While similar in concept to the
widely used comparison of primary production vs. removals from the
system, there is concern that it will not be suitable for data poor and
dispersed small scale fisheries due to the lack of data on removals let
alone discards.
Diversity: (counts of species):
It remains an informative and fundamental piece of information about
the system. Alternative measures of diversity or system structure may
need to be considered too, depending on which operating model is
used or what empirical data is available.
11. Biological indicators conted….
Diversity: (counts of species):
One possibility is considering the value of changes in species-area
curves (e.g. the slope and asymptote of the curve) through time (or
spatially if under a perturbation gradient). It is likely that some simple
or ordinal data can be collected on this from the fishers themselves
given that they are acutely aware of what they catch. Looking at
changes in these ranking could be highly informative.
Size at maturity (weight and length):
It is a strong means of detecting change in the system and stock
structure. It may be too difficult to use in data poor situations.
12. Biological indicators conted….
Biophysical (Chlorophyll a, temperature, dissolved inorganic
nitrogen, and level of contaminants):
These may be drawn from water quality monitoring programs or
remotely sensed data sets, but are needed even if they aren’t
already being collected as they are means of teasing out causation.
Indicators respond to any system change, including those caused by
sectors other than fisheries, so any information that helps elucidate
causation is extremely helpful.
While all of these indicators are not equally easily calculated in data
poor situations, they are a good “straw-man” to start testing
indicators for such fisheries in this study.
13. Biological indicators conted….
Biophysical (Chlorophyll a, temperature, dissolved inorganic nitrogen,
and level of contaminants):
It is critical that a suite of indicators, which are not all highly correlated,
is used;
Multiple time and space scales are spanned by the data sets.IT is also
critical that data include species that:
Are directly impacted
Have high turnover rates, which may provide a noisy but early
warning;
Define the habitat, as these often have a disproportionate or keystone
role in the system; and are from the upper trophic level, which are
typically both vulnerable in their own right due to their life history
14. Fisheries Indicators and data sources
Statistical information needed are:
A - TAC, Quotas, by species,
B - Quantity and value of landings, by species
C - Employment (total; full and part-time; male/female; capture
fisheries/aquaculture/ processing industry)
D - Fleet capacity (number of boats, by length or by GT/GRT)
E - Quantity and value of aquaculture production by species,
F - Recreational fisheries (estimates concerning the production
and the number of people involved),
15. Fisheries Indicators and data sources conted….
Statistical information needed are:
G - Trade in fish and fish products (by main species and main
partners).
H - Government financial transfers relating to the marine capture,
aquaculture and processing sectors.
J - Status of fish stock
In broad terms, the PSR framework to aims to identify the pressure
on the environment from human and economic activities, which
lead to changes in the state or environmental conditions that prevail
as a result of that pressure, and may provoke responses by society
to change the pressures and the state of the environment.
16. Fisheries Indicators and data sources conted….
Source: “Economic and Social Sustainability Indicators for
Fisheries” study
References
FAO (1999), Indicators for Sustainable Development of Marine
Capture Fisheries, Technical Guidelines for Responsible Fisheries
No. 8, Rome.
Hilborn, R. and C.J. Walters (1992), Quantitative Fisheries Stock
Assessment: Choice, Dynamics and Uncertainty, Chapman and
Hall, New York.