Accelerometers
Accelerometers are devices that produce voltage signals proportional to the acceleration experienced. There are several techniques for converting acceleration to an electrical signal. The most general technique is described first and more recent techniques will be considered later.
This slide contains information about two type of accelerometer :- 1. Seismic Accelerometer 2 :- Displacement type accelerometer.
it contains working and construction.
This presentation explains about the introduction of Bode Plot, advantages of bode plot and also steps to draw Bode plot (Magnitude plot and phase plot). It explains basic or key factors used for drawing Bode plot. It also explains how to determine Magnitude, phase and slope for basic factors. It also explains how to determine stability by using Bode Plot and also how to determine Gain Crossover Frequency and Phase Crossover Frequency, Gain Margin and Phase Margin. It also explains drawing Bode plot with an example and also determines stability by using Bode Plot and also determines Gain Crossover Frequency and Phase Crossover Frequency, Gain Margin and Phase Margin.
This presentation content various types of strain gauges, derivation of gauge factor.
Various course having subject as instrumentation, measuring devices, contenting strain measurement as a topic so introduction to strain gauge can help to understand the topic.
In this u will study about
1.Working Principle
2.Parameter for CTT
3.Applications (in details)
4.Advantages
5.Disadvantages
of Capacitive Type Transducer
This article provides an introduction to the fundamental of Sensors and Transducers. It illustrates the different classifications of sensors and transducers. Explains capacitive, resistive and inductive transducers in brief. Also shows the examples under these types of transducers.
Data Acquisition System
Topics:Need of Data Acquisition System, DAQ Module, Sensors, Signal conditioning, DAQ hardware, DAQ software, DAQ processors, Advantages & Disadvantages.
This is one of a type of Analog to Digital Converter (ADC).
Through this presentation, you will have a clear view of how an ADC works. This one specifies one of the types of Analog to Digital Convertor.
This presentation is all about the micrometer screw gauge. First the presentation explains about the basics (parts, special definitions and errors) of a micrometer and finally , using example readings, explains as to how a measurement can be taken.
Dimensional Effect on Engineering Systems & Clean Room & ClassificationSamiran Tripathi
The Presentation is divided in two halves: the first half is dimensional effect on engineering systems and the second half deals with the basics of clean room and its classification
- Basic overview of transmission line analysis
-How transmission line analysis differs from basic circuit analysis
- How distributed circuit element differs from Lumped elements
-Links to be referred for Smith Chart
"Reduction of uncertainties associated to the dynamic response of a ship unlo...TRUSS ITN
Here, the TRUSS (Training in Reducing Uncertainty in Structural Safety) ITN (Innovative Training Network) Horizon 2020 project (http://trussitn.eu, 2015-19) demonstrates how the accuracy of residual life assessment predictions can be improved by achieving a good agreement between measured and predicted dynamic responses of a crane structure. Existing records of measured strain data are often missing information such as the weight of the payload, the hoisting speed and acceleration that are relevant for structural assessment purposes. This paper aims to reduce uncertainties associated with the recorded data in an aged grab ship unloader by comparing measured and non-linear transient finite element analyses results for a loading/unloading cycle. The speed pattern is determined from a best match to the measured record. The moving load consisting of ‘trolley + grab + payload’ is modelled with parameters that are derived from minimizing differences between measured and simulated responses. The determination of these loading parameters is central to accurately assess the remaining life of ship unloaders.
Age of Information in an URLLC-enabled Decode-and-Forward Wireless Communicat...Chathuranga Basnayaka
Age of Information (AoI) measures the freshness of data in mission critical Internet-of-Things (IoT) applications i.e., industrial internet, intelligent transportation systems etc. In this paper, a new system model is proposed to estimate the average AoI (AAoI) in an ultra-reliable low latency communication (URLLC) enabled wireless communication system with decode-and-forward relay scheme over the quasi-static Rayleigh block fading channels. Short packet communication scheme is used to meet both reliability and latency requirements of the proposed wireless network. By resorting finite block length information theory, queuing theory and stochastic processes, a closed-form expression for AAoI is obtained. Finally, the impact of the system parameters, such as update generation rate, block length and block length allocation factor on the AAoI are investigated. All results are validated by the numerical results. Index Terms-Age-of-Information, finite block length regime, latency, reliability, ultra-reliable low latency communications (URLLC) and 5GB.
Physical Layer Redesign for Unmanned Aerial Vehicle (UAV) Communication in 5GChathuranga Basnayaka
Unmanned aerial vehicles (UAVs) are expected to be an important component of thenext generation of mobile networks because of its low cost and flexible connectiv-ity. Telecommunication organizations are currently exploring possibilities for servingUAVs with existing and further cellular network and industries beginning to trialearly prototypes of the cellular connected UAV while scholars are in full swing intro-ducing mathematical and algorithmic solutions to address interesting new problemsarising from the cellular connected UAV communication system. Compared to theconventional mobile communication system with terrestrial users, cellular- connectedUAV communication possesses substantially different characteristics that present newresearch challenges as well as opportunities. Also, most of the research on cellular -connected UAV are still at initial stages. As a result, there are only a few simulationsand experimental results available. Because of that, the objective of this research isa redesign physical layer of unmanned aerial vehicle communication system to alignwith the fifth generation cellular network technology
PREFACE
I had my training experience from 04th January 2016 to 27th March 2016 at Mobitel (Private) Limited. Here in this report I present the experience, knowledge, skills I had during the training period.
The report contains three chapters. The first chapter contains an introduction to Mobitel (Private) Limited, company strategy and organizational structure. The second chapter contains the training experience, information on telecommunication industry and equipment, project work and assignments that I involved during the training period. Next chapter contains the management structure of Mobitel (Private) Limited. And the summery and conclusion were included in the last chapter.
EE5317: Gyroscopes
Gyros are devices which rely on inertial measurements to measure changes in the orientation of an object. When gyros are combined with accelerometers, all the parameters necessary to determine the position and orientation of an object are available. A combined unit called an “Inertial Measurement Unit” is a common component of aircraft, missiles and other valuable objects whose trajectory needs to be determined by indirect means.
AcousticTransducers
Transducers are devices that convert energy in one form to another. In acoustics we are mainly concerned with conversion of acoustic energy to electrical energy or vice versa.
Acoustic waves: Acoustic waves are pressure waves. They are different from Electromagnetic (EM) waves in that they need a medium to propagate. The waves propagates by induced vibrations in the medium. Therefore acoustic waves do not propagate in a vacuum unlike EM waves.
Acoustic wave propagation in air: Acoustic waves propagate in air when microscopically induced oscillations in air particles pass on their energy to neighbouring air particles which in turn will induce microscopic oscillations in their neighbouring air particles
Industrial Training at Shahjalal Fertilizer Company Limited (SFCL)MdTanvirMahtab2
This presentation is about the working procedure of Shahjalal Fertilizer Company Limited (SFCL). A Govt. owned Company of Bangladesh Chemical Industries Corporation under Ministry of Industries.
We have compiled the most important slides from each speaker's presentation. This year’s compilation, available for free, captures the key insights and contributions shared during the DfMAy 2024 conference.
HEAP SORT ILLUSTRATED WITH HEAPIFY, BUILD HEAP FOR DYNAMIC ARRAYS.
Heap sort is a comparison-based sorting technique based on Binary Heap data structure. It is similar to the selection sort where we first find the minimum element and place the minimum element at the beginning. Repeat the same process for the remaining elements.
Student information management system project report ii.pdfKamal Acharya
Our project explains about the student management. This project mainly explains the various actions related to student details. This project shows some ease in adding, editing and deleting the student details. It also provides a less time consuming process for viewing, adding, editing and deleting the marks of the students.
Overview of the fundamental roles in Hydropower generation and the components involved in wider Electrical Engineering.
This paper presents the design and construction of hydroelectric dams from the hydrologist’s survey of the valley before construction, all aspects and involved disciplines, fluid dynamics, structural engineering, generation and mains frequency regulation to the very transmission of power through the network in the United Kingdom.
Author: Robbie Edward Sayers
Collaborators and co editors: Charlie Sims and Connor Healey.
(C) 2024 Robbie E. Sayers
Saudi Arabia stands as a titan in the global energy landscape, renowned for its abundant oil and gas resources. It's the largest exporter of petroleum and holds some of the world's most significant reserves. Let's delve into the top 10 oil and gas projects shaping Saudi Arabia's energy future in 2024.
Immunizing Image Classifiers Against Localized Adversary Attacksgerogepatton
This paper addresses the vulnerability of deep learning models, particularly convolutional neural networks
(CNN)s, to adversarial attacks and presents a proactive training technique designed to counter them. We
introduce a novel volumization algorithm, which transforms 2D images into 3D volumetric representations.
When combined with 3D convolution and deep curriculum learning optimization (CLO), itsignificantly improves
the immunity of models against localized universal attacks by up to 40%. We evaluate our proposed approach
using contemporary CNN architectures and the modified Canadian Institute for Advanced Research (CIFAR-10
and CIFAR-100) and ImageNet Large Scale Visual Recognition Challenge (ILSVRC12) datasets, showcasing
accuracy improvements over previous techniques. The results indicate that the combination of the volumetric
input and curriculum learning holds significant promise for mitigating adversarial attacks without necessitating
adversary training.
Cosmetic shop management system project report.pdfKamal Acharya
Buying new cosmetic products is difficult. It can even be scary for those who have sensitive skin and are prone to skin trouble. The information needed to alleviate this problem is on the back of each product, but it's thought to interpret those ingredient lists unless you have a background in chemistry.
Instead of buying and hoping for the best, we can use data science to help us predict which products may be good fits for us. It includes various function programs to do the above mentioned tasks.
Data file handling has been effectively used in the program.
The automated cosmetic shop management system should deal with the automation of general workflow and administration process of the shop. The main processes of the system focus on customer's request where the system is able to search the most appropriate products and deliver it to the customers. It should help the employees to quickly identify the list of cosmetic product that have reached the minimum quantity and also keep a track of expired date for each cosmetic product. It should help the employees to find the rack number in which the product is placed.It is also Faster and more efficient way.
Hybrid optimization of pumped hydro system and solar- Engr. Abdul-Azeez.pdffxintegritypublishin
Advancements in technology unveil a myriad of electrical and electronic breakthroughs geared towards efficiently harnessing limited resources to meet human energy demands. The optimization of hybrid solar PV panels and pumped hydro energy supply systems plays a pivotal role in utilizing natural resources effectively. This initiative not only benefits humanity but also fosters environmental sustainability. The study investigated the design optimization of these hybrid systems, focusing on understanding solar radiation patterns, identifying geographical influences on solar radiation, formulating a mathematical model for system optimization, and determining the optimal configuration of PV panels and pumped hydro storage. Through a comparative analysis approach and eight weeks of data collection, the study addressed key research questions related to solar radiation patterns and optimal system design. The findings highlighted regions with heightened solar radiation levels, showcasing substantial potential for power generation and emphasizing the system's efficiency. Optimizing system design significantly boosted power generation, promoted renewable energy utilization, and enhanced energy storage capacity. The study underscored the benefits of optimizing hybrid solar PV panels and pumped hydro energy supply systems for sustainable energy usage. Optimizing the design of solar PV panels and pumped hydro energy supply systems as examined across diverse climatic conditions in a developing country, not only enhances power generation but also improves the integration of renewable energy sources and boosts energy storage capacities, particularly beneficial for less economically prosperous regions. Additionally, the study provides valuable insights for advancing energy research in economically viable areas. Recommendations included conducting site-specific assessments, utilizing advanced modeling tools, implementing regular maintenance protocols, and enhancing communication among system components.
Hybrid optimization of pumped hydro system and solar- Engr. Abdul-Azeez.pdf
Accelerometers 2015
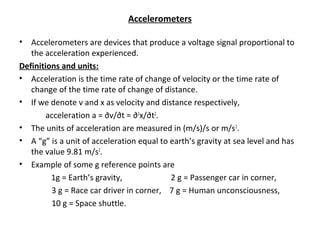
1. Accelerometers
• Accelerometers are devices that produce a voltage signal proportional to
the acceleration experienced.
Definitions and units:
• Acceleration is the time rate of change of velocity or the time rate of
change of the time rate of change of distance.
• If we denote v and x as velocity and distance respectively,
acceleration a = ∂v/∂t = ∂2
x/∂t2
.
• The units of acceleration are measured in (m/s)/s or m/s2
.
• A “g” is a unit of acceleration equal to earth’s gravity at sea level and has
the value 9.81 m/s2
.
• Example of some g reference points are
1g = Earth’s gravity, 2 g = Passenger car in corner,
3 g = Race car driver in corner, 7 g = Human unconsciousness,
10 g = Space shuttle.
2. • The most general approach to acceleration measurement is to take
advantage of Newton’ law,
• which states that any mass m that undergoes an acceleration a is
responding to a force given by F = ma.
• The most general way to take advantage of this force is to suspend a mass
on a linear spring from a frame which surrounds the mass as shown.
Frame
m
mass
spring
k
k
damping
b
x
X
sensor
3. • b denotes damping introduced to the system
• When the frame is shaken, it begins to move, pulling the mass along with
it.
• If the mass is to undergo the same acceleration as the frame, there will be
a force exerted on the mass, which will lead to an elongation of the
spring.
• Any type of displacement transducer, such as a capacitive transducer, can
be used to measure this deflection.
Frame
m
mass
spring
k
k
damping
b
x
X
sensor
4. • Let X denote the position of the frame and x the position of the mass.
• b denotes damping introduced to the system and k the stiffness
constant for the spring.
• For the case shown in the Figure, the sum of the forces on the mass are
equal to the acceleration of the mass and given by ,
k (X-x) + b d (X-x) = m d2
x
dt dt2
Frame
m
mass
spring
k
k
damping
b
x
X
sensor
5. k (X-x) + b d (X-x) = m d2
x
dt dt2
• Take Z = X-x or x = X - Z, then
m d2
X/dt2
= m d2
Z/dt2
+ kZ + b dZ/dt.
• Since X is the position of the frame, we impose an acceleration on this
problem by forcing X to take the form X = X0eiωt
.
• We also assume that all the time varying quantities also oscillate, so
Z = Z0eiωt
.
Substituting we have
-mω2
X0eiωt
= -mω2
Z0eiωt
+ kZ0eiωt
+ iωbZ0eiωt
.
6. • If we assign
ω0 = (k/m)½
ζ = b/[2(km)½
] the damping ratio
(another definition of the damping term)
A0 = -ω2
X0
and Substitute and rearrange,
Z0 = -A0 / [ω2
– ω0
2
- i2ωω0ζ].
7. Z0 = -A0 / [ω2
– ω0
2
- i2ωω0ζ]
• There are three regions for this equation:
(1) If b = 0 (no damping),
Z0 will be infinite for ω = ω0 .
This means that the signal at the resonance of an undamped accelerometer
can lead to infinitely large signals. Thus accelerometer designers generally
impose finite damping on the system.
(2) If ω < ω0,
this expression can be simplified to (assuming the ω0
2
term is much greater
than the other terms in the denominator) as,
Z0 = A/ ω0
2
= -ω2
X0/ω0
2
In this case, the displacement of the mass is proportional to the
acceleration of the frame, and is the response needed for an accelerometer.
8. (3) If ω > ω0 , the expression simplifies to: Z0 = X0 .
This is the case for high frequency signals, during which the mass
remains stationery, and the accelerometer frame shakes around it. In
this case, the displacement between the mass and the frame is the same
size as the motion of the frame. This mode of operation is generally
referred to as the ‘seismometer mode’. Seismometers are instruments
that measure ground motion rather than ground acceleration.
1.0
1.0
2.0
2.0
3.0
3.0
4.0
4.0 5.0
ω/ω0
x0
/X0
0
b=
0
0.25
0.5
0.75
1
Accelerometer Seismometer
Figure 2
9. • Thus the general accelerometer consists of a mass, a spring and a
displacement transducer.
• The overall performance of an accelerometer is generally limited by the
mechanical characteristics of the spring (linearity, dynamic range, cross-
axis sensitivity) and the sensitivity of the displacement transducer
10. • Recent advances in microelectronic engineering have given us a class of
devices known as Micro ElectroMechanical Systems, generally described
by the acronym MEMS. The dimensions of these devices are in
micrometers (microns).
• The most common MEMS accelerometer is the ADXL50.
• The ADXL50 is based on differential capacitance changes due to changes
in acceleration.
• The principle of operation of the device is still based on the General
Accelerometer described above.
11. Capacitive Sensing
• Capacitance measurement can be used to detect the motion of a sensor element.
• A simple example would involve the motion of one electrode in a plane parallel to
the electrodes as shown in Fig 1.
• Electrodes dimensions are length L and width W.
• If one electrode moves laterally a distance x,
the capacitance changes from εε0LW/d to εε0(L-x)W/d.
• Thus the capacitance changes linearly with displacement.
• To implement such a sensor, it is necessary to guarantee that the lateral motion
does not also affect the separation d between the plates.
• This approach is difficult to use for measurement of very small lateral
displacements.
W
L
d
L
xFig 1
12. • The most common use of capacitive detection for sensors is based on
signals which are coupled to changes in the electrode separation d as
shown in Fig 2.
• A physical signal causes the separation to increase by a small quantity ∆.
• The capacitance changes from εε0A/d to εε0A/ (d+∆)
• The relationship between the displacement and change in capacitance is
now not linear, but for small changes in separation we can approximate
the capacitance by using the Taylor series expansion to give
C = (εε0A/d) [1 -∆/d +½ ∆2
/d2
]
• So for ∆ << d, the capacitance change is linear with respect to
displacement
L
W d
L
d+ΔFig 2
13. • A technique for reducing the effect of the non-linearity is to use a differential
capacitor shown in Fig 3.
• In this case, the capacitance measuring circuit is set up to measure the
difference between the two capacitances which can be expressed as:
∆C = C2 – C1 = εε0A/ (d-∆) - εε0A/ (d+∆)
= εε0A/d [1 +∆/d + ½∆2
/d2
] - εε0A/d [1 -∆/d + ½∆2
/d2
] = εε0A/d [2∆/d]
• In this case the non-linearity associated with the ∆2
/d2
term is subtracted away,
and the first non-linearity appears as a cubic ∆3
/d3
term, which would be much
smaller than the squared term.
• The linearity in capacitor sensors are important as generally, capacitive
measuring techniques are only applied in cases where precision measurement is
necessary.
dd
Δ
C1 C2
Fig 3
14. ADXL50
• Analog Devices ADXL50 is the first commercially available
surface-micromachined accelerometer with integrated signal
processing.
• It measures acceleration in a bandwidth from DC to 1 kHz
with 0.2% linearity, and it outputs a scaled DC voltage.
• It is fabricated on a 9 mm2
chip.
• It also is a force-balance device which uses electrostatic force
to null the acceleration force on the “proof” (seismic) mass,
with advantages in bandwidth, self test and linearity.
15. ADXL50
• The ADXL50 uses an exceptionally small (1mm2
) capacitive
sensor element.
• The full scale range is ±50 g, compatible with automotive
airbag deployment requirements, and the accuracy is 5% over
temperature and power supply extremes.
• It uses a 5 V supply and includes a calibrated high level output
and a self testing feature, at a high volume price of US $5 (or
less).
• A more sensitive version, the ADXL05 is also available,
spanning the range of ±5 g with 0.005g resolution and a
typical nonlinearity of 0.3% full scale.
19. ADXL50 Block Diagram
fixed plate
fixed plate
moving plate
1 MHz
0⁰
1 MHz
180⁰
3.4 V DC
0.2 V DC
demod LPF
built-in test
3M
x0
+
-
E0
Force-balance negative feedback
20. Accelerometers with charge output: Charge Amplifiers
• Accelerometers with charge output generate an output signal
in the range of picocoulombs (pC) with very high impedance.
• To process this signal by standard AC measuring equipment it
needs to be transformed into a low impedance voltage signal.
• Charge amplifiers are used for this purpose.
GND
Sensor
Cc
Cinp
qin
qc qinp uinp
qf Cf
Rf
uout
+
-
21. • The input stage of a charge amplifier features a capacitive
feedback circuit which balances the effect of the applied
charge input signal.
• The feedback signal is then a measure of input charge.
GND
Sensor
Cc
Cinp
qin
qc qinp uinp
qf Cf
Rf
uout
+
-
22. • The input charge qin is applied to the summing point (inverting input) of
the amplifier.
• It is distributed to the cable capacitance Cc, the amplifier input capacitance
Cinp and the feedback capacitor Cf.
• The node equation of the input is therefore,
qin = qc + qinp + qf .
GND
Sensor
Cc
Cinp
qin
qc qinp uinp
qf Cf
Rf
uout
+
-
23. • Using the electrostatic equation q = u C (where u denotes voltage) and
substituting for qc, qinp and qf,
qin = uinp(Cc + Cinp) + ufCfwhere uf is voltage across Cf.
• Since the voltage difference between the inverting and the non-inverting
input of a differential amplifier becomes zero under normal operating
conditions, we can assume that the input voltage of the charge amplifier
uinp will be equal to GND potential.
• With uinp = 0 we can simplify the equation to qin = ufCf
and solving for the output voltage
uout = uf = qin / Cf.
GND
Sensor
Cc
Cinp
qin
qc qinp uinp
qf Cf
Rf
uout
+
-
24. uout = uf = qin / Cf
• This shows that the output of a charge amplifier depends only on the
charge input and feedback capacitance. Input and cable capacitance has
no influence on the output signal.
• This is an important fact when measuring with different cable length and
types.
GND
Sensor
Cc
Cinp
qin
qc qinp uinp
qf Cf
Rf
uout
+
-