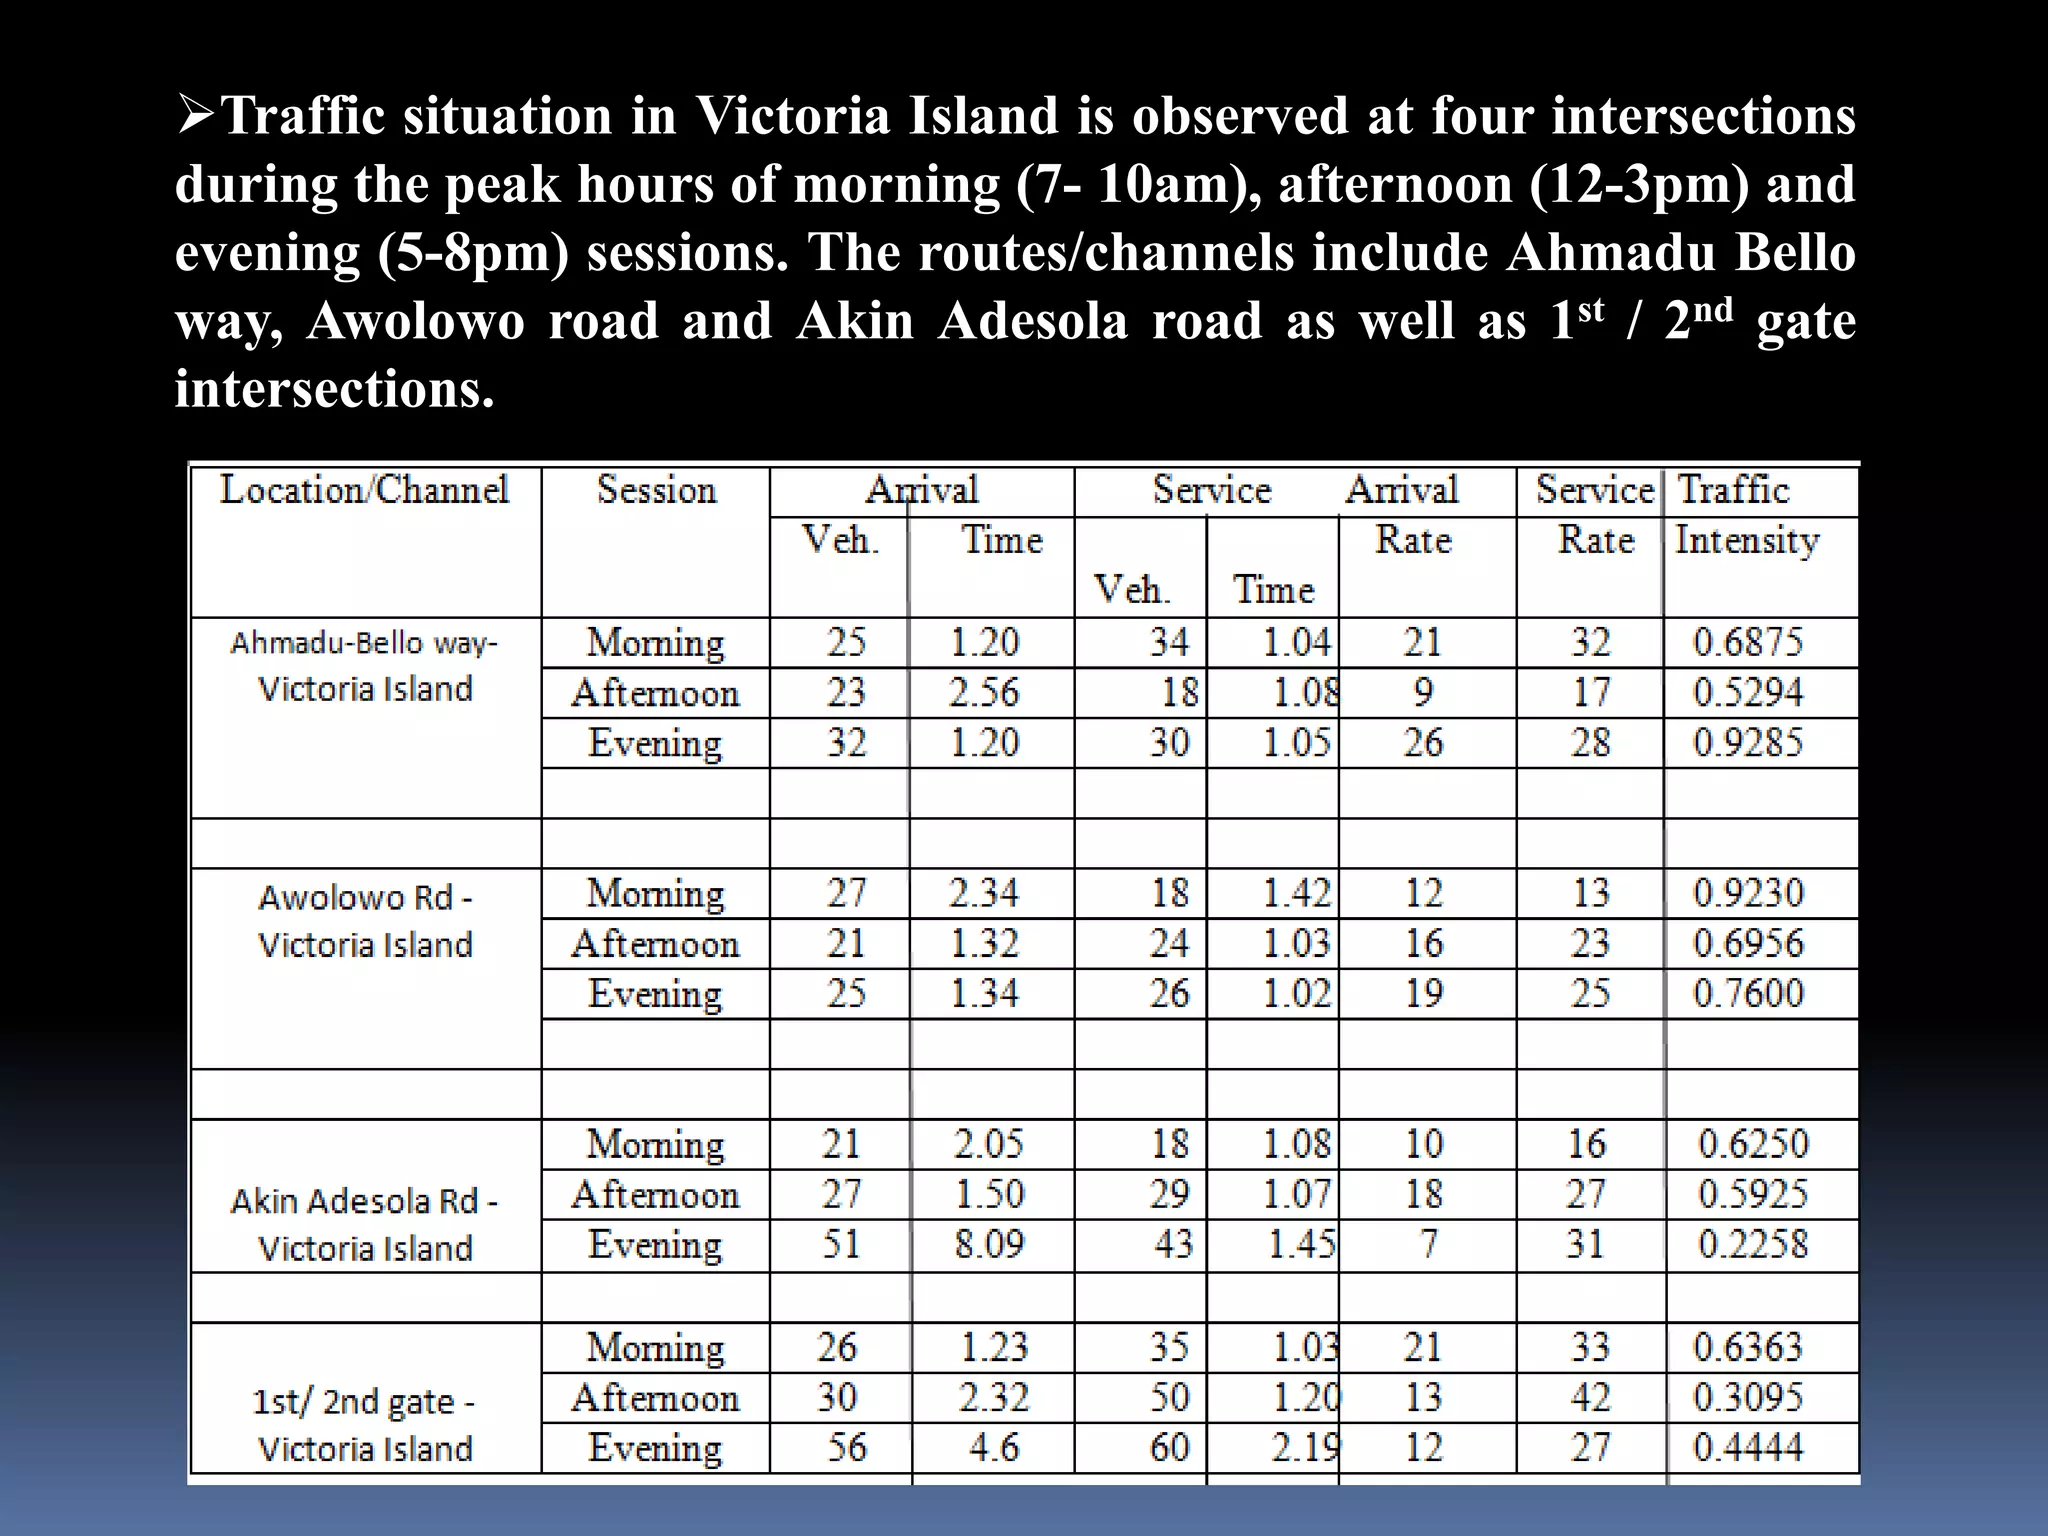
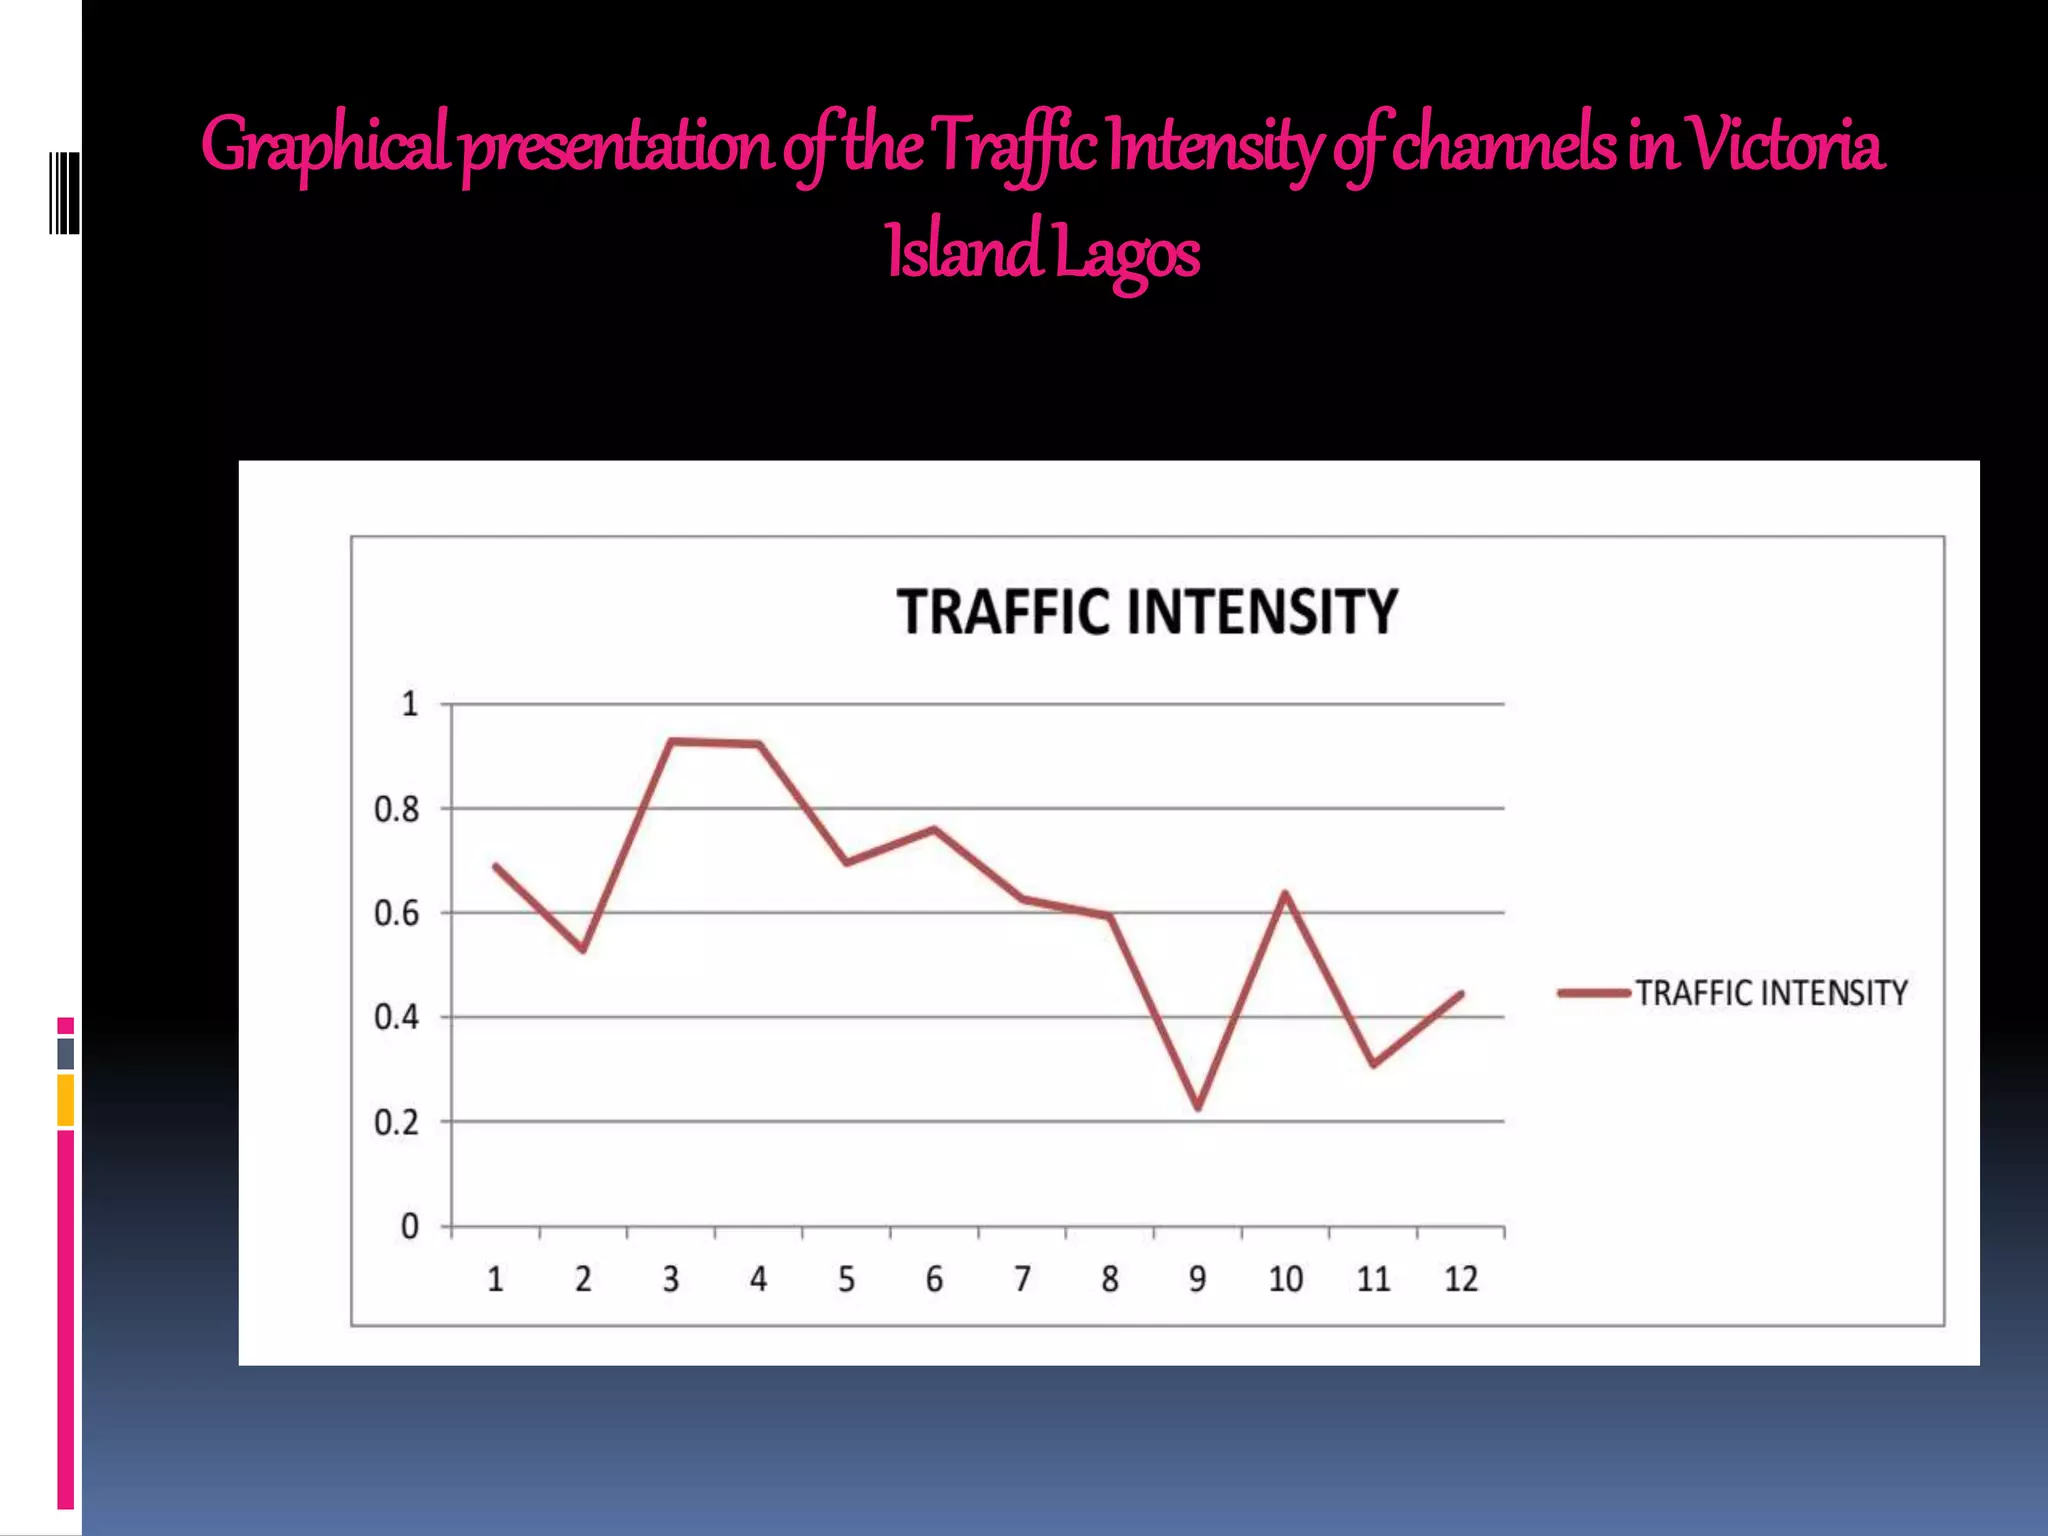
This document discusses the application of queuing theory to traffic management. It presents results from a study of traffic intensity at four intersections in Victoria Island, Lagos during morning, afternoon and evening peak periods. Queuing models were used to determine arrival and service rates, from which traffic intensity was calculated. Morning and evening sessions saw the highest intensities, especially on two roads. The analysis confirms queuing theory can help minimize congestion by optimizing traffic light times during peak periods. Proper road design considering separate lanes, flyovers and parking restrictions can also help ensure smooth traffic flow.
This a project on generation of a FCFS , single server queuing theory model followed by stats to analyze the queue length, customer distribution etc. & various possible cases to improve
Multimodal transport is essentially an international through-transport combination with various modes of transport such as ship, rail, truck, airplane, etc., primarily through the use of containers.
Multimodal Transport: Where the carrier organising the transport takes responsibility for the entire door-to-door transport and issues a multimodal transport document.
A multimodal transport operator (MTO) acts as a principal and therefore as a “carrier”, because the MTO contracts with the shipper to carry goods by one or more modes of transport as may be necessary. The MTO has accepted total responsibility and liability to perform the transport contract; he has become the sole interface point for the shipper’s transport function.
The ARIMA analytical method predicts future values of a time series using a linear combination of past values and a series of errors. It is suitable for instances when data is stationary/non stationary and is univariate, with any type of data pattern. It produces accurate, dependable forecasts for short-term planning, and provides forecasted values of target variables for user-specified periods to illustrate results for planning, production, sales and other factors.
Crossrail - Integrated Assurance, Chris Sexton, APM Assurance Specific Interest Group, Integrated Assurance - how to achieve it real organisations conference
A Review on Performance of Toll Plaza by using Queuing Theoryijtsrd
One of the key problems in the study of any stream of traffic system is the analysis of delay. Delay is a more delicate concept. It may be well defined as the difference between the actual travel time on a given section and some ideal travel time of that section. This raises the question as what is the ideal travel time. In practice, the ideal travel time chosen will depend on the situation. There are two particular travel times that seem best suited as benchmarks for assessment with the actual performance of the system. These are the travel times under free flow conditions and travel time at capacity. Most recent research has found that for highway systems, there is reasonably little difference between these two speeds. The analysis of delay normally focuses on the delay when demand exceeds its capacity. Such delay is known as queuing delay, and may be studied by means of queuing theory. This theory involves the analysis which is known as a queuing system, which is composed of a server, a stream of customers who demand service, and a queue or line of customers waiting to be served. A. N. V. Ravindra | Mr. S. Siva Gowri Prasad "A Review on Performance of Toll Plaza by using Queuing Theory" Published in International Journal of Trend in Scientific Research and Development (ijtsrd), ISSN: 2456-6470, Volume-3 | Issue-6 , October 2019, URL: https://www.ijtsrd.com/papers/ijtsrd28068.pdf Paper URL: https://www.ijtsrd.com/engineering/transport-engineering/28068/a-review-on-performance-of-toll-plaza-by-using-queuing-theory/a-n-v-ravindra
International Journal of Mathematics and Statistics Invention (IJMSI) inventionjournals
International Journal of Mathematics and Statistics Invention (IJMSI) is an international journal intended for professionals and researchers in all fields of computer science and electronics. IJMSI publishes research articles and reviews within the whole field Mathematics and Statistics, new teaching methods, assessment, validation and the impact of new technologies and it will continue to provide information on the latest trends and developments in this ever-expanding subject. The publications of papers are selected through double peer reviewed to ensure originality, relevance, and readability. The articles published in our journal can be accessed online.
Waiting Line Model is one of the decision line model.Waiting Line Model is one of the decision line model.Waiting Line Model is one of the decision line model.Waiting Line Model is one of the decision line model.
Solving Of Waiting Lines Models in the Bank Using Queuing Theory Model the Pr...IOSR Journals
Waiting lines and service systems are important parts of the business world. In this article we describe several common queuing situations and present mathematical models for analyzing waiting lines following certain assumptions. Those assumptions are that (1) arrivals come from an infinite or very large population, (2) arrivals are Poisson distributed, (3) arrivals are treated on a FIFO basis and do not balk or renege, (4) service times follow the negative exponential distribution or are constant, and (5) the average service rate is faster than the average arrival rate. The model illustrated in this Bank for customers on a level with service is the multiple-channel queuing model with Poisson Arrival and Exponential Service Times (M/M/S). After a series of operating characteristics are computed, total expected costs are studied, total costs is the sum of the cost of providing service plus the cost of waiting time. Finally we find the total minimum expected cost.
Queuing is the common activity of customers or people to avail the desired service, which could be processed or distributed one at a time. Bank ATMs would avoid losing their customers due to a long wait on the line. The bank initially provides one ATM in every branch. But, one ATM would not serve a purpose when customers withdraw to use ATM and try to use other bank ATM. Thus the service time needs to be improved to maintain the customers. This paper shows that the queuing theory used to solve this problem. We obtain the data from a bank ATM in a city. We then derive the arrival rate, service rate, utilization rate, waiting time in the queue and the average number of customers in the queue based on the data using Little’s theorem and M/M/I queuing model. The arrival rate at a bank ATM on Sunday during banking time is 1 customer per minute (cpm) while the service rate is 1.50 cpm. The average number of customer in the ATM is 2 and the utilization period is 0.70. We conclude the paper by discussing the benefits of performing queuing analysis to a busy ATM.
Talks about what is Queuing and its application, practical life usage, with a complex problem statement with its solution. Pre-emptive and non-preemptive queue models and its algorithm.
Queuing theory: What is a Queuing system???
Waiting for service is part of our daily life….
Example:
we wait to eat in restaurants….
We queue up in grocery stores…
Jobs wait to be processed on machine…
Vehicles queue up at traffic signal….
Planes circle in a stack before given permission to land at an airport….
Unfortunately, we can not eliminate waiting time without incurring expenses…
But, we can hope to reduce the queue time to a tolerable levels… so that we can avoid adverse impact….
Why study???? What analytics can be drawn??? Analytics means ---- measures of performance such as
1. Average queue length
2. Average waiting time in the queue
3. Average facility utilization….
Similar to A Study on Queuing Theory and its real Life Applications.pptx (20)
Welcome to TechSoup New Member Orientation and Q&A (May 2024).pdfTechSoup
In this webinar you will learn how your organization can access TechSoup's wide variety of product discount and donation programs. From hardware to software, we'll give you a tour of the tools available to help your nonprofit with productivity, collaboration, financial management, donor tracking, security, and more.
Embracing GenAI - A Strategic ImperativePeter Windle
Artificial Intelligence (AI) technologies such as Generative AI, Image Generators and Large Language Models have had a dramatic impact on teaching, learning and assessment over the past 18 months. The most immediate threat AI posed was to Academic Integrity with Higher Education Institutes (HEIs) focusing their efforts on combating the use of GenAI in assessment. Guidelines were developed for staff and students, policies put in place too. Innovative educators have forged paths in the use of Generative AI for teaching, learning and assessments leading to pockets of transformation springing up across HEIs, often with little or no top-down guidance, support or direction.
This Gasta posits a strategic approach to integrating AI into HEIs to prepare staff, students and the curriculum for an evolving world and workplace. We will highlight the advantages of working with these technologies beyond the realm of teaching, learning and assessment by considering prompt engineering skills, industry impact, curriculum changes, and the need for staff upskilling. In contrast, not engaging strategically with Generative AI poses risks, including falling behind peers, missed opportunities and failing to ensure our graduates remain employable. The rapid evolution of AI technologies necessitates a proactive and strategic approach if we are to remain relevant.
Read| The latest issue of The Challenger is here! We are thrilled to announce that our school paper has qualified for the NATIONAL SCHOOLS PRESS CONFERENCE (NSPC) 2024. Thank you for your unwavering support and trust. Dive into the stories that made us stand out!
Biological screening of herbal drugs: Introduction and Need for
Phyto-Pharmacological Screening, New Strategies for evaluating
Natural Products, In vitro evaluation techniques for Antioxidants, Antimicrobial and Anticancer drugs. In vivo evaluation techniques
for Anti-inflammatory, Antiulcer, Anticancer, Wound healing, Antidiabetic, Hepatoprotective, Cardio protective, Diuretics and
Antifertility, Toxicity studies as per OECD guidelines
The Roman Empire A Historical Colossus.pdfkaushalkr1407
The Roman Empire, a vast and enduring power, stands as one of history's most remarkable civilizations, leaving an indelible imprint on the world. It emerged from the Roman Republic, transitioning into an imperial powerhouse under the leadership of Augustus Caesar in 27 BCE. This transformation marked the beginning of an era defined by unprecedented territorial expansion, architectural marvels, and profound cultural influence.
The empire's roots lie in the city of Rome, founded, according to legend, by Romulus in 753 BCE. Over centuries, Rome evolved from a small settlement to a formidable republic, characterized by a complex political system with elected officials and checks on power. However, internal strife, class conflicts, and military ambitions paved the way for the end of the Republic. Julius Caesar’s dictatorship and subsequent assassination in 44 BCE created a power vacuum, leading to a civil war. Octavian, later Augustus, emerged victorious, heralding the Roman Empire’s birth.
Under Augustus, the empire experienced the Pax Romana, a 200-year period of relative peace and stability. Augustus reformed the military, established efficient administrative systems, and initiated grand construction projects. The empire's borders expanded, encompassing territories from Britain to Egypt and from Spain to the Euphrates. Roman legions, renowned for their discipline and engineering prowess, secured and maintained these vast territories, building roads, fortifications, and cities that facilitated control and integration.
The Roman Empire’s society was hierarchical, with a rigid class system. At the top were the patricians, wealthy elites who held significant political power. Below them were the plebeians, free citizens with limited political influence, and the vast numbers of slaves who formed the backbone of the economy. The family unit was central, governed by the paterfamilias, the male head who held absolute authority.
Culturally, the Romans were eclectic, absorbing and adapting elements from the civilizations they encountered, particularly the Greeks. Roman art, literature, and philosophy reflected this synthesis, creating a rich cultural tapestry. Latin, the Roman language, became the lingua franca of the Western world, influencing numerous modern languages.
Roman architecture and engineering achievements were monumental. They perfected the arch, vault, and dome, constructing enduring structures like the Colosseum, Pantheon, and aqueducts. These engineering marvels not only showcased Roman ingenuity but also served practical purposes, from public entertainment to water supply.
Operation “Blue Star” is the only event in the history of Independent India where the state went into war with its own people. Even after about 40 years it is not clear if it was culmination of states anger over people of the region, a political game of power or start of dictatorial chapter in the democratic setup.
The people of Punjab felt alienated from main stream due to denial of their just demands during a long democratic struggle since independence. As it happen all over the word, it led to militant struggle with great loss of lives of military, police and civilian personnel. Killing of Indira Gandhi and massacre of innocent Sikhs in Delhi and other India cities was also associated with this movement.
Synthetic Fiber Construction in lab .pptxPavel ( NSTU)
Synthetic fiber production is a fascinating and complex field that blends chemistry, engineering, and environmental science. By understanding these aspects, students can gain a comprehensive view of synthetic fiber production, its impact on society and the environment, and the potential for future innovations. Synthetic fibers play a crucial role in modern society, impacting various aspects of daily life, industry, and the environment. ynthetic fibers are integral to modern life, offering a range of benefits from cost-effectiveness and versatility to innovative applications and performance characteristics. While they pose environmental challenges, ongoing research and development aim to create more sustainable and eco-friendly alternatives. Understanding the importance of synthetic fibers helps in appreciating their role in the economy, industry, and daily life, while also emphasizing the need for sustainable practices and innovation.
How to Make a Field invisible in Odoo 17Celine George
It is possible to hide or invisible some fields in odoo. Commonly using “invisible” attribute in the field definition to invisible the fields. This slide will show how to make a field invisible in odoo 17.
2024.06.01 Introducing a competency framework for languag learning materials ...Sandy Millin
http://sandymillin.wordpress.com/iateflwebinar2024
Published classroom materials form the basis of syllabuses, drive teacher professional development, and have a potentially huge influence on learners, teachers and education systems. All teachers also create their own materials, whether a few sentences on a blackboard, a highly-structured fully-realised online course, or anything in between. Despite this, the knowledge and skills needed to create effective language learning materials are rarely part of teacher training, and are mostly learnt by trial and error.
Knowledge and skills frameworks, generally called competency frameworks, for ELT teachers, trainers and managers have existed for a few years now. However, until I created one for my MA dissertation, there wasn’t one drawing together what we need to know and do to be able to effectively produce language learning materials.
This webinar will introduce you to my framework, highlighting the key competencies I identified from my research. It will also show how anybody involved in language teaching (any language, not just English!), teacher training, managing schools or developing language learning materials can benefit from using the framework.
A Study on Queuing Theory and its real Life Applications.pptx
1. A STUDY ON QUEUING THEORY AND ITS
REAL LIFE APPLICATIONS
BY
G.NITHYA .,M.SC.,M.PHIL.,(PH.D)
HEAD AND ASSOCIATE PROFESSOR
DEPARTMENT OF MATHEMATICS
SRI ADI CHUNCHANAGIRIWOMEN’S COLLEGE
CUMBUM.
Mail id : nithyarajkumar15@gmail.com
2. ABSTRACT
In this paper we took a brief look into the basic
concepts, characteristics, models and
formulation of queuing theory along with
examples of the models and applications of
their use. Applications of queuing theory are
found in fields such as traffic control, hospital
management and timeshared computer system
design. We also discuss about Traffic
congestion and how Queuing Theory is applied
in the management of Traffic intensity.
3. QUEUINGTHEORY
The mathematical study of waiting lines or
queues is known as queuing theory. The study
of queues deals with measuring the
phenomenon of waiting lines using
representative measures of performances such
as average queue length, average waiting time
in queue and average facility utilization.
4. CALLINGPOPULATION
The population of potential customers those require
service from system is called calling population. It may be
finite or infinite. System having large calling population is
usually considered as infinite.
Ex: Queuing system of finite population
Cars parked in a garage
waiting to repair
Ex: Queuing system of infinite population
Boxes waiting to be packed in a
factory
5. Arrival Process:
The arrival process for infinite-population models is usually
characterized in terms of inter-arrival times of successive
customers. Arrivals may occur at scheduled times or at random times.
When at random times, the inter arrival times are usually
characterized by a probability distribution and most important model
for random arrival is the Poisson process. In schedule arrival inter-
arrival time of customers are constant.
Service Process:
Service process can be measured by the number of customers served
per some unit of time or the time taken to complete the service.
Once entities have entered to the system they must be served. The
service can be provided in single or batch.
If it is batch, as in the case of arrival the batch size can be fixed or
random.
Service time may be of constant duration or of random duration.
6. Queuing Discipline:
Queue discipline refers to the rule that a server uses to choose the next
customer from the queue when the server completes the service of the
current customer.
Common queue disciplines include First-In-First-Out (FIFO), Last-
In-First-Out (LIFO), Service In Random Order (SIRO), Shortest
Processing Time First (SPT) and service according to Priority (PR).
Queuing Behavior:
Queue behavior refers to the actions of customers while in a queue
waiting for service to begin. Different queue behaviors are
Balking
Reneging
Jockeying
7. Number of Servers:
Servers represent the entity that provides service to the customer. A
system may consist of single server or multiple servers. A system with
multiple servers is able to provide parallel services to the customers.
So a queuing system can be classified according to the number of servers as
Single server queuing system
Multi server queuing system
8. ApplicationsofQueuingTheoryinvariousfields
Bank ATMs:
In ATM, bank customers arrive randomly and the service time i.e., the
time customer takes to do transaction in ATM, is also random. We use
queuing model to derive the arrival rate, service rate, utilization rate,
waiting time in the queue and the average number of customers in the
queue. Queuing can help bank ATM to increase its quality of service, by
anticipating, if there are many customers in the queue.
Hospitals:
Queuing models are used for estimating the waiting time of a patient,
utilization of service, models system design, and models for evaluating
appointment systems. A queuing system helps minimizing the waiting
time of patients and maximizing the utilization of the servers i.e.,
doctors, nurses, hospital beds etc. Queuing is not new but recently
hospitals has begun to use it effectively.
9. Little’sLaw
Little’s Law says that, under steady
state conditions, the average number of
items in a queuing system equals the
average rate at which items arrive
multiplied by the average time that an
item spends in the system.
L=𝜆W
10. UsefulnessofLittle’sLawinPractice
E-mail:
Managing our e-mail is a common and time-consuming daily activity. For
many it is hard to keep up with the volume of messages, let alone provide
timely responses. A student Sue might receive 50 messages each day to
which she must generate a response. Can we easily assess how well this
student handles her e-mail duties?
Indeed we can apply Little’s Law to get a quick sense of how promptly
Sue responds to messages. Suppose that she receives about 50 messages
everyday; then this is the arrival rate: 𝜆 = 50 messages per day. Suppose
we can also track how many messages have yet to be answered. For
instance, suppose that Sue removes a message from her inbox once she has
responded to it. Then the remaining messages in her inbox are the
messages that are waiting to be answered. Over the last semester, the size
of the inbox has varied between one and two hundred messages with an
average of 150 messages. Then we can regard this to be the system queue
length: L = 150 messages. From Little’s Law we immediately have an
estimate of how long it takes Sue to answer a message, on average: W = 3
days.
11. TRAFFICCONGESTION
Congestions are formed due to different reasons like reduced capacity of
road stretch, accidents, overcrowding etc. Traffic congestions are always
frustrating to the road users.
Traffic congestion is a situation on road network which occurs as its use
increases. It is characterized by slower speeds, increased trip times and
queuing of vehicles.
The effect of traffic jam includes commuter’s frustration, vehicle
collision and fuel wastage.
The traffic congestions results in delays. Delay is a more subtle concept.
These delays will surely end up in queues. Queues occur whenever
immediate demand exceeds the capacity to provide a service. Here the
need of application of queuing theory arises.
13. ENVIRONMENTALIMPACTOFROADTRAFFIC
When modeling the environmental impact of road traffic, we can
distinguish between both a static and dynamic impact of infrastructures and
vehicles on emissions and waste.
On the one hand, roads can be considered as a visual intrusion. In addition,
they may cause damage to natural watercourses or threaten the natural
habitat of wildlife.
Vehicles in use produce emissions and noise. Toxic escape in the
atmosphere when fuel tanks are filled, while driving leads to further
emissions (CO2, NO2 and SO2) and dust (concrete, asphalt and rubber
dust).
Traffic flows are a function of both the number of vehicles on the roads and
the vehicle speed, the resulting environmental impact will also be a function
of these parameters.
15. MANAGEMENTOFTRAFFICINTENSITY
Queuing theory is used in minimizing vehicular traffic congestion using
four routes/channels in Victoria Island.
The study also adopts the FIFO (first in first out) approach where the
vehicles are made to line up or queue according to their time of arrival as
customers waiting to be served by a signal of functioning traffic light in a
given channel or location to minimize traffic congestion.
The number of vehicles in each service station for every channel is
counted and the time in minutes noted when waiting to be served and after
being served.
These values are used to derive the arrival and service rates of the
vehicles.
The investigation is based on traffic intensity on some areas in Victoria
Island, Lagos.
16. Traffic situation in Victoria Island is observed at four intersections
during the peak hours of morning (7- 10am), afternoon (12-3pm) and
evening (5-8pm) sessions. The routes/channels include Ahmadu Bello
way, Awolowo road and Akin Adesola road as well as 1st / 2nd gate
intersections.
18. RESULTORANALYSIS
Morning session:
Ahmadu Bello way- Victoria Island:
The arrival and service rates are 21 and 32 respectively and hence the
traffic intensity is 0.6563. This is an indication of a stable traffic situation
but not a very smooth flow of traffic. The mean number of vehicles in the
system (Ls) and queue (Lq) as well as the mean waiting time in the system
(Ws) and queue (Wq) tend to confirm the traffic situation.
Awolowo road– Victoria Island:
The arrival and service rates are 12 and 13 respectively and hence the
traffic intensity is 0.9230 which is almost unity. This is an indication of an
unstable and critical traffic flow. The derived values of Ls, Lq, Ws and Wq
support the traffic situation.
19. Afternoon session:
Ahmadu Bello way – Victoria Island:
The arrival and service rates are 9 and 17 respectively
and hence the traffic intensity is 0.5294. This is an indication
of a stable and smooth flow of traffic. The derived values are
in line with the reported traffic situation.
Awolowo road– Victoria Island:
The arrival and service rates are 16 and 23 respectively
and hence the traffic intensity is 0.6956. This is an indication
of a relatively unstable and unsmooth traffic flow. The
derived values corroborate the reported traffic situation.
20. Evening session:
Ahmadu Bello way–Victoria Island:
The arrival and service rates are 26 and 28 respectively hence the
traffic intensity is 0.9285 which is close to unity. This is an indication of
an unstable and chaotic traffic flow. It is also the worst condition of
traffic when compared to other channels for all sessions. The traffic
situation is buttressed by the derived parameters.
Awolowo road– Victoria Island:
The arrival and service rates are 19 and 25 respectively and hence the
traffic intensity is 0.7600. This is an indication of a relatively stable but
unsmooth traffic flow. The reported traffic situation is validated by the
derived values.
21. CONCLUSION
This study reveals that traffic intensity is highest in the
morning session when commuters are reporting for
work/business and in the evening session at the close of
work/business especially on Awolowo road and Ahmadu
Bello way respectively.
It is therefore necessary to allot more time at intersections
for traffic into such routes in the morning and evening
sessions.
The increase of traffic light time will reduce traffic
intensity which in turn minimizes delays on such
routes/channels at peak periods of morning and evening
sessions.
22. In the design and implementation of road network, designers and
planners should take into consideration some factors that may engender
free flow of traffic. The consideration should include but not limited to
the following factors:
Construction of separate lanes for commercial vehicles with increased
road capacity.
Construction of flyovers for areas prone to traffic congestion.
Construction of service lanes and bye pass to areas with high traffic
intensity.
Installation of parking restriction signs at strategic points along routes
that are prone to traffic congestion. Enforcement of the parking
restriction is necessary to ensure compliance by private and commercial
vehicles.