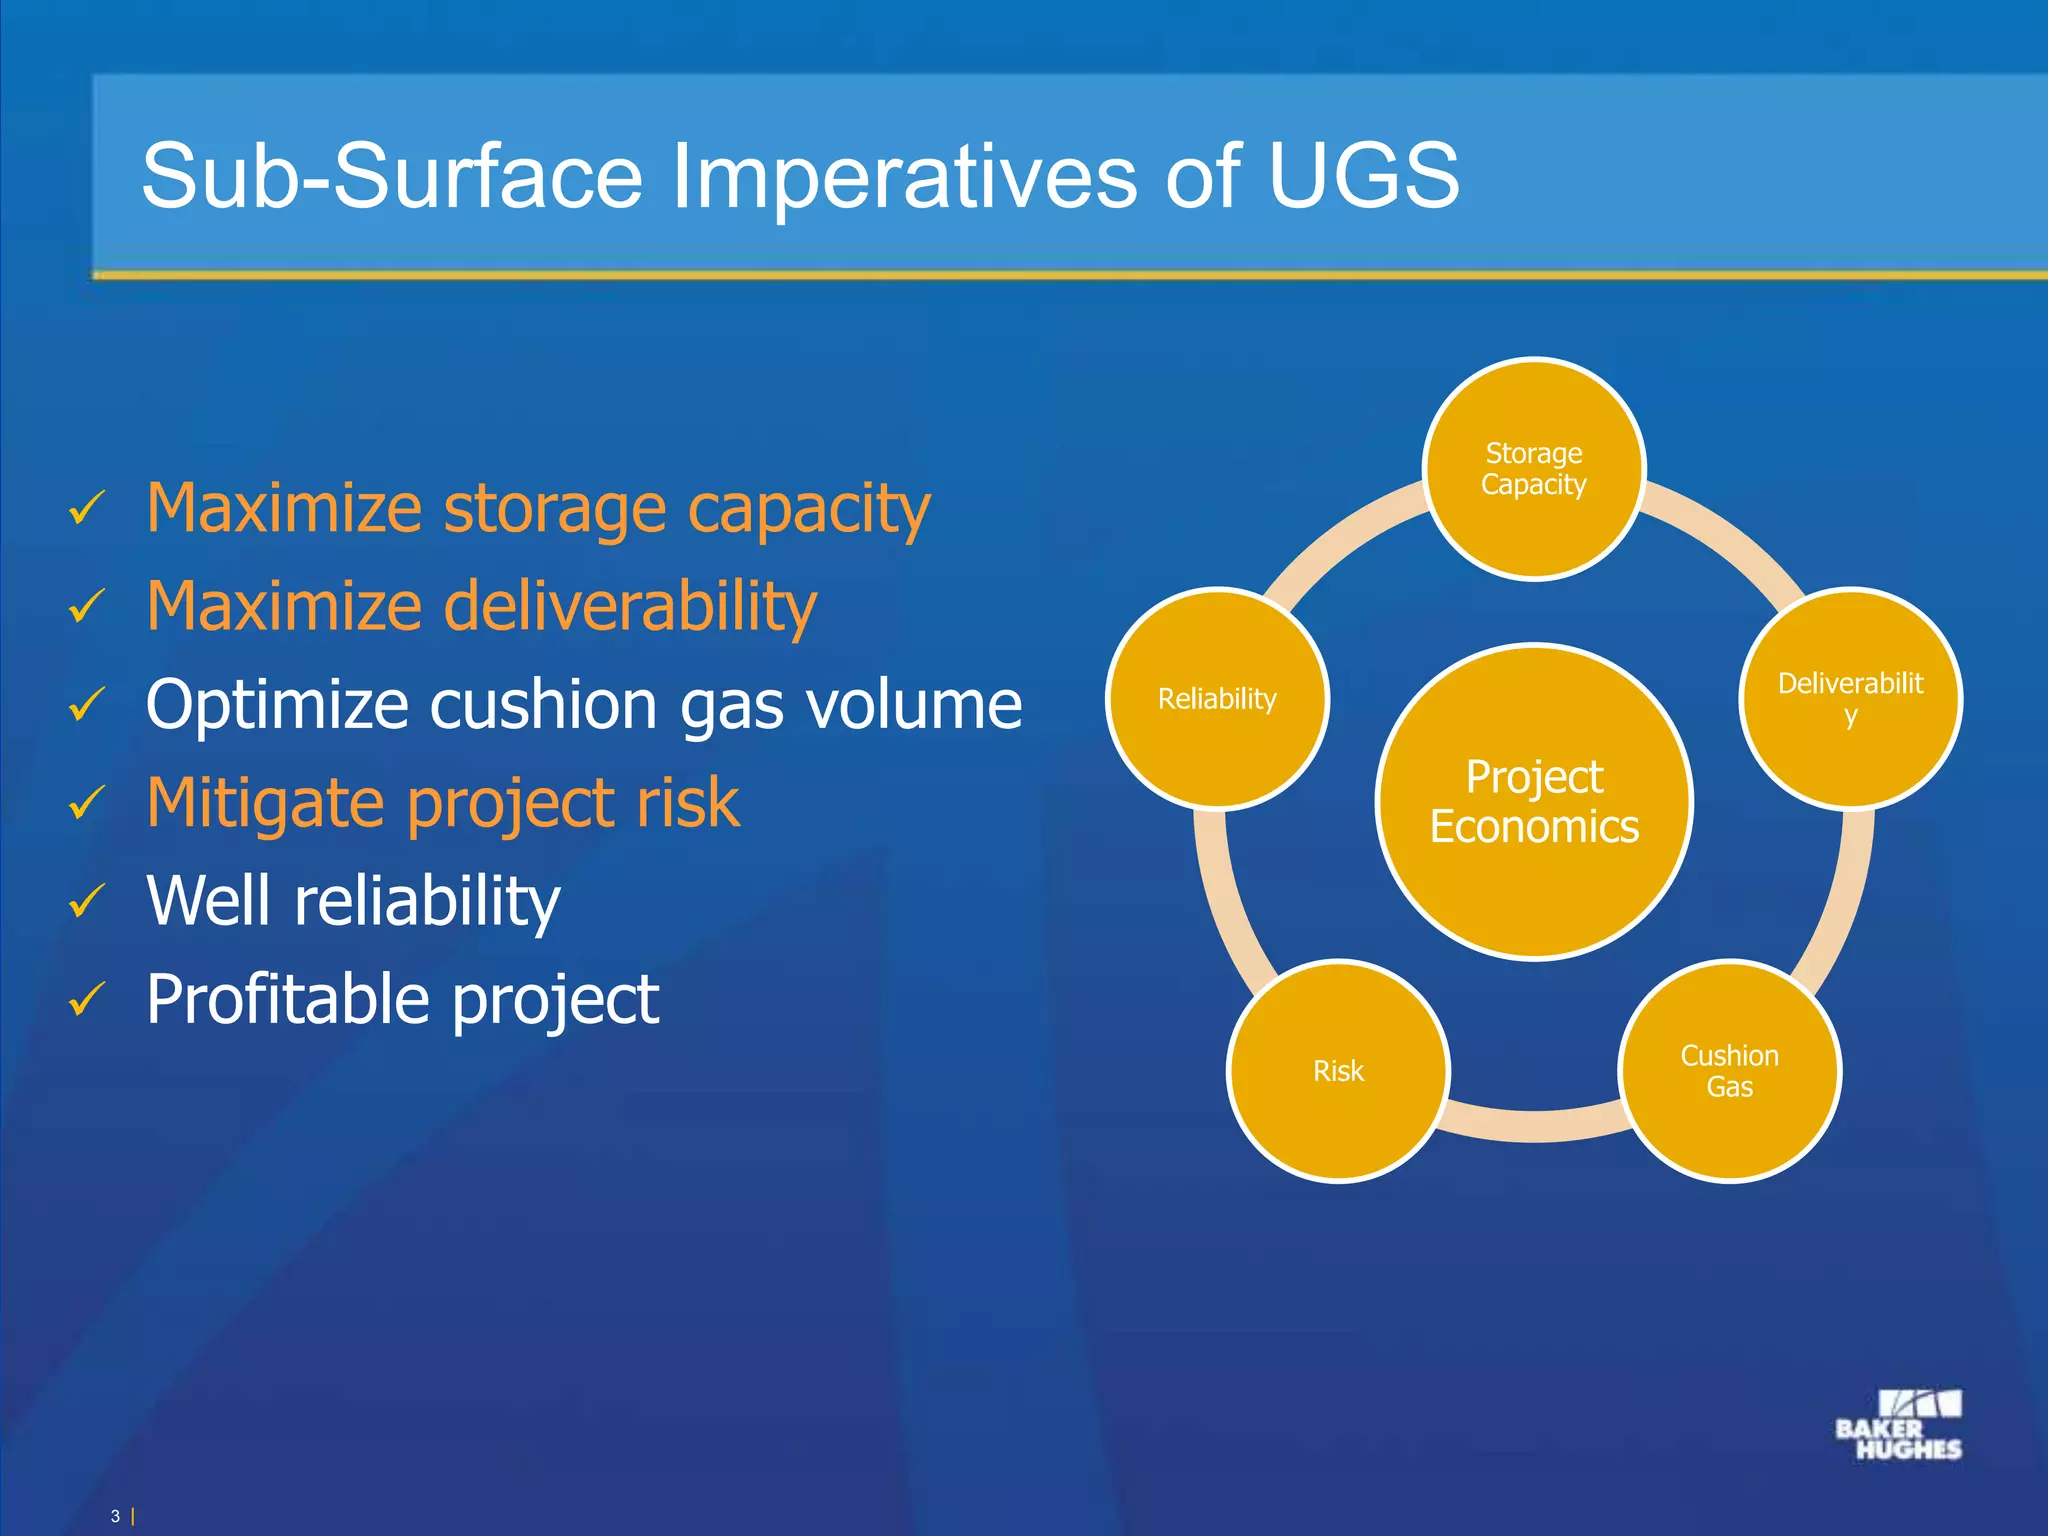
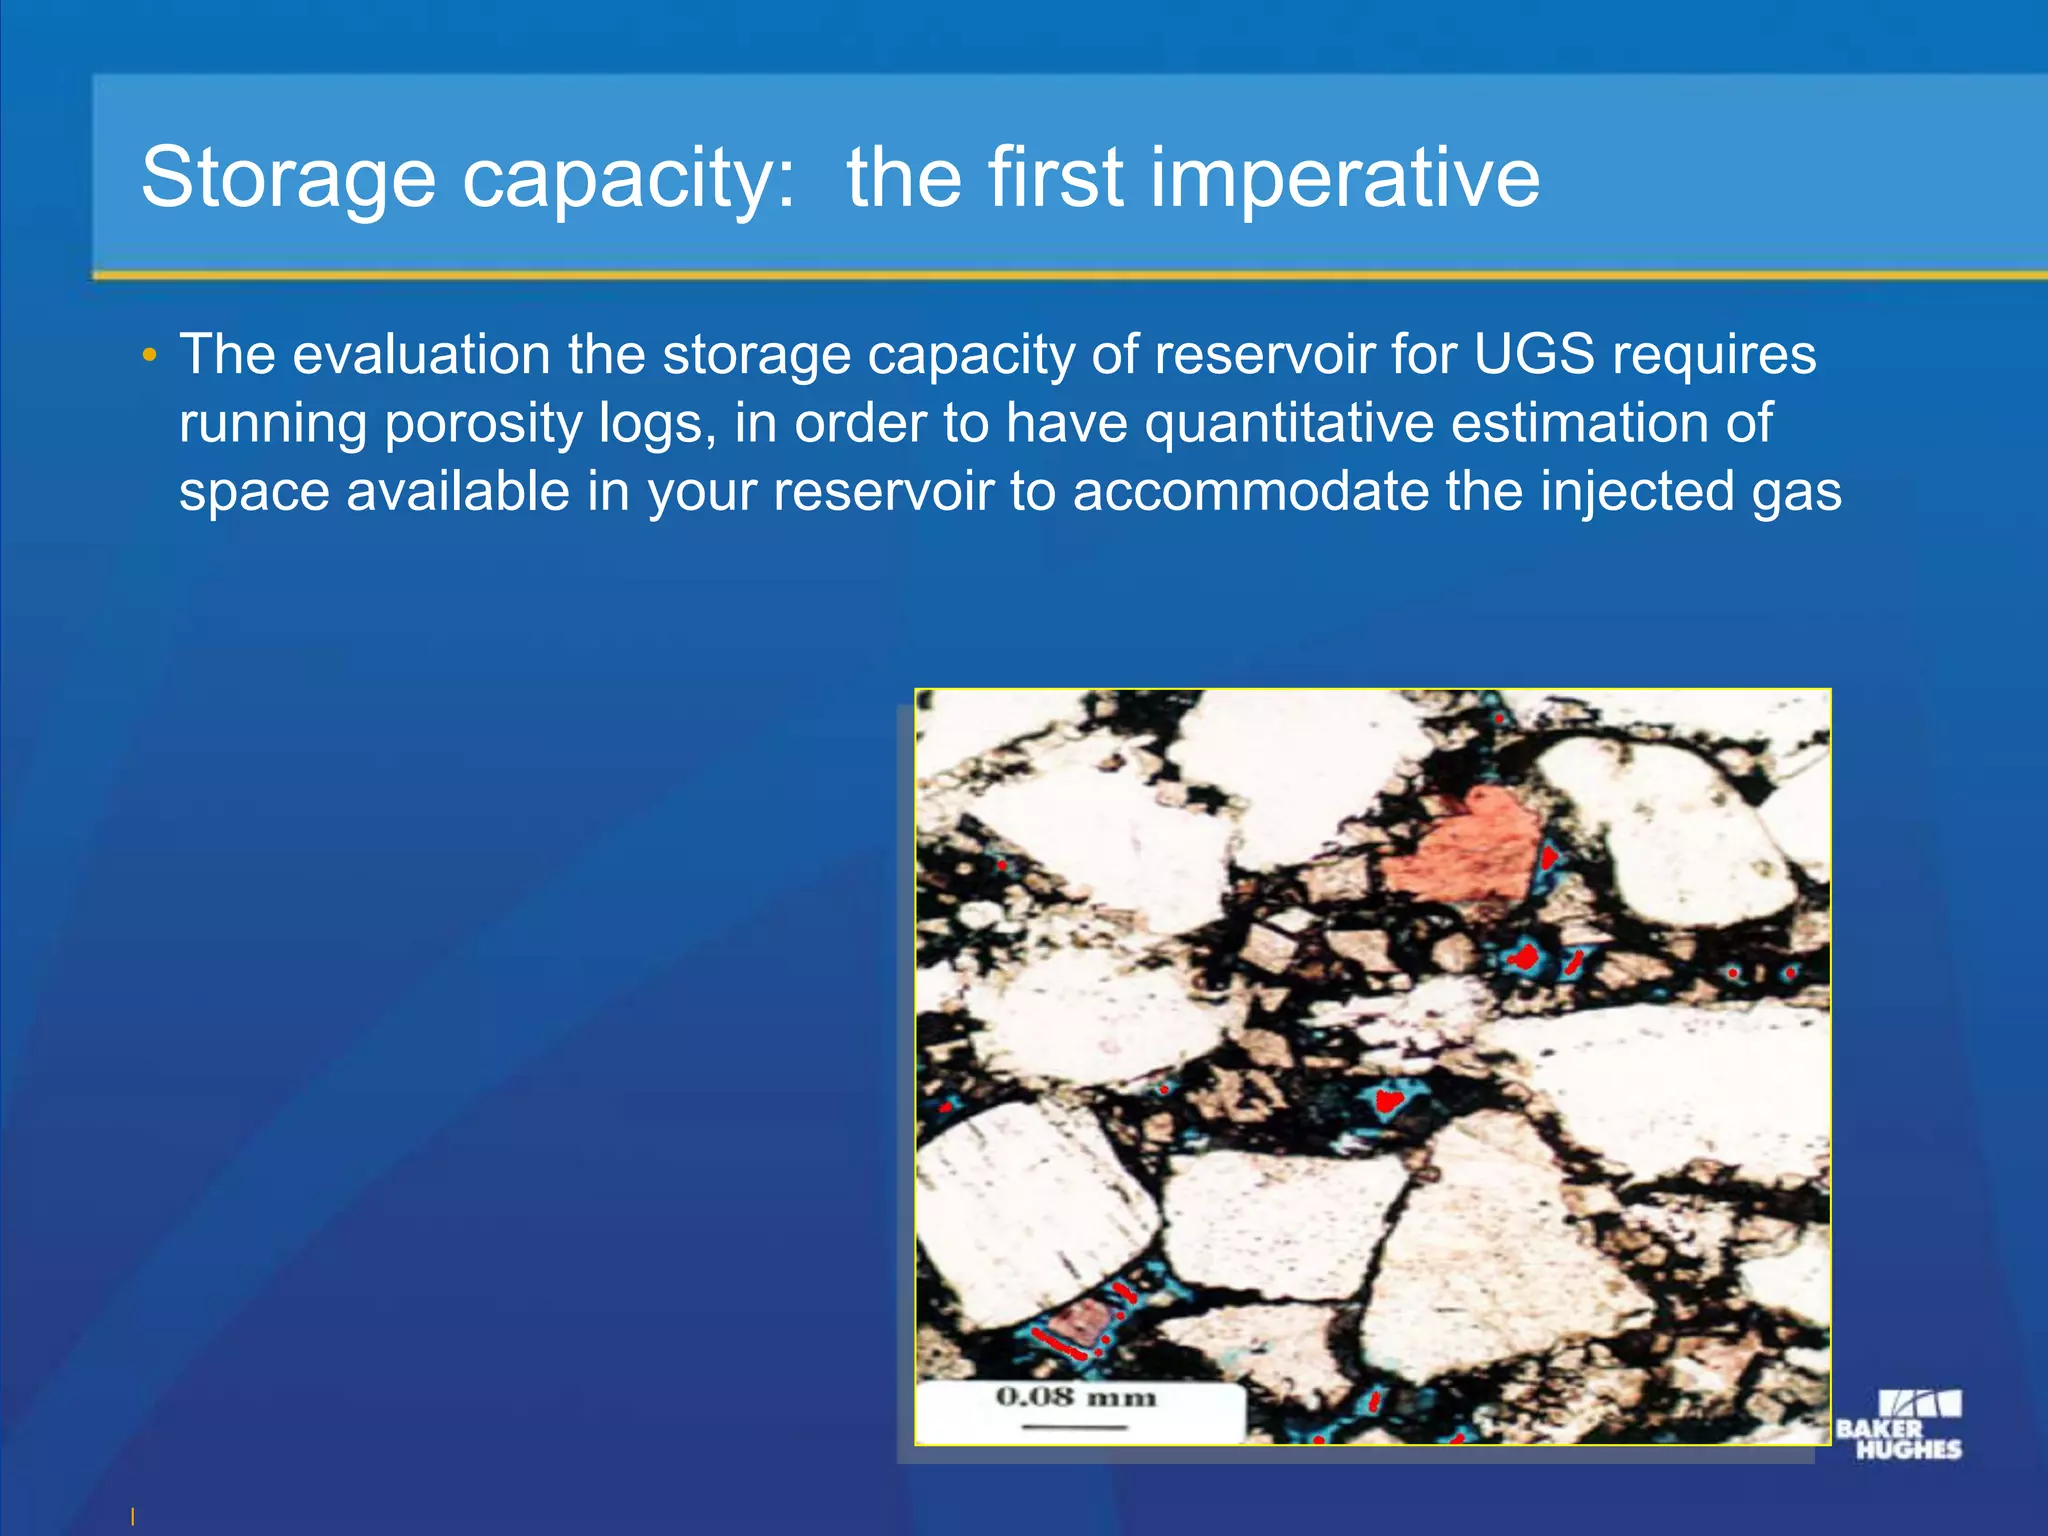
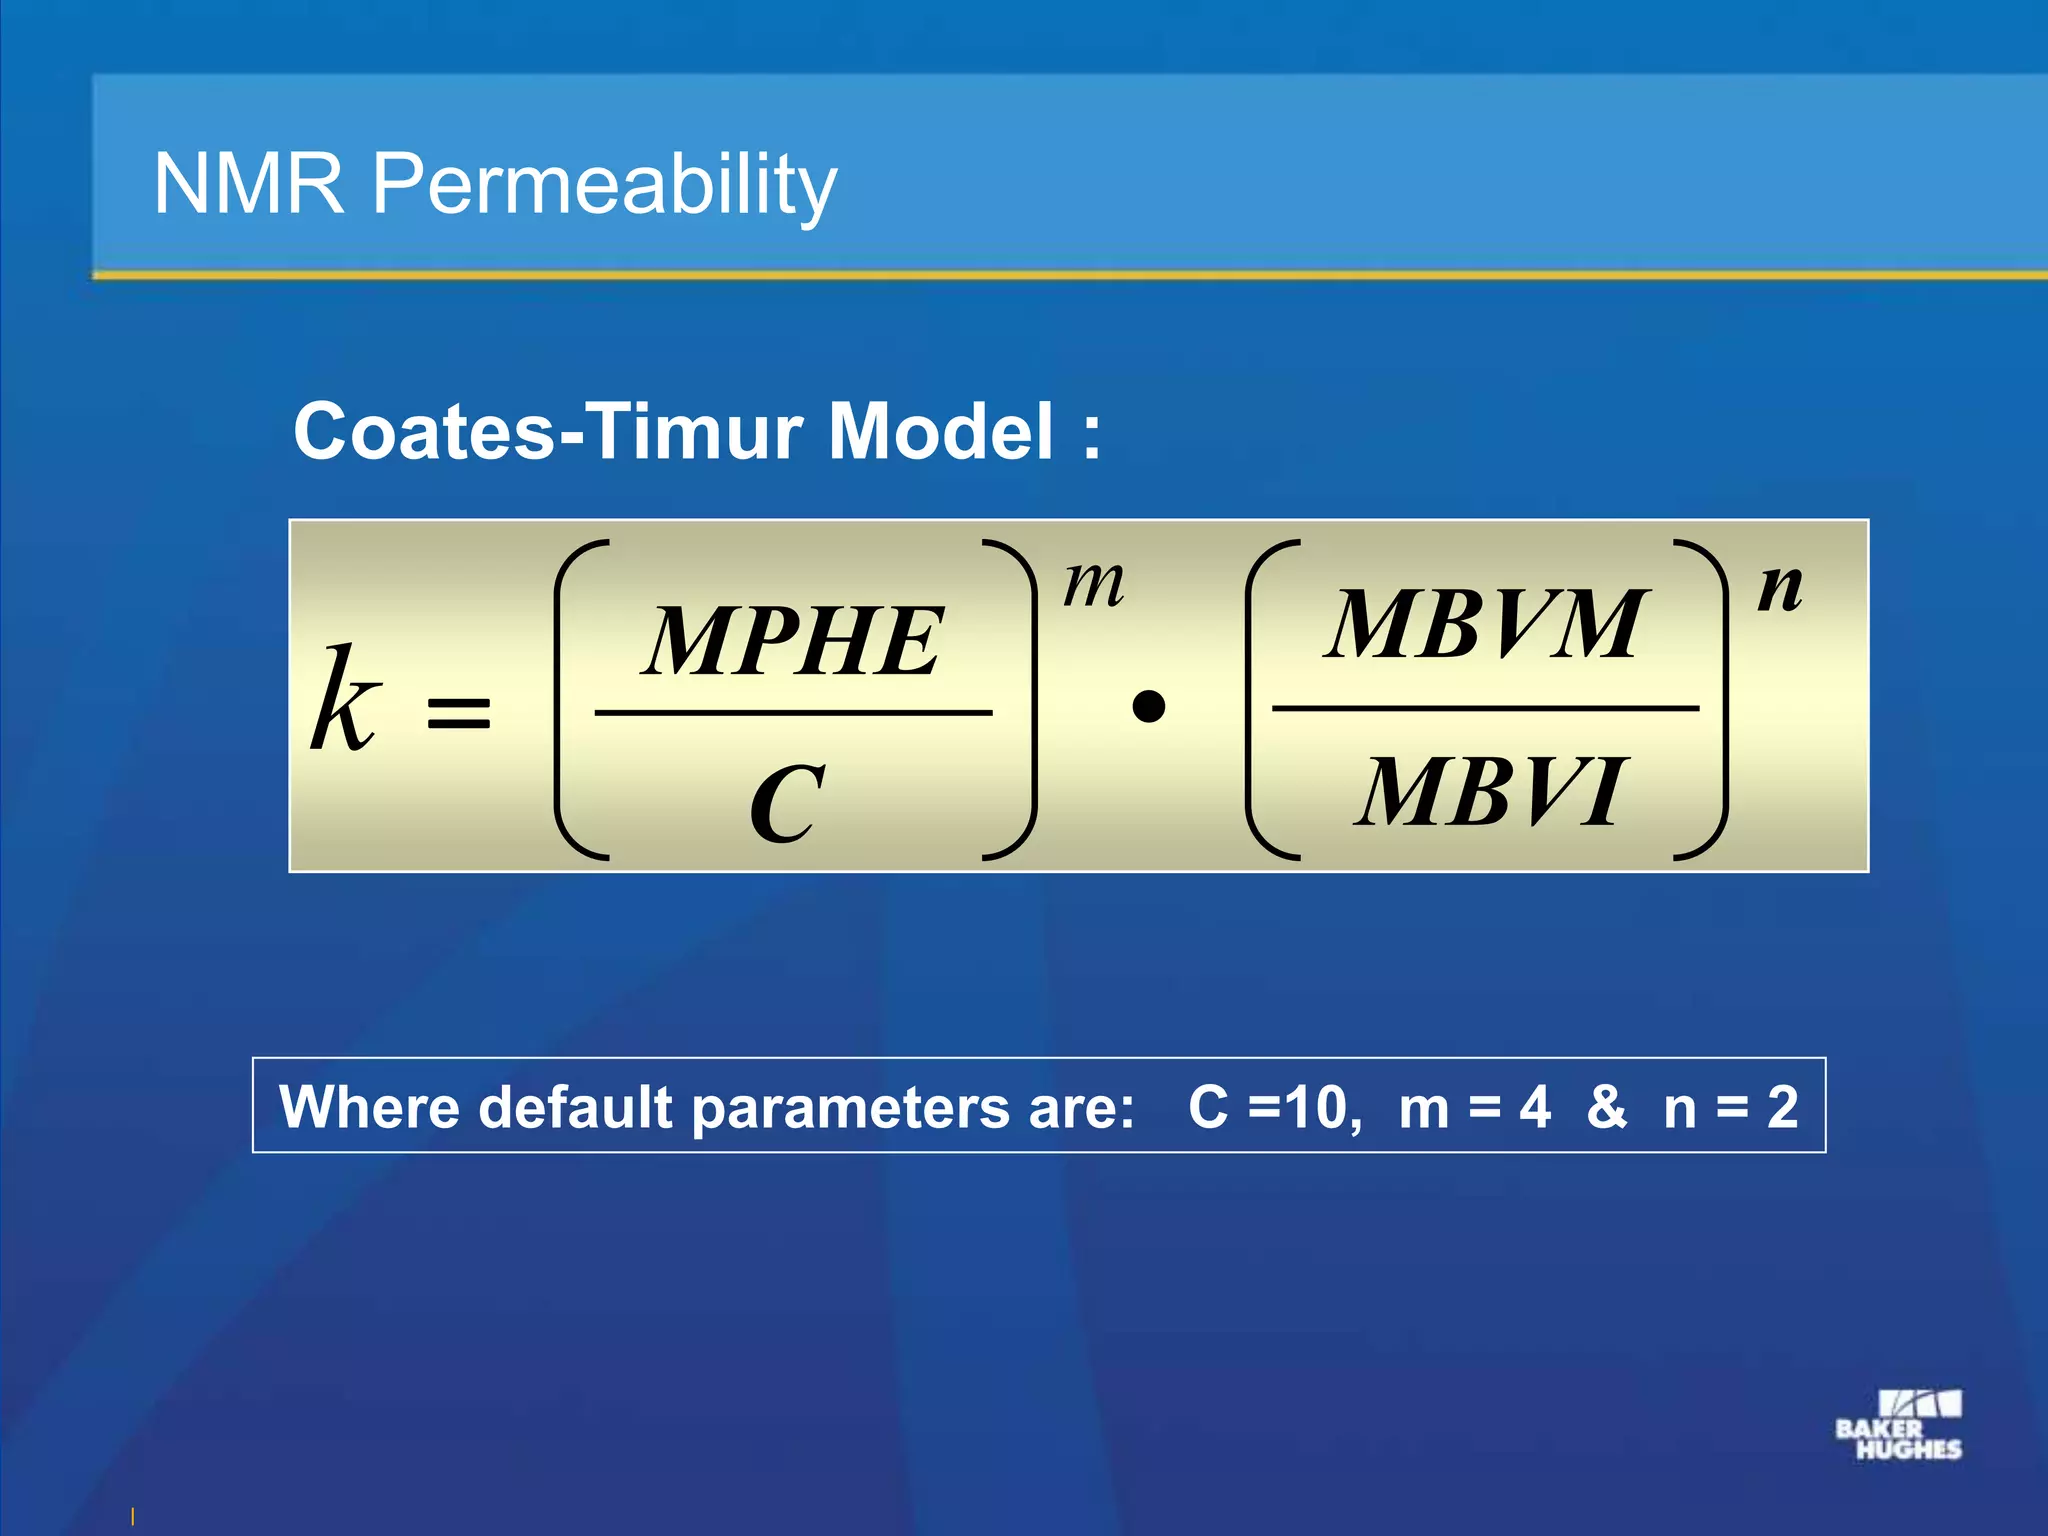
This document discusses an integrated source-free interpretation approach for evaluating storage capability in reservoirs using NMR and acoustic logging.
[1] NMR logging directly measures hydrogen in pore fluids, providing a detailed porosity description independent of lithology or gas presence. Acoustic logging also responds to porosity but is indirect, relying on empirical models.
[2] By calibrating the acoustic model using NMR porosity measurements, the two techniques can be combined to provide a more accurate total porosity evaluation, especially in gas-bearing formations where NMR may underreport porosity due to low hydrogen content.
[3] This integrated approach improves storage capacity assessment, a key imperative for underground gas storage projects, while avoiding safety and regulatory
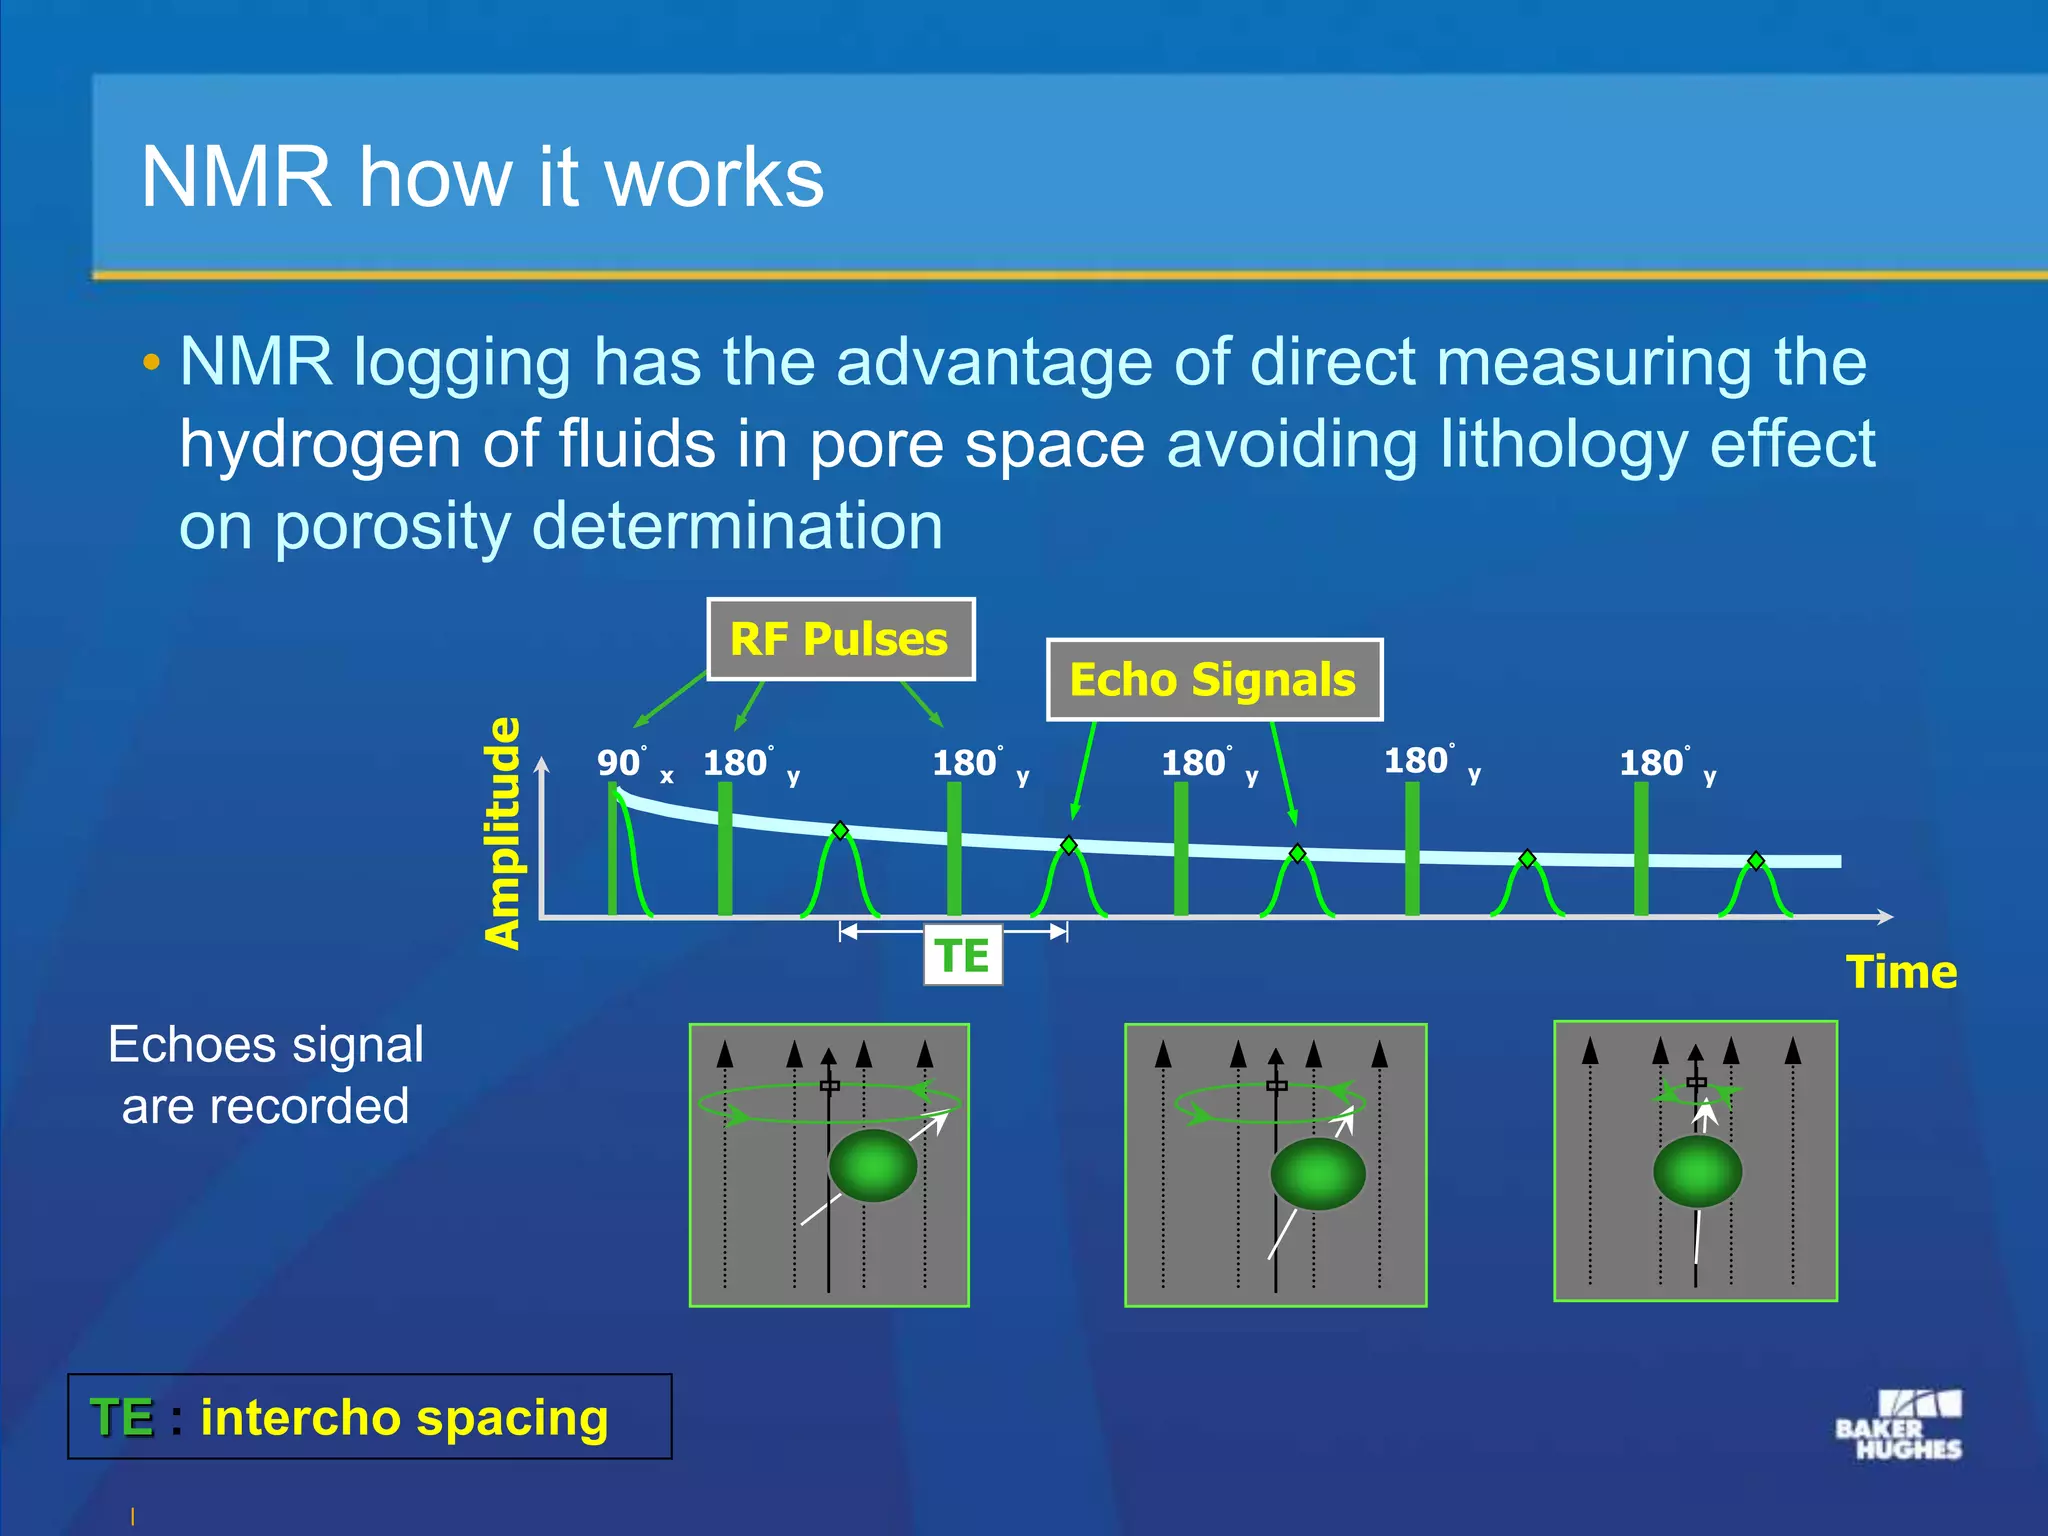
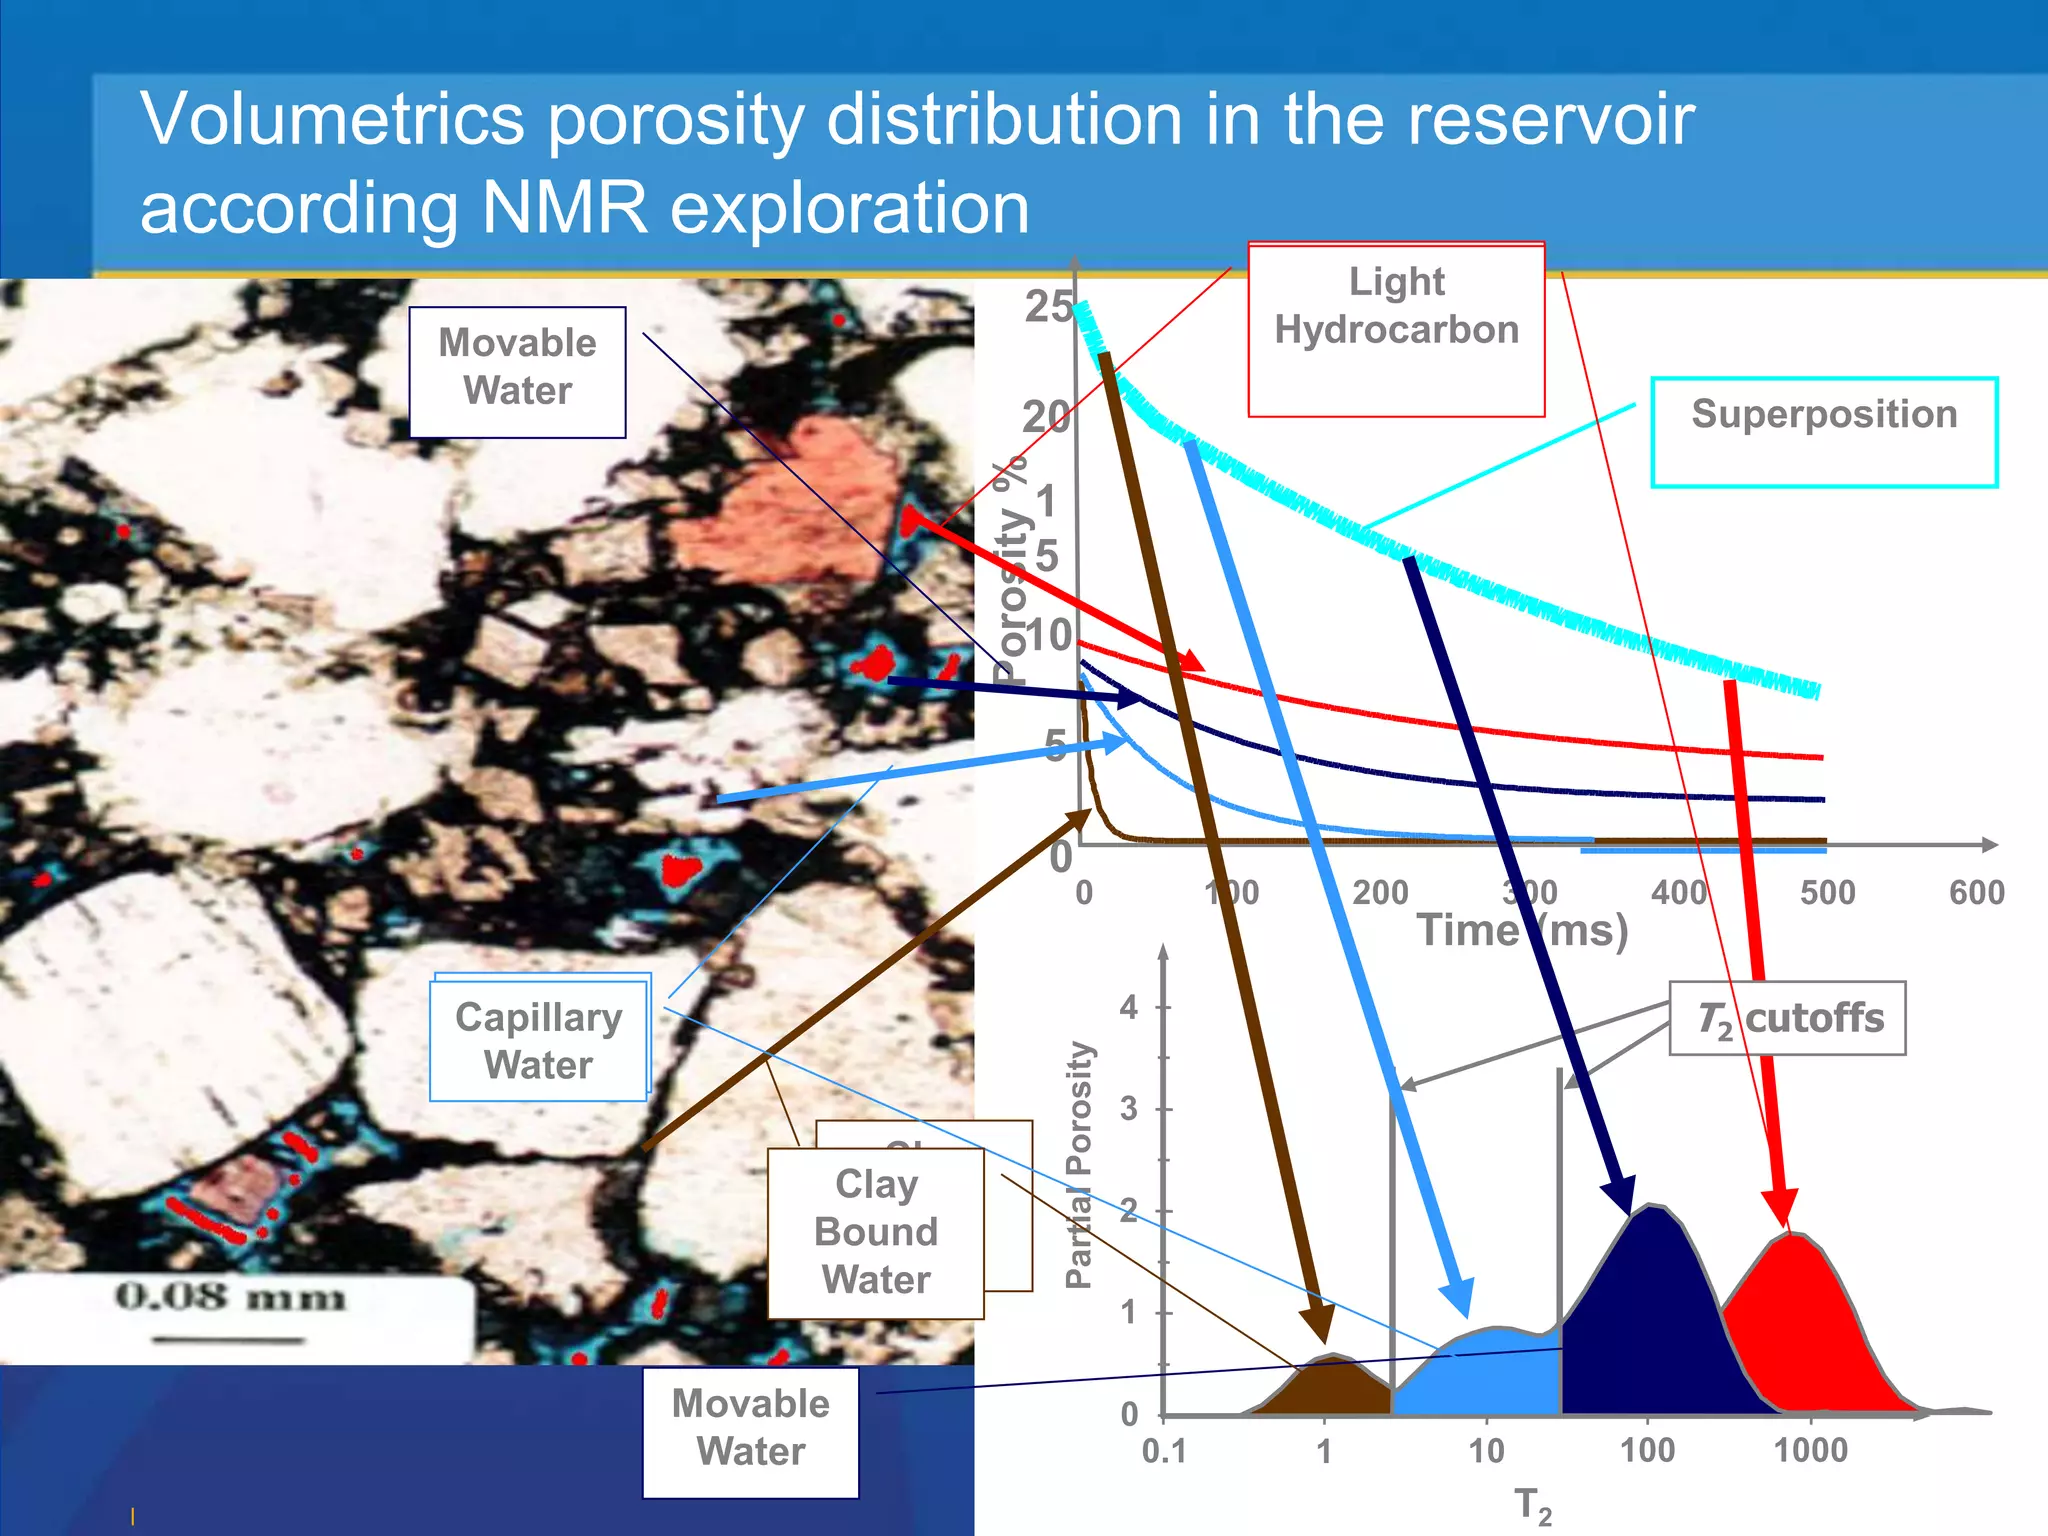
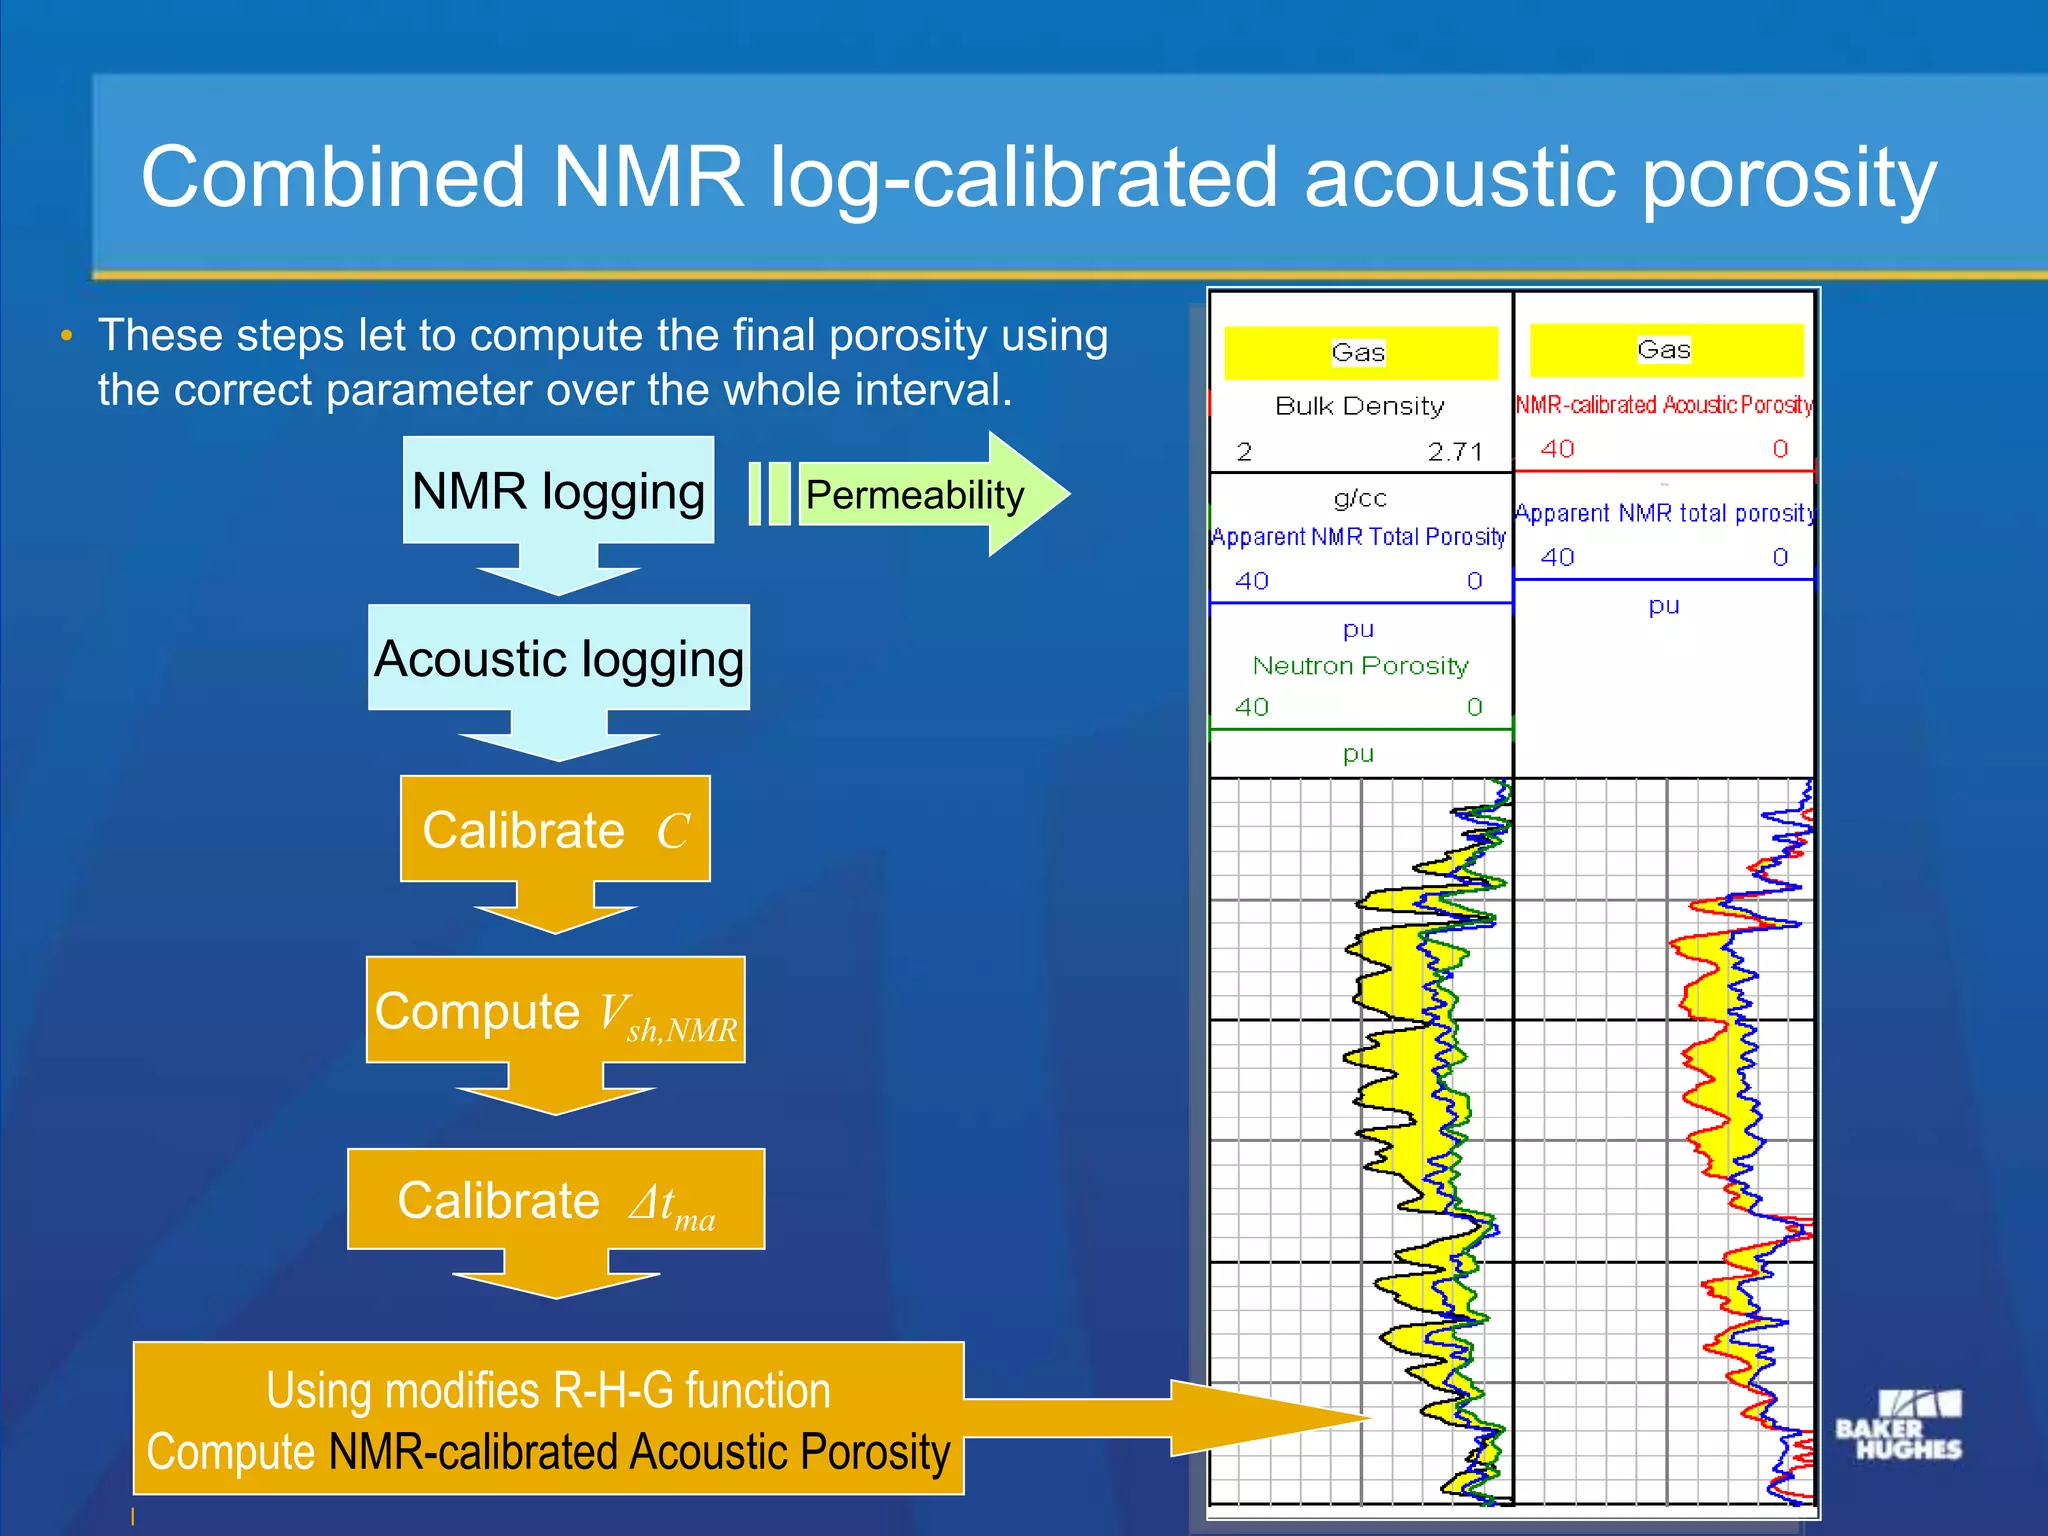
MREX stands for Mineral Explorer (Baker Hughes service). Detailed discussion about working principle and application of Nuclear Magnetic Resonance logging (NMR) in oilfield.
Nuclear Magnetic Resonance Comes Out of Its Shell
Ridvan Akkurt Saudi Aramco Dhahran, Saudi Arabia
H. Nate Bachman
Chanh Cao Minh
Charles Flaum
Jack LaVigne
Rob Leveridge
Sugar Land, Texas, USA
Romulo Carmona
Petróleos de Venezuela S.A.
Caracas, Venezuela
Advances in measurement technology, along with improved processing techniques,
have created new applicationsfor nuclear magnetic resonance (NMR) logging. A new
NMR tool delivers conventional NMR-based information as well as fluid-property
characterization. These NMR data identify fluid types, transition zones and production
potential in complex environments. Placing this information into multidimensional
visualization maps provides log analysts with new insight into in situ fluid properties.
Advanced logging evaluation gas reservoir of Levantine basinFabio Brambilla
Experience gained in recent activity in the Levantine basin has allowed for the development of a formation evaluation strategy for accurate gas reservoirs description in this region. The proposed evaluation approach considers operational issues of deep water wells, challenging borehole conditions (high salinity mud, deep invasion) and other geological features of these clastic reservoirs and their fluids. Our case study highlights benefits of the integrated evaluation of new laterolog resistivity data together with 2D NMR inversion results optimized for a gas bearing reservoir. Furthermore borehole imaging logs are included in our evaluation approach. The recently developed multi laterolog tool has an advantage of four multiple depths of investigation. It provides a detailed high 1ft vertical resolution radial resistivity profile overcoming the deep invasion often present in these reservoirs. The NMR acquired in gas oriented acquisition mode exploits the multi-frequency capability of the logging device. Combined together multiple G•TE and multiple TW experiments contribute to robust determination of the T1 and T2 reservoir fluid properties. This acquisition sequence allows for continuous hydrocarbon typing applying the T1/T2 vs T2 2D maps method, which is practical for these reservoirs given the T1 contrast between gas and other fluids. Consequently we are able to perform accurate HI corrections and therefore improve the estimates of NMR permeability and saturations. Further in the workflow we compare NMR and Stoneley wave permeability’s and assess in details their differences. The geological study performed with the combination of simultaneously acquired ultrasonic and resistivity borehole images provides additional insight into the reservoir architectures, taking advantage during the analysis of the different logging responses of the petrophysical factors to acoustic and resistivity investigation for a detailed delineation of the productive beds. The advantages of this integrated approach are illustrated with field data examples.
Analytical modelling of groundwater wells and well systems: how to get it r...Anton Nikulenkov
Aquifer tests are probably the most widely used methods to obtain hydrogeological properties that are vital for any mine dewatering or environmental impact assessments. Numerous softwares and methods currently exist that provide quick and easy tests interpretation by fitting theoretical and measured drawdown curves. However, misinterpreting a-priory groundwater concepts and not accounting correctly for such factors as skin-effect, well storage or partial penetration may result in hydraulic conductivity errors by several hundred precents. As illustrated by case studies from WA, both numerical and analytical models generally suffer from non-uniqueness that can be overcome by understanding a-priory groundwater concepts and implementing them appropriately into the interpretation algorithms.
The presentation also discusses an analytical approach for well systems design. The methodology is presently incorporated in ANSDIMAT software package that is developed by the Russian Academy of Sciences. The method uses standard and research analytical solutions and it is based on the principle of superposition. Unlike numerical models, the method allows calculating drawdowns inside a pumping well and regional drawdowns, for example, on an open pit contour. A particle tracking component, incorporated into the methodology, provides a practical alternative to numerical models for simplified environmental impact assessments.
The Remarkable Benefits and Grave Dangers of using Artificial Intelligence in...Steve Cuddy
Overview
What is Artificial Intelligence (AI)
Petrophysical Case Studies showing successful applications
- Evolution of shaly water saturation equations
- Nuclear Magnetic Resonance T1 & T2 spectra analysis
- Prediction of shear velocities
- Litho-facies and permeability prediction
- The log quality control and repair of electrical logs
Narrow vs. General vs. True AI
The grave dangers of using AI
- More than AI making poor petrophysical predictions!
- I describe an end of civilisation scenario
Introduction
Petrophysic of the rocks
It is the study of the physical and chemical properties of the rocks related to the pores and fluid distribution
Porosity, is ratio between volume of void to the total voids of the rock.
Permeability, is ability of a porous material to allow fluids to pass through it.
Electric, most of the sedimentary rocks don’t have conductivity.
Radiation, clay rocks have 40K, radiate alpha ray.
Hardness, it depends on the cementing material and thickness of the sediments.
WELL LOGGING
The systematic recording of rock properties and it’s fluid contents in wells being drilled or produced to obtain various petrophysical parameters and characteristics of down hole sequences (G.E Archie 1950).
The measurement versus depth or time, or both, of one or more physical properties in a well.
These methods are particularly good when surface outcrops are not available, but a direct sample of the rock is needed to be sure of the lithology.
A wide range of physical parameters can be measured.
In some cases, the measurements are not direct, it require interpretation by analogy or by correlating values between two or more logs run in the same hole.
Provide information on lithology, boundaries of formations and stratigraphic correlation.
Determine Porosity, Permeability, water, oil and gas saturation.
Reservoir modeling and Structural studies… etc.
Types of Well Logging
Logs can be classified into several types under different category
Permeability and lithology Logs
Gamma Ray log
Self Potential [SP] log
Caliber log
Porosity Logs
Density log
Sonic log
Neutron log
Electrical Logs
Resistivity Log
For contact : omerupto3@gmail.com
GraphRAG is All You need? LLM & Knowledge GraphGuy Korland
Guy Korland, CEO and Co-founder of FalkorDB, will review two articles on the integration of language models with knowledge graphs.
1. Unifying Large Language Models and Knowledge Graphs: A Roadmap.
https://arxiv.org/abs/2306.08302
2. Microsoft Research's GraphRAG paper and a review paper on various uses of knowledge graphs:
https://www.microsoft.com/en-us/research/blog/graphrag-unlocking-llm-discovery-on-narrative-private-data/
Let's dive deeper into the world of ODC! Ricardo Alves (OutSystems) will join us to tell all about the new Data Fabric. After that, Sezen de Bruijn (OutSystems) will get into the details on how to best design a sturdy architecture within ODC.
Slack (or Teams) Automation for Bonterra Impact Management (fka Social Soluti...Jeffrey Haguewood
Sidekick Solutions uses Bonterra Impact Management (fka Social Solutions Apricot) and automation solutions to integrate data for business workflows.
We believe integration and automation are essential to user experience and the promise of efficient work through technology. Automation is the critical ingredient to realizing that full vision. We develop integration products and services for Bonterra Case Management software to support the deployment of automations for a variety of use cases.
This video focuses on the notifications, alerts, and approval requests using Slack for Bonterra Impact Management. The solutions covered in this webinar can also be deployed for Microsoft Teams.
Interested in deploying notification automations for Bonterra Impact Management? Contact us at sales@sidekicksolutionsllc.com to discuss next steps.
The Art of the Pitch: WordPress Relationships and SalesLaura Byrne
Clients don’t know what they don’t know. What web solutions are right for them? How does WordPress come into the picture? How do you make sure you understand scope and timeline? What do you do if sometime changes?
All these questions and more will be explored as we talk about matching clients’ needs with what your agency offers without pulling teeth or pulling your hair out. Practical tips, and strategies for successful relationship building that leads to closing the deal.
Connector Corner: Automate dynamic content and events by pushing a buttonDianaGray10
Here is something new! In our next Connector Corner webinar, we will demonstrate how you can use a single workflow to:
Create a campaign using Mailchimp with merge tags/fields
Send an interactive Slack channel message (using buttons)
Have the message received by managers and peers along with a test email for review
But there’s more:
In a second workflow supporting the same use case, you’ll see:
Your campaign sent to target colleagues for approval
If the “Approve” button is clicked, a Jira/Zendesk ticket is created for the marketing design team
But—if the “Reject” button is pushed, colleagues will be alerted via Slack message
Join us to learn more about this new, human-in-the-loop capability, brought to you by Integration Service connectors.
And...
Speakers:
Akshay Agnihotri, Product Manager
Charlie Greenberg, Host
Accelerate your Kubernetes clusters with Varnish CachingThijs Feryn
A presentation about the usage and availability of Varnish on Kubernetes. This talk explores the capabilities of Varnish caching and shows how to use the Varnish Helm chart to deploy it to Kubernetes.
This presentation was delivered at K8SUG Singapore. See https://feryn.eu/presentations/accelerate-your-kubernetes-clusters-with-varnish-caching-k8sug-singapore-28-2024 for more details.
Epistemic Interaction - tuning interfaces to provide information for AI supportAlan Dix
Paper presented at SYNERGY workshop at AVI 2024, Genoa, Italy. 3rd June 2024
https://alandix.com/academic/papers/synergy2024-epistemic/
As machine learning integrates deeper into human-computer interactions, the concept of epistemic interaction emerges, aiming to refine these interactions to enhance system adaptability. This approach encourages minor, intentional adjustments in user behaviour to enrich the data available for system learning. This paper introduces epistemic interaction within the context of human-system communication, illustrating how deliberate interaction design can improve system understanding and adaptation. Through concrete examples, we demonstrate the potential of epistemic interaction to significantly advance human-computer interaction by leveraging intuitive human communication strategies to inform system design and functionality, offering a novel pathway for enriching user-system engagements.
Dev Dives: Train smarter, not harder – active learning and UiPath LLMs for do...UiPathCommunity
💥 Speed, accuracy, and scaling – discover the superpowers of GenAI in action with UiPath Document Understanding and Communications Mining™:
See how to accelerate model training and optimize model performance with active learning
Learn about the latest enhancements to out-of-the-box document processing – with little to no training required
Get an exclusive demo of the new family of UiPath LLMs – GenAI models specialized for processing different types of documents and messages
This is a hands-on session specifically designed for automation developers and AI enthusiasts seeking to enhance their knowledge in leveraging the latest intelligent document processing capabilities offered by UiPath.
Speakers:
👨🏫 Andras Palfi, Senior Product Manager, UiPath
👩🏫 Lenka Dulovicova, Product Program Manager, UiPath
Key Trends Shaping the Future of Infrastructure.pdfCheryl Hung
Keynote at DIGIT West Expo, Glasgow on 29 May 2024.
Cheryl Hung, ochery.com
Sr Director, Infrastructure Ecosystem, Arm.
The key trends across hardware, cloud and open-source; exploring how these areas are likely to mature and develop over the short and long-term, and then considering how organisations can position themselves to adapt and thrive.
From Siloed Products to Connected Ecosystem: Building a Sustainable and Scala...
Evaluating storage capability of reservoir using an integrated source-free interpretation approach
1. Baker Hughes
11th Annual Global Gas Village Summit 2011
Prague – 11, 12 & 13 April 2011
Evaluating storage capability of reservoir using an
integrated source-free interpretation approach
Fabio Brambilla
Senior Geoscientist Baker Hughes
Fabio.brambilla@bakerhughes.com
2. Agenda
1. Sub-Surface imperative of UGS
2. Added value of integrated source free approach
3. The challenge of storage capacity evaluation
4. NMR logging vantages
5. Acoustic porosity
6. Combined porosity
7. Summary
2
3. Sub-Surface Imperatives of UGS
3
Maximize storage capacity
Maximize deliverability
Optimize cushion gas volume
Mitigate project risk
Well reliability
Profitable project
Project
Economics
Storage
Capacity
Deliverabilit
y
Cushion
Gas
Risk
Reliability
4. Added value of integrated source-free
interpretation approach
4
• Improve the evaluation of storage capability
providing better porosity knowledge of the
reservoir
• The continuous permeability profile from
NMR service let to understand the
deliverability of the well
• Avoid any risk about utilization of radioactive
sources
Project
Economics
Storage
Capacity
Deliverability
Cushion GasRisk
Reliability
5. Storage capacity: the first imperative
• The evaluation the storage capacity of reservoir for UGS requires
running porosity logs, in order to have quantitative estimation of
space available in your reservoir to accommodate the injected gas
6. Evaluating the storage capacity: the challenge
• The traditional approach of evaluation requires running
density and neutron log devices in order to have
quantitative estimation of reservoir porosity
• Both logs response are affected by lithology and gas
presence
• Environmental regulations for UGS fields management
are more and more limiting the use of chemical
radioactive sources
• HSE nationals rules tend to made complex the logistic of
devices using radioactive sources
7. Evaluating the storage capability: the solution
• To overcome that, a more advanced approach have
been developed for porosity determination using
source-free tools, combining:
1. Nuclear Magnetic Resonance (NMR) logging
2. Acoustic logging
• Both devices rely on a comfortable physics:
– NMR: tool contains permanent magnet with magnetic field
– Acoustic: deals with acoustic waves
• The porosity from that combination is indipendent from
lithology and gas presence
9. NMR service
• This evaluation service is available either
– While drilling the well (LWD)
– At end of well drilling in open hole (WL)
MagTrak
MR Explorer (MREX)
10. NMR: what it is measured (a bit of physics)
• NMR logging has the advantage of direct measuring the
hydrogen of fluids in pore space avoiding lithology effect
on porosity determination
•
11. NMR how it works
• NMR logging has the advantage of direct measuring the
hydrogen of fluids in pore space avoiding lithology effect
on porosity determination
B=0, M=0
12. M0 B0
NMR how it works
• NMR logging has the advantage of direct measuring the
hydrogen of fluids in pore space avoiding lithology effect
on porosity determination
13. NMR how it works
• NMR logging has the advantage of direct measuring the
hydrogen of fluids in pore space avoiding lithology effect
on porosity determination
Tool emits radio
Frequency RF
pulse with field
strength B1
Spins are tipped 90
degrees by the RF pulse
and then begin to precess
in the B0 field
f = B0
14. Spins precess in the
B0 field after tipping
by an RF pulse
f = B0
NMR how it works
• NMR logging has the advantage of direct measuring the
hydrogen of fluids in pore space avoiding lithology effect
on porosity determination
Echoes signal
are recorded
15. NMR how it works
• NMR logging has the advantage of direct measuring the
hydrogen of fluids in pore space avoiding lithology effect
on porosity determination
Echoes signal
are recorded
TE : intercho spacing
TE Time
90°
x 180°
y 180°
y 180°
y 180°
y 180°
y
Amplitude
Echo Signals
RF Pulses
16. Volumetrics porosity distribution in the reservoir
according NMR exploration
0 100 200 300 400 500 600
Time (ms)
Porosity%
25
20
1
5
10
5
0
Superposition
Clay
Bound
Water
Capillary
Water
Movable
Water
Light
Hydrocarbon
0
1
2
3
4
0.1
PartialPorosity
1 10 100 1000
T2 cutoffs
T2
Movable
Water
Capillary
Water
Clay
Bound
Water
Light
Hydrocarbon
17. NMR porosity description
• The NMR logging offers a complete overview of
– porosity distribution: total porosity, clay bound water
volume, capillary water volume, mobile fluid volume
– a continuous permeability curve.
• The knowledge of these values allows:
– recognizing the best storage zones of the reservoir
– Better understand the deliverability
total porosity (ØT,NMR )
Matrix Rock
Dry
Clay
Clay-
bound
water
Free
water
Capillary
trapped
water
Hydro-
carbons
BVMCBW
e
BVI
t
18. Where default parameters are: C =10, m = 4 & n = 2
Coates-Timur Model :
MBVI
MBVM
C
k
n
=
m
MPHE
NMR Permeability
19.
20. Shale indicator from NMR
• CBW: Volume of clay bound water (CBW) represents the
porosity in clay content in a formation rock
• From NMR logs, both the fractional porosity from CBW
(ØCBV) and the total porosity (ØT,NMR ) are obtained
NMRT
CBW
,
Vsh =
0
1
2
3
4
0.1
PartialPorosity
1 10 1001000
21. Porosity evaluation in gas bearing beds
• The gas occurrence affect all the
porosity logs
– Lower density: over call density
porosity
– Lower Hydrogen index: under call
porosity based on Hydrogen Index
22. Superior hydrocarbon typing
• Innovative NMR acquisition techniques provide comprehensive NMR data for
fluids analysis
– T1, T2 & Diffusion data acquired simultaneously while logging
• 2D NMR plots identify and quantify hydrocarbons
– Available from all hydrocarbon typing Objective Oriented Acquisitions
– Acquired as continuous logs (NOT stationary measurements!)
PoroPerm + Gas PoroPerm + Oil PoroPerm + Heavy Oil
2 32 512
T2,app (ms)
16
4
1
T1/T2,app
T2,int (ms)
e-8
e-9
e-10
e-11
D(m2/s)
2 128 1024
T2,int (ms)
e-8
e-9
e-10
e-11
e-12
D(m2/s)
162 128 102416
Gas
CBW BVI
Water
Oil
Heavy Oil
Water
23. Porosity evaluation in gas bearing beds
• The accuracy of NMR total porosity in gas-bearing
formations is affected by low Hydrogen Index (HI)
• Thanks to hydrocarbon typing analysis we can correct for
the HI effect ,
24. Porosity evaluation in gas bearing beds
• However in depleted levels or low pressure reservoir the
correction for HI is definitively an improvement but still an
estimate due to uncertainty of HI estimation
Porosity & HI correction
0
1
2
3
4
5
6
7
8
0 50 100 150 200 250 300 350
BAR
HI
0
5
10
15
20
25
30
35
40
Porosity
25. Porosity evaluation in gas bearing beds
To overcame this imprecision we suggest to exploit the
vantage of combine the porosity from NMR service with
the porosity from the acoustic service
NMR Acoustic
26. Acoustic vantages
• HSE fully complaint !
• This evaluation service is available either
– While drilling the well (LWD)
– At end of well drilling phase (WL) in open hole and cased
hole (CH)
SoundTrak
XMAC F1
27. Porosity from modified Raymer-Hunt-Gardner (1)
• Δt is the measured slowness of wave velocity,
• Δtma is the slowness of the dry matrix.
– Constant in clean reservoir (Δtma,clean )
– it changes with shale presence: type, distribution, and
percentage of shale (Δtma)
• C is the fitting parameter
C
t
tt ma
acoustic
=
(1 ) Alberty, M. 1994
28. Acoustic porosity
• The acoustic measurements respond to lithology and
porosity
• In addition respond to texture consequently acoustic
porosity is an indirect measurement based on semi-
empirical models, which often requires calibration of
parameters
• The Raymer-Hunt-Gardner function can be calibrated
using the NMR total porosity and NMR shale volume
29. {
Acoustic porosity calibration
• Calibrate the fitting parameter C
• The Raymer-Hunt-Gardner function is calibrated in a clean water zone
using the NMR total porosity
• (ØT,NMR ) = (ØT,Acoustic )
• Calibrate Δtma,clean
– Complex matrix
C
t
tt cleanma
NMRT
= ,
,
C
t
tt
a
cleanmaa
NMRTa
=
,
,
C
t
tt
b
cleanmab
NMRTb
= ,
,
cleanma
t
tt
C
NMRT
,
,
=
0
1
2
3
4
0.1
PartialPorosity
1 10 100 1000
30. Acoustic porosity calibration
• Calibrate the Δtma, in the shaly sand section
– Using the calibrated C and the NMR porosity
• A correlation can be established between Δtma and Vsh
• The matrix slowness is back-calculated over all the shaly
zones
t
C
tt
NMRT
ma =
,
GRvstma . dt_ma vs GR
0
10
20
30
40
50
60
70
80
0 20 40 60 80 100
GR (gAPI)
dt_ma(us/ft)
)(gAPIGR
tma(s/ft)
GRvstma . dt_ma vs GR
0
10
20
30
40
50
60
70
80
0 20 40 60 80 100
GR (gAPI)
dt_ma(us/ft)
)(gAPIGR
GRvstma . dt_ma vs GR
0
10
20
30
40
50
60
70
80
0 20 40 60 80 100
GR (gAPI)
dt_ma(us/ft)
)(gAPIGR
tma(s/ft)
GR (gAPI)
tp,ma(µs/ft)
Vsh %
Δtma
31. Acoustic porosity calibration: summary
• The Raymer-Hunt-Gardner function is calibrated using the
NMR total porosity in a clean water zone.
• Subsequently using the shale volume, computed from the
clay bound water volume, the matrix slowness is back-
calculated over all the shaly zones
• The function, with the calibrated parameters is run over
the reservoir
32. Combined NMR log-calibrated acoustic porosity
• These steps let to compute the final porosity using
the correct parameter over the whole interval.
Compute Vsh,NMR
Calibrate Δtma
Calibrate C
NMR logging
Acoustic logging
Using modifies R-H-G function
Compute NMR-calibrated Acoustic Porosity
Permeability
33. Example of NMR log-calibrated acoustic porosity
• Example in shaly sand sequences
•
34. Where and when ?
• This approach is applicable from clean to shaly
sandstones, and carbonate reservoirs
• Necessary data can be gathered either using LWD at
drilling phase and or at wireline measurements phase
35. 35
Summary
First UGS imperative: to be able to evaluate the
storage capacity
Mitigate project risk
Get information helping to maximize the
deliverability
NMR log-calibrated acoustic porosity provides more
accurate and detailed description of reservoir
porosity
Data can be acquired either while drilling or post
drilling phase.
Project
Economics
Storage
Capacity
Deliverability
Cushion GasRisk
Reliability
36. References
• Alberty, M. 1994. The influence of the borehole
environment upon compressional sonic logs. Paper 1994-
S, SPWLA 35th Annual Logging Symposium
• Raymer, L.L., Hunt, E.R., and Gardner, J.S. 1980. An
improved sonic transit time to porosity transform. Paper
1980-P, SPWLA 21st Annual Logging Symposium
• Chun Lan, Songhua Chen, Freddy Mendez, Rex Sy,
2010. Sourceless Porosity Estimation in Gas Reservoirs
Using Integrated Acoustic and NMR Logs, SPE ATCE
SPE 133487
Describe how your service helps the UGS operator achieve one or more of the imperatives
Randomly dis-tributed spins of hydrogen nuclei
Logging tool contains large permanent magnet with field, Bo
Spins are aligned parallel and antiparallel
Randomly dis-tributed spins of hydrogen nuclei
Logging tool contains large permanent magnet with field, Bo
Spins are aligned parallel and antiparallel
Randomly dis-tributed spins of hydrogen nuclei
Logging tool contains large permanent magnet with field, Bo
Spins are aligned parallel and antiparallel
Randomly dis-tributed spins of hydrogen nuclei
Logging tool contains large permanent magnet with field, Bo
Spins are aligned parallel and antiparallel
Randomly dis-tributed spins of hydrogen nuclei
Logging tool contains large permanent magnet with field, Bo
Spins are aligned parallel and antiparallel
Randomly dis-tributed spins of hydrogen nuclei
Logging tool contains large permanent magnet with field, Bo
Spins are aligned parallel and antiparallel
Randomly dis-tributed spins of hydrogen nuclei
Logging tool contains large permanent magnet with field, Bo
Spins are aligned parallel and antiparallel
We have porous rocks in the reservoir. They consist of grains and fluids inbetween.
The solid material does not contribute to the NMR measurement. After a wait time (about 6 to 8 sec) to magnetize the Hydrogen- spins in the formation a measurement can be carried out.
Only fluids give a signal in the formation.
Click
First component is the Clay bound water. because of the good energy exchange with the solid material the signal is decaying very fast.
Click
The second fast decaying component is the capillary water, which is also non producible.
Click
Free water has a longer decay time with a decay constant of greater than 30 ms in sandstones.
Click
Low viscous Hydrocarbon decays even longer. and can easily be detected by it’s long decay time constant.
Click
With the downhole tool we measure a composite signal of all this components.
Click
The individual components can be revealed by a mathematical decomposition of the superposition of signals.
Click
Clay bound water appears between 0 and 3 ms.
Click
Capillary water shows up between 3 and 30 ms.
Click
Free water appears later than 30 ms.
Click
and Hydrocarbon is the latest component in the T2 decay time distribution.
The Coates-Timur Permeability Model has been adopted as the standard model used to compute permeability from NMR data when there is more than one fluid phase present. Primary input data to the model include the NMR porosity and the ratio of moveable fluid to irreducible fluid volumes (BVM/BVI).
This latter element of the model actually forces the resultant permeability to zero (0) when no moveable fluids are present. Thus the Coates-Timur model is better suited to be used for determination of effective permeability to moveable fluids in the presence of irreducible wetting phase, rather than for determination of specific (or absolute permeability) as is typically reported from routine core measurements on dried samples. A good calibration reference for this model would then be RCI or FMT data, which actually provides permeability for the mobile fluid phase.
Although routine core permeabilities may not strictly satisfy the Coates model boundary condition of zero perm at 100% irreducible water saturation, good correlations can typically be achieved between computed and measured core perms over broad permeability ranges through the manipulation of the models exponents (m & n) and coefficient (C).
Baker Atlas has recently developed automated parameter optimization software that can objectively provide the best possible solution for these model variables in achieving a match to core or formation test-derived permeability data. In the absence of core or test calibration data, a set of default values for the Coates model parameters are applied (C=10, m=4 & n=2).
This slide illustrates the new techniques employed as part of the MREX analysis. These techniques are called 2D NMR, for 2 dimensions. They are similar to conventional crossplots in that we are crossplotting two separate measurements. In the case of NMR the two measurements come from the same tool but represent different properties of the fluid. By contrasting these properties we can identify and quntify the oil, water and gas present in an interval of the reservoir.
density and neutron results are affected by shale, thus the density/neutron crossover might not represent the true porosity in these depths.