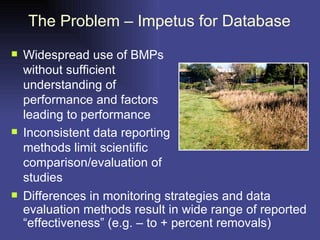
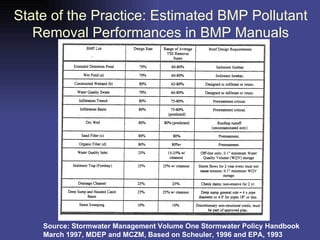
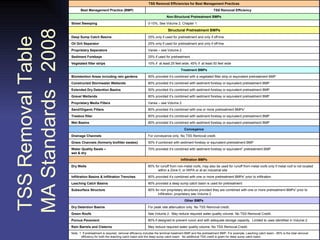
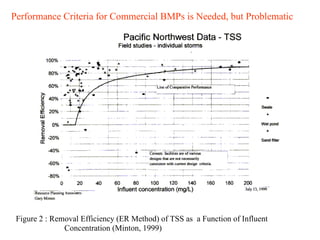
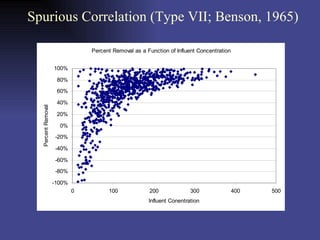
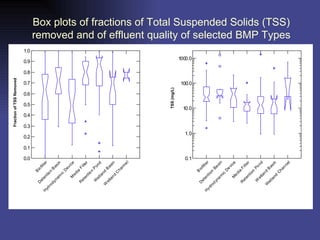
15 Reasons You Should Think Twice Before Using Percent Removal to Assess BMP Performance   Presented by  Marcus Quigley, P.E. (CA), CPESC Geosyntec Consultants Acton, MA   Co-Authors   Eric Strecker P.E.– Geosyntec Consultants   Jonathan Jones. P.E. – Wrightwater Engineers  Jane Clary – Wrightwater Engineers
The Problem – Impetus for Database Widespread use of BMPs without sufficient understanding of performance and factors leading to performance  Inconsistent data reporting methods limit scientific comparison/evaluation of studies Differences in monitoring strategies and data evaluation methods result in wide range of reported “effectiveness” (e.g. – to + percent removals)
Examples of Inconsistencies In BMP Monitoring Studies Constituents Sample collection techniques Sampling approaches Data reporting Effectiveness estimation Statistical validation of results
Project History UWRRC of ASCE identified the need to address Urban Stormwater BMP performance in a systematic and scientifically rigorous manner (Crested Butte Engineering Foundation Conference) The Council approached with a proposal EPA for grant funding ASCE/EPA Cooperative Agreement was Established Long-term support for project through WERF
Project Approach - A Scientifically Rigorous BMP Data Collection and Analysis Effort Development of protocols for collection and reporting of BMP performance information Establish tool to store BMP monitoring and design data in standard format Establish standard techniques for data collection, storage, reporting, and analysis (guidance document) Conduct data analysis and exploration Disseminate findings Promote technically based design improvements
 
Stormwater BMP Database: Current Number of BMPs 28 Maintenance Practices   Non-Structural 314 Total Structural 14 Wetland Channel 20 Wetland Basin 1 Source Controls 62 Retention Pond 10 Porous Pavement 10 Percolation Trench/Well 53 Media Filter 2 Infiltration Basin 37 Hydrodynamic Device 34 Detention Basin 71 Biofilter   Structural NUMBER OF BMPS BMP CATEGORY
Distribution of Current Studies (Fall/07) 342 Grand Total 28 Total Non-Structural 28 Maintenance Practices   Non-Structural 314 Total Structural 14 Wetland Channel 20 Wetland Basin 1 Source Controls 62 Retention Pond 10 Porous Pavement 10 Percolation Trench/Well 53 Media Filter 2 Infiltration Basin 37 Hydrodynamic Device 34 Detention Basin 71 Biofilter   Structural NUMBER OF BMPS BMP CATEGORY BMP TOTALS BY CATEGORY 1 Canada 1 Sweden International 12 WI 34 WA 29 VA 19 TX 2 PA 13 OR 1 ON 1 OH 6 NY 3 NJ 17 NH 10 NC 7 MN 5 MI 5 MD 5 IL 2 GA 79 FL 1 CT 11 CO 64 CA 14 AL Domestic NUMBER OF BMPS STATE BMP TOTALS BY STATE/COUNTRY
Several Studies Have Attempted to Summarize BMP Performance National Pollutant Removal Performance Database, CWP, 2007 Controlling Urban Runoff: A Practical Manual for Planning and Designing Urban BMPs -  Schueler 1987 Guidance Specifying Management Measures for Sources of Nonpoint Pollution In Coastal Waters –EPA 1993 The Use of Wetlands for SW Pollution Control –  Strecker, 1992 Numerous local and state efforts
Massachusetts Stormwater Management Standards - 2008  Stormwater management systems shall be designed to remove 80% of the average annual post-construction load of Total Suspended Solids (TSS).  This Standard is met when: a. Suitable practices for source control and pollution prevention are identified in a long-term pollution prevention plan, and thereafter are implemented and maintained; b. Structural stormwater best management practices are sized to capture the required water quality volume determined in accordance with the Massachusetts Stormwater Handbook; and c. Pretreatment is provided in accordance with the Massachusetts Stormwater Handbook.
State of the Practice: Estimated BMP Pollutant Removal Performances in BMP Manuals Source: Stormwater Management Volume One Stormwater Policy Handbook March 1997, MDEP and MCZM, Based on Scheuler, 1996 and EPA, 1993
TSS Removal Table  MA Standards - 2008
Schueler 1987
The 15 Issues
Issue #1 Percent removal is primarily a function of influent quality.   In almost all cases, higher influent pollutant concentrations into functioning BMPs result in reporting of higher pollutant removals than those with cleaner influent.  Use of percent removal may be more reflective of how “dirty” the influent water is than how well the BMP is actually performing.  Maximize percent removal, the catchment upstream should be dirty (which does not encourage use of good source controls or a treatment train design approach).
Example Study -SWFWMD Tampa Pond Drainage area, 6.5 acres Land use (commercial, office) 30% roof tops and parking lots, 6% crushed stone, 64 % grassed Drained by swales to pond Five year study with two design modifications 1990 (shallow and vegetated,   H  = 2 day) 1993 (volume increased, 35% veg,   H  = 5 day) 1994 (area enlarged, replant littoral zone,   H  = 14 day)
Which design has the highest percent removal? Second best? Which design has the best effluent quality? Is it worth going to a 14-day residence time to get to 5 mg/L?
Performance Criteria for Commercial BMPs is Needed, but Problematic
Spurious Correlation (Type VII; Benson, 1965)
Issue #2 Significant variations in percent removal may occur for BMPs providing consistently good effluent quality.   The variability in percent removal is almost always much broader than the uncertainty of effluent pollutant concentrations. These variations in percent removal have little relationship to the effluent quality achieved.
Box plots of fractions of Total Suspended Solids (TSS) removed and of effluent quality of selected BMP Types TSS (mg/L) BMP Type Fraction of TSS Removed
(CWP, 2007)
(CWP, 2007)
Issue #3   BMPs with high percent removal (e.g., greater than 80% removal of total suspended solids, or TSS) may have unacceptably high concentrations of pollutants in effluent (e.g., greater than 100 milligrams per liter of TSS),  Can lead to a false determination that BMPs are performing well or are “acceptable,” when in fact they are not.
Lake George Field Study Evaluation Vortechs model 11000  Is an average of 100+ mg/l TSS acceptable performance? (Winkler and Guswa 2002)
Issue #4 Various relationships between influent and effluent concentrations have been demonstrated for a variety of BMPs and designs.  The relationships are often complex and are not well represented by a single ratio of inflow-to-outflow concentrations. In addition, many BMPs that are functioning well appear to reach an irreducible concentration. Any measure of BMP performance should be universally interpretable regardless of influent concentration, BMP function, design, number of samples collected, etc.
Phosphorus, Lake Ridge Barrett, 2004
Issue #5 Methods for calculating percent removal are inconsistent  Median, inflow load to outflow load, slope of regression of loads, slope of regression of concentrations, etc... Very different percent removals can be reported from the same data set.
Issue #6 Frequently, in many methods, percent removal is dominated by outliers or high-concentration events in a series that have high leverage on an average.   The standard reporting of percent removal carries none of the statistical support needed to assess uncertainty in the reported value.
Issue #7 Many BMPs that have been monitored do not have enough data to reject the null hypothesis that the influent and effluent concentrations are even different from one another  We cannot tell if the BMP reduces anything), yet these numbers are published as indicative of performance.  Some studies have reported small percent increases in performance erroneously, when in fact the influent and effluent concentrations are not statistically different from one another.
Issue #8 When percent removals are applied in modeling efforts, the resulting estimated effluent concentrations can be very misleading   Particularly when the effluent quality predicted has not been observed in data sets for the practice being modeled. TMDLs? BMPs in Series?
Issue #9 Many volume-based BMPs have long-term performance that is not evident if a paired inflow-outflow percent removal approach is taken (i.e., material from one event is discharged in another).
Concentration Distribution
Paired Data
Issue #10 In terms of meeting receiving-water standards, BMP discharges can comply with receiving-water numeric targets while simultaneously not showing favorable percent removals.
Issue #11 Range of expected effluent-quality concentrations is a much better planning and design tool than percent removal estimates.   For example, an engineer can use effluent concentrations as a tool to estimate the range of pollutant loading that could be expected at a new development. This is particularly important in sensitive watersheds where it is important to have confidence that BMPs will be adequately protective.
Issue #12 The requirement to use percent removals to assess BMP performance can bias monitoring designs.  In effect, incentive is provided to monitor BMPs at relatively dirty locations or areas with poor source controls in place so that the BMP performance “looks better.” The project team has seen this intentionally done.
Issue #13 Percent removal does not provide a meaningful mechanism to address the well-established concept of irreducible pollutant concentrations Expressed by Thomas R. Schueler in Center for Watershed Protection publications (See “Article 65: Irreducible Concentrations Discharged From Stormwater Practices” in  The Practice of Watershed Protection ).
Phosphorus, Lake Ridge Barrett, 2004
Issue #14 Percent removals do not adequately reflect the effect of volume reductions.   In some percent removal calculation methods, volume reductions are partially taken into account, but not in others. Even when load reductions are used, this approach misses the benefit of the reduced frequency of discharges.
Runoff Volume Control Detention Ponds Biofilters Hydrodynamic Devices Media Filters Retention Ponds Wetland Basins
Runoff Volume Control Consider “credit” for volume reduction in design requirements 0.96 Retention Ponds 0.69 Biofilter 0.87 Detention Basin Mean Monitored Outflow/Mean Monitored Inflow for Events Where Inflow is Greater Than or Equal to 0.2 Watershed Inches BMP Type
Issue #15 Percent removal methods also sometimes miss the measurement of how much runoff is and is not treated.  There are example studies in which the percent removal has been reported based on the influent and low-flow effluent (e.g., the flow stream that has received treatment) from a BMP; however, the majority of flow was bypassing the BMP due to clogging. BMP sizing relative to incoming runoff is important in performance metrics.
The State of the Practice is Shifting - EPA
How Can We Do Better?  Performance should be measured by: How much the BMP reduces runoff volumes  How much runoff is treated (versus bypassed)  Whether the BMP can demonstrate a statistical difference in effluent quality compared to influent quality What distribution of effluent quality is achieved  How well the BMP reduces peak runoff rates, especially for smaller, frequent storms (which helps reduce hydromodification)

15 Reasons Not to Use Percent Removals

  • 1.
    15 Reasons YouShould Think Twice Before Using Percent Removal to Assess BMP Performance Presented by Marcus Quigley, P.E. (CA), CPESC Geosyntec Consultants Acton, MA Co-Authors Eric Strecker P.E.– Geosyntec Consultants Jonathan Jones. P.E. – Wrightwater Engineers Jane Clary – Wrightwater Engineers
  • 2.
    The Problem –Impetus for Database Widespread use of BMPs without sufficient understanding of performance and factors leading to performance Inconsistent data reporting methods limit scientific comparison/evaluation of studies Differences in monitoring strategies and data evaluation methods result in wide range of reported “effectiveness” (e.g. – to + percent removals)
  • 3.
    Examples of InconsistenciesIn BMP Monitoring Studies Constituents Sample collection techniques Sampling approaches Data reporting Effectiveness estimation Statistical validation of results
  • 4.
    Project History UWRRCof ASCE identified the need to address Urban Stormwater BMP performance in a systematic and scientifically rigorous manner (Crested Butte Engineering Foundation Conference) The Council approached with a proposal EPA for grant funding ASCE/EPA Cooperative Agreement was Established Long-term support for project through WERF
  • 5.
    Project Approach -A Scientifically Rigorous BMP Data Collection and Analysis Effort Development of protocols for collection and reporting of BMP performance information Establish tool to store BMP monitoring and design data in standard format Establish standard techniques for data collection, storage, reporting, and analysis (guidance document) Conduct data analysis and exploration Disseminate findings Promote technically based design improvements
  • 6.
  • 7.
    Stormwater BMP Database:Current Number of BMPs 28 Maintenance Practices   Non-Structural 314 Total Structural 14 Wetland Channel 20 Wetland Basin 1 Source Controls 62 Retention Pond 10 Porous Pavement 10 Percolation Trench/Well 53 Media Filter 2 Infiltration Basin 37 Hydrodynamic Device 34 Detention Basin 71 Biofilter   Structural NUMBER OF BMPS BMP CATEGORY
  • 8.
    Distribution of CurrentStudies (Fall/07) 342 Grand Total 28 Total Non-Structural 28 Maintenance Practices   Non-Structural 314 Total Structural 14 Wetland Channel 20 Wetland Basin 1 Source Controls 62 Retention Pond 10 Porous Pavement 10 Percolation Trench/Well 53 Media Filter 2 Infiltration Basin 37 Hydrodynamic Device 34 Detention Basin 71 Biofilter   Structural NUMBER OF BMPS BMP CATEGORY BMP TOTALS BY CATEGORY 1 Canada 1 Sweden International 12 WI 34 WA 29 VA 19 TX 2 PA 13 OR 1 ON 1 OH 6 NY 3 NJ 17 NH 10 NC 7 MN 5 MI 5 MD 5 IL 2 GA 79 FL 1 CT 11 CO 64 CA 14 AL Domestic NUMBER OF BMPS STATE BMP TOTALS BY STATE/COUNTRY
  • 9.
    Several Studies HaveAttempted to Summarize BMP Performance National Pollutant Removal Performance Database, CWP, 2007 Controlling Urban Runoff: A Practical Manual for Planning and Designing Urban BMPs - Schueler 1987 Guidance Specifying Management Measures for Sources of Nonpoint Pollution In Coastal Waters –EPA 1993 The Use of Wetlands for SW Pollution Control – Strecker, 1992 Numerous local and state efforts
  • 10.
    Massachusetts Stormwater ManagementStandards - 2008 Stormwater management systems shall be designed to remove 80% of the average annual post-construction load of Total Suspended Solids (TSS). This Standard is met when: a. Suitable practices for source control and pollution prevention are identified in a long-term pollution prevention plan, and thereafter are implemented and maintained; b. Structural stormwater best management practices are sized to capture the required water quality volume determined in accordance with the Massachusetts Stormwater Handbook; and c. Pretreatment is provided in accordance with the Massachusetts Stormwater Handbook.
  • 11.
    State of thePractice: Estimated BMP Pollutant Removal Performances in BMP Manuals Source: Stormwater Management Volume One Stormwater Policy Handbook March 1997, MDEP and MCZM, Based on Scheuler, 1996 and EPA, 1993
  • 12.
    TSS Removal Table MA Standards - 2008
  • 13.
  • 14.
  • 15.
    Issue #1 Percentremoval is primarily a function of influent quality. In almost all cases, higher influent pollutant concentrations into functioning BMPs result in reporting of higher pollutant removals than those with cleaner influent. Use of percent removal may be more reflective of how “dirty” the influent water is than how well the BMP is actually performing. Maximize percent removal, the catchment upstream should be dirty (which does not encourage use of good source controls or a treatment train design approach).
  • 16.
    Example Study -SWFWMDTampa Pond Drainage area, 6.5 acres Land use (commercial, office) 30% roof tops and parking lots, 6% crushed stone, 64 % grassed Drained by swales to pond Five year study with two design modifications 1990 (shallow and vegetated,  H = 2 day) 1993 (volume increased, 35% veg,  H = 5 day) 1994 (area enlarged, replant littoral zone,  H = 14 day)
  • 17.
    Which design hasthe highest percent removal? Second best? Which design has the best effluent quality? Is it worth going to a 14-day residence time to get to 5 mg/L?
  • 18.
    Performance Criteria forCommercial BMPs is Needed, but Problematic
  • 19.
    Spurious Correlation (TypeVII; Benson, 1965)
  • 20.
    Issue #2 Significantvariations in percent removal may occur for BMPs providing consistently good effluent quality. The variability in percent removal is almost always much broader than the uncertainty of effluent pollutant concentrations. These variations in percent removal have little relationship to the effluent quality achieved.
  • 21.
    Box plots offractions of Total Suspended Solids (TSS) removed and of effluent quality of selected BMP Types TSS (mg/L) BMP Type Fraction of TSS Removed
  • 22.
  • 23.
  • 24.
    Issue #3  BMPs with high percent removal (e.g., greater than 80% removal of total suspended solids, or TSS) may have unacceptably high concentrations of pollutants in effluent (e.g., greater than 100 milligrams per liter of TSS), Can lead to a false determination that BMPs are performing well or are “acceptable,” when in fact they are not.
  • 25.
    Lake George FieldStudy Evaluation Vortechs model 11000 Is an average of 100+ mg/l TSS acceptable performance? (Winkler and Guswa 2002)
  • 26.
    Issue #4 Variousrelationships between influent and effluent concentrations have been demonstrated for a variety of BMPs and designs. The relationships are often complex and are not well represented by a single ratio of inflow-to-outflow concentrations. In addition, many BMPs that are functioning well appear to reach an irreducible concentration. Any measure of BMP performance should be universally interpretable regardless of influent concentration, BMP function, design, number of samples collected, etc.
  • 27.
  • 28.
    Issue #5 Methodsfor calculating percent removal are inconsistent Median, inflow load to outflow load, slope of regression of loads, slope of regression of concentrations, etc... Very different percent removals can be reported from the same data set.
  • 29.
    Issue #6 Frequently,in many methods, percent removal is dominated by outliers or high-concentration events in a series that have high leverage on an average. The standard reporting of percent removal carries none of the statistical support needed to assess uncertainty in the reported value.
  • 30.
    Issue #7 ManyBMPs that have been monitored do not have enough data to reject the null hypothesis that the influent and effluent concentrations are even different from one another We cannot tell if the BMP reduces anything), yet these numbers are published as indicative of performance. Some studies have reported small percent increases in performance erroneously, when in fact the influent and effluent concentrations are not statistically different from one another.
  • 31.
    Issue #8 Whenpercent removals are applied in modeling efforts, the resulting estimated effluent concentrations can be very misleading Particularly when the effluent quality predicted has not been observed in data sets for the practice being modeled. TMDLs? BMPs in Series?
  • 32.
    Issue #9 Manyvolume-based BMPs have long-term performance that is not evident if a paired inflow-outflow percent removal approach is taken (i.e., material from one event is discharged in another).
  • 33.
  • 34.
  • 35.
    Issue #10 Interms of meeting receiving-water standards, BMP discharges can comply with receiving-water numeric targets while simultaneously not showing favorable percent removals.
  • 36.
    Issue #11 Rangeof expected effluent-quality concentrations is a much better planning and design tool than percent removal estimates. For example, an engineer can use effluent concentrations as a tool to estimate the range of pollutant loading that could be expected at a new development. This is particularly important in sensitive watersheds where it is important to have confidence that BMPs will be adequately protective.
  • 37.
    Issue #12 Therequirement to use percent removals to assess BMP performance can bias monitoring designs. In effect, incentive is provided to monitor BMPs at relatively dirty locations or areas with poor source controls in place so that the BMP performance “looks better.” The project team has seen this intentionally done.
  • 38.
    Issue #13 Percentremoval does not provide a meaningful mechanism to address the well-established concept of irreducible pollutant concentrations Expressed by Thomas R. Schueler in Center for Watershed Protection publications (See “Article 65: Irreducible Concentrations Discharged From Stormwater Practices” in The Practice of Watershed Protection ).
  • 39.
  • 40.
    Issue #14 Percentremovals do not adequately reflect the effect of volume reductions. In some percent removal calculation methods, volume reductions are partially taken into account, but not in others. Even when load reductions are used, this approach misses the benefit of the reduced frequency of discharges.
  • 41.
    Runoff Volume ControlDetention Ponds Biofilters Hydrodynamic Devices Media Filters Retention Ponds Wetland Basins
  • 42.
    Runoff Volume ControlConsider “credit” for volume reduction in design requirements 0.96 Retention Ponds 0.69 Biofilter 0.87 Detention Basin Mean Monitored Outflow/Mean Monitored Inflow for Events Where Inflow is Greater Than or Equal to 0.2 Watershed Inches BMP Type
  • 43.
    Issue #15 Percentremoval methods also sometimes miss the measurement of how much runoff is and is not treated. There are example studies in which the percent removal has been reported based on the influent and low-flow effluent (e.g., the flow stream that has received treatment) from a BMP; however, the majority of flow was bypassing the BMP due to clogging. BMP sizing relative to incoming runoff is important in performance metrics.
  • 44.
    The State ofthe Practice is Shifting - EPA
  • 45.
    How Can WeDo Better? Performance should be measured by: How much the BMP reduces runoff volumes How much runoff is treated (versus bypassed) Whether the BMP can demonstrate a statistical difference in effluent quality compared to influent quality What distribution of effluent quality is achieved How well the BMP reduces peak runoff rates, especially for smaller, frequent storms (which helps reduce hydromodification)