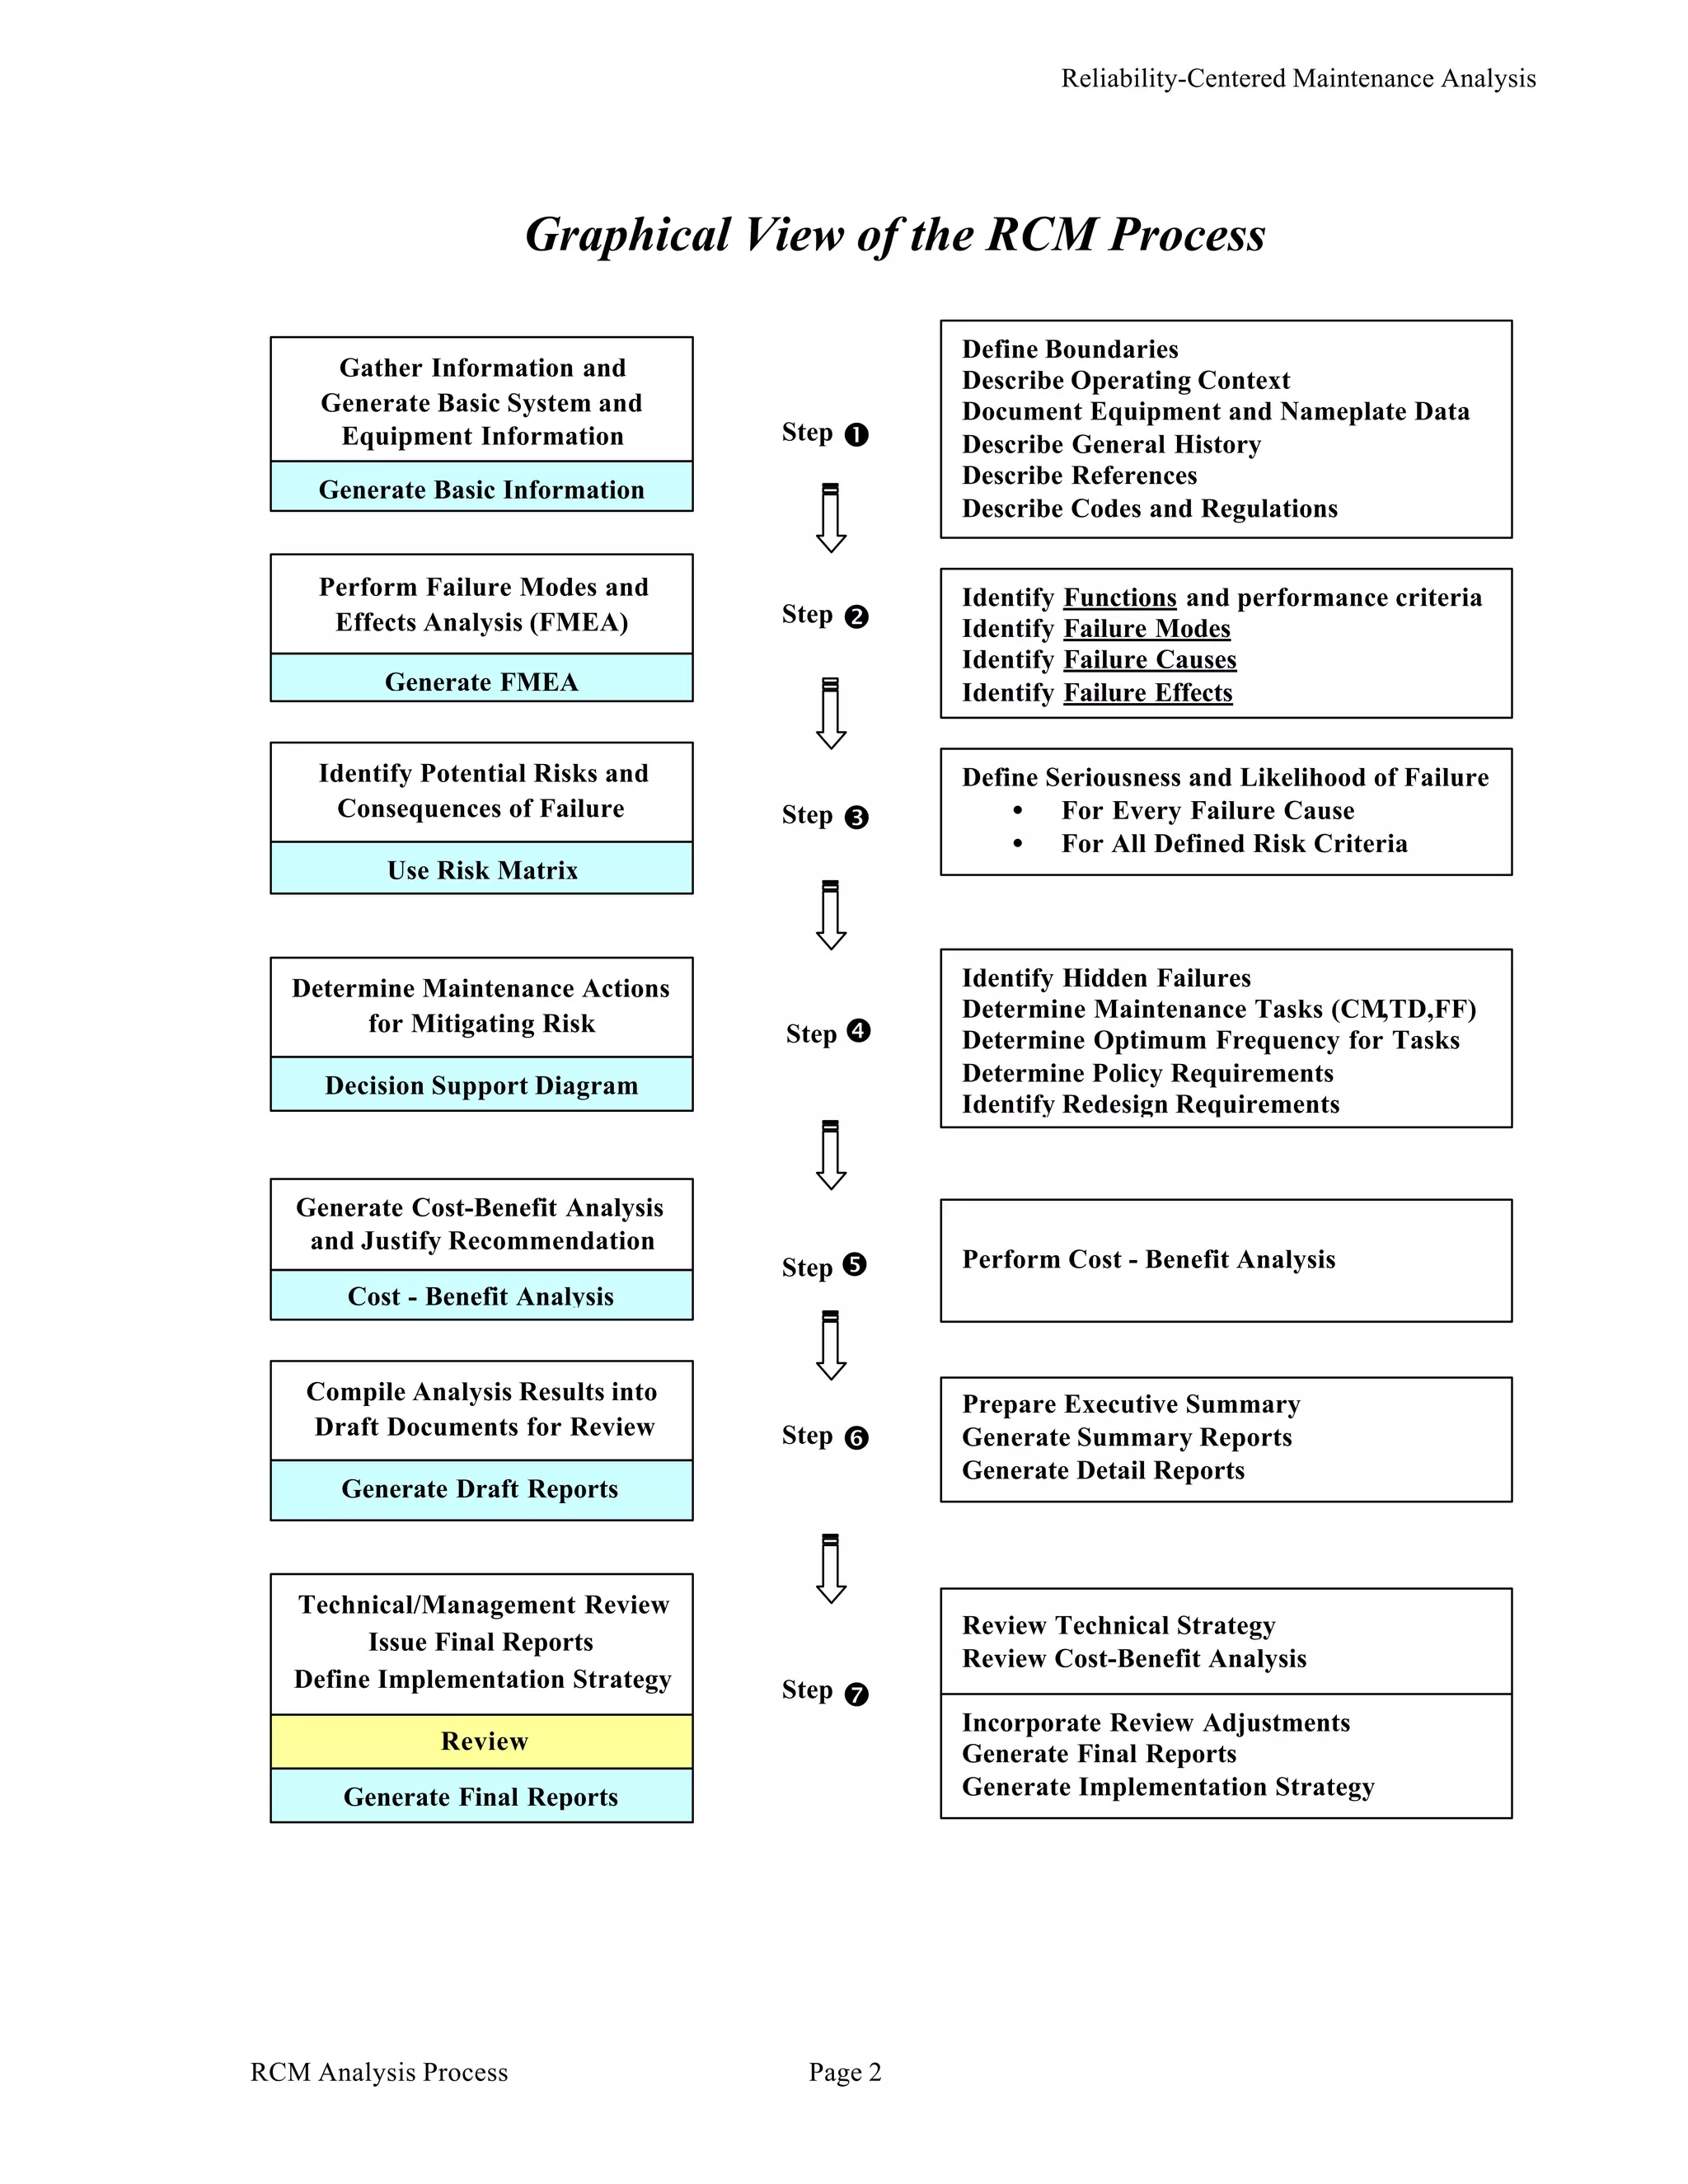
The RCM analysis process consists of 7 steps to determine the best maintenance strategy for an asset. It involves gathering basic information, performing a failure modes and effects analysis, identifying risks of failure, determining maintenance actions to mitigate risks, analyzing costs and benefits, compiling results, and generating final reports. The process is supported by software that facilitates information sharing and automatic report generation.
Detailed and comprehensive contents:
History of FMEA
Overview (What is FMEA and What it can do for you?)
Scope/when to use?
Objective of FMEA
FMEA terminology
AIAG FMEA 4th edition (Old edition)
Introduction of AIAG VDA FMEA (New edition)
Why new AIAG VDA FMEA?
Major changes
Steps of FMEA
Severity rating
Occurrence rating
Detection rating
AP Table
Case study
PFMEA, Risk Reduction and Effectiveness – Advance (AIAG FMEA #4 Edition)
Is your FMEA performing for you?
This is advance level of PFMEA, Have basic understanding fo Core IATF Tools before refering to this presentation.
FMEA has been around for many decades and has a long history as a method to support product designs, manufacturing processes, service, and maintenance. The plain truth is FMEA has the potential to be a very powerful tool to achieve high reliability in products and processes; and when done well, it is remarkably effective. Yet in practice, FMEA does not always achieve the expected results. Based on the experience of over two thousand FMEAs and working with many companies in a wide variety of applications, certain common mistakes show up repeatedly. What are the primary ways that FMEAs can be done wrongly (mistakes made), and what are the quality characteristics that make for effective FMEAs (quality objectives)? These questions are answered in this new short course on FMEA
Legal Aspects of FMEA, overview of Canadian Law,
Due Diligence vs Negligence, Criminal Negligenced and what everyone needs to know about duty of care
www.6sengineering.com
Failure Mode and Effect Analysis (FMEA) Manual.
- The role and function of FMEA.
- Concepts and techniques of Design FMEA and how to apply it.
- Concepts and techniques of Process FMEA and how to apply it.
- The role and function of FTA.
- Concepts of Zero Quality Control and Mistake Proofing and its implications for FMEA.
ABOUT THE TRAINING PROGRAM :-
Failure Mode and Effects Analysis or FMEA is a structured technique to analyze a process to determine shortcomings and opportunities for improvement. By assessing the severity of a potential failure, the likelihood that the failure will occur, and the chance of detecting the failure, dozens or even hundreds of potential issues can be prioritized for improvement.
DESIGNED FOR :-
Sr. Engineer, Engineer, Supervisor and Foreman engaged in maintenance, operation, Store, Supply chain, Quality, Safety and Engineering activities.
OBJECTIVE :-
Employees completing this training will be able to effectively participate on an FMEA team and can make immediate contributions to quality and productivity improvement efforts.
Maveric - Automation of Release & Deployment ManagementMaveric Systems
This paper highlights
why automation
platforms for
application release and
deployment are
becoming increasingly
vital for global
enterprises and
explores the specific
requirements of such a
platform in order for it
to prove beneficial,
effective and offer a
substantial return on
investment.
Conduct, record & analyse Internal Process Potential Audits.
Allow distribution to your Suppliers for Self Audit.
Enable your Suppliers to report Self Audit Results back to you.
Conduct Process Feasibility Audits on your Suppliers.
Report Supply Chain Process Potential Audit results to your Customers.
Eliminate Rating Discrepancies.
Build Audit Question Databases.
Schedule Routine & Special Audits.
Prioritise Corrective Actions on yourselves and your Suppliers.
Gain Preliminary Results of Full Process Audits.
6 panel manual training guide by Tonatiuh Lozada Duarte an excellent method o...Tonatiuh Lozada Duarte
Besides the traditional 8D's to solve problems this a great method to solve any problem, companies as Ford Motor Company requires this method to their suppliers to get quick and correct solutions, I hope this material can be helpful for you.
Boost Conversions and Raise your Revenues with A/B testing in RailsDaniel Pritchett
Boost Conversions and Raise your Revenues with A/B testing in Rails:
Motivations:
* Products with highly relevant messaging find their way into the hands of people happy to pay for them.
* Gain insight into which features of your product resonate most with customers.
* Validate market appetites for different flavors of product messaging.
* Propose alternate layouts without compromising overall design goals.
* Automation skills harmonize well with product and marketing groups in this arena.
Have a look at these 6 slides and see that historically, we justified the abuse of humans.
After becoming more civilised and enlightened we have moved on to animals.
The comparisons are sad
Software QA Metrics Dashboard BenchmarkingJohn Carter
Software metrics best practices from a benchmarking assignment that indicates how software metrics are reported to management and used to drive behavior. We learned how leading companies used dashboards to report on quality progress and improvement results. We found the best organizations focused on the vital few metrics but also had automated systems with the ability to drill down on metrics at the divisional and team levels. In addition, the best normalized the metrics by number of customers or complexity. They systematically used root cause analysis to analyze bugs in the field. The SW Quality metrics often went beyond the strict definition of quality in that they also measured release predictability and feature expectations. Finally, the best companies used external benchmarks to set their quality targets.
Introduction of FMEA; Definition, Activities, important terms, factors, RPN; Process of FMEA; Steps of FMEA
Types of FMEA; FMEA Application; FMEA Related Tools:
Root Cause Analysis, Pareto Chart, Cause Effect Diagram
TradeTech Architecture 2011 - Rodney Morrison, How to Achieve Success with Ap...SL Corporation
Rodney Morrison, SL’s Vice President of Products delivered a talk entitled, “How to Achieve Success With
Application Performance Monitoring Initiatives” at TradeTech Architecture 2011.
Regulatory expectation & design approach on continuous process verificationKaran Rajendra Khairnar
This presentation will guide you on regulatory expectation & how to design approach on Continuous process verification (Stage III) of Process Validation
Karan7may@gmail.com
Smart Data Management and Advanced Analytics with Bio4C™ ProcessPadMilliporeSigma
Watch the recording of this webinar here: https://bit.ly/2XFhqGj
Smart data management software, such as Bio4C™ ProcessPad, acquires data from disparate sources (paper records, spreadsheets, databases, LIMS, QMS, machine data) and automatically aggregates it into analysis-ready format for data visualization & analysis.
Now Bio4C™ ProcessPad’s advanced multivariate analytics capabilities enable quick identification of outlier batches within 100s of critical performance parameters and quality attributes and helps determine which process attributes are contributing to process variability.
Bio4C™ ProcessPad is a data visualization, advanced analytics, and process monitoring platform that enables bioprocess lifecycle management, reporting, investigations, and continued process verification (CPV). Intelligently combining process data from batches, ERP, MES, LIMS, Historians, process equipment, and manual sources into a single, validated data source, Bio4C™ ProcessPad ensures data is current, complete, and contextual throughout the product lifecycle.
In this webinar, you will learn about:
• Next generation bioprocessing and the BioContinuum™ Platform
• Bio4C™ ProcessPad data management software – capabilities around CPV, reporting, and process lifecycle management
• Statistical process control case studies - yield variability and instrument maintenance
• Advanced analytics (outlier detection using PCA and anomaly pattern search against historical data)
Smart Data Management and Advanced Analytics with Bio4C™ ProcessPadMerck Life Sciences
Watch the recording of this webinar here: https://bit.ly/2XFhqGj
Smart data management software, such as Bio4C™ ProcessPad, acquires data from disparate sources (paper records, spreadsheets, databases, LIMS, QMS, machine data) and automatically aggregates it into analysis-ready format for data visualization & analysis.
Now Bio4C™ ProcessPad’s advanced multivariate analytics capabilities enable quick identification of outlier batches within 100s of critical performance parameters and quality attributes and helps determine which process attributes are contributing to process variability.
Bio4C™ ProcessPad is a data visualization, advanced analytics, and process monitoring platform that enables bioprocess lifecycle management, reporting, investigations, and continued process verification (CPV). Intelligently combining process data from batches, ERP, MES, LIMS, Historians, process equipment, and manual sources into a single, validated data source, Bio4C™ ProcessPad ensures data is current, complete, and contextual throughout the product lifecycle.
In this webinar, you will learn about:
• Next generation bioprocessing and the BioContinuum™ Platform
• Bio4C™ ProcessPad data management software – capabilities around CPV, reporting, and process lifecycle management
• Statistical process control case studies - yield variability and instrument maintenance
• Advanced analytics (outlier detection using PCA and anomaly pattern search against historical data)
Dr. Benetis briefly presented how modern, real time and automated technology from Lumension (Risk & Compliance Manager) is used to audit and monitor level of security in Lithuania's public sector. Presentation showed real use cases how solution made security measurement easier and more efficient. Dr. Benetis is also a president of ISACA Lithuania chapter.
Organisations are realising seriouness of cybersecurity and searching for ways to manage and govern it. How to organise security initiatives? How to monitor their success? How to build trust in own risk management? How to develop compliance management as a simple, but efficient and helpful instrument for everyone in organisation? Presentation will touch on practicalities of risk and compliance methods integration, and overall strategy to minimise costs of risk and compliance initiatives by using Lumension Risk Manager platform for public and private institutions.
Kubernetes & AI - Beauty and the Beast !?! @KCD Istanbul 2024Tobias Schneck
As AI technology is pushing into IT I was wondering myself, as an “infrastructure container kubernetes guy”, how get this fancy AI technology get managed from an infrastructure operational view? Is it possible to apply our lovely cloud native principals as well? What benefit’s both technologies could bring to each other?
Let me take this questions and provide you a short journey through existing deployment models and use cases for AI software. On practical examples, we discuss what cloud/on-premise strategy we may need for applying it to our own infrastructure to get it to work from an enterprise perspective. I want to give an overview about infrastructure requirements and technologies, what could be beneficial or limiting your AI use cases in an enterprise environment. An interactive Demo will give you some insides, what approaches I got already working for real.
UiPath Test Automation using UiPath Test Suite series, part 4DianaGray10
Welcome to UiPath Test Automation using UiPath Test Suite series part 4. In this session, we will cover Test Manager overview along with SAP heatmap.
The UiPath Test Manager overview with SAP heatmap webinar offers a concise yet comprehensive exploration of the role of a Test Manager within SAP environments, coupled with the utilization of heatmaps for effective testing strategies.
Participants will gain insights into the responsibilities, challenges, and best practices associated with test management in SAP projects. Additionally, the webinar delves into the significance of heatmaps as a visual aid for identifying testing priorities, areas of risk, and resource allocation within SAP landscapes. Through this session, attendees can expect to enhance their understanding of test management principles while learning practical approaches to optimize testing processes in SAP environments using heatmap visualization techniques
What will you get from this session?
1. Insights into SAP testing best practices
2. Heatmap utilization for testing
3. Optimization of testing processes
4. Demo
Topics covered:
Execution from the test manager
Orchestrator execution result
Defect reporting
SAP heatmap example with demo
Speaker:
Deepak Rai, Automation Practice Lead, Boundaryless Group and UiPath MVP
Neuro-symbolic is not enough, we need neuro-*semantic*Frank van Harmelen
Neuro-symbolic (NeSy) AI is on the rise. However, simply machine learning on just any symbolic structure is not sufficient to really harvest the gains of NeSy. These will only be gained when the symbolic structures have an actual semantics. I give an operational definition of semantics as “predictable inference”.
All of this illustrated with link prediction over knowledge graphs, but the argument is general.
GDG Cloud Southlake #33: Boule & Rebala: Effective AppSec in SDLC using Deplo...James Anderson
Effective Application Security in Software Delivery lifecycle using Deployment Firewall and DBOM
The modern software delivery process (or the CI/CD process) includes many tools, distributed teams, open-source code, and cloud platforms. Constant focus on speed to release software to market, along with the traditional slow and manual security checks has caused gaps in continuous security as an important piece in the software supply chain. Today organizations feel more susceptible to external and internal cyber threats due to the vast attack surface in their applications supply chain and the lack of end-to-end governance and risk management.
The software team must secure its software delivery process to avoid vulnerability and security breaches. This needs to be achieved with existing tool chains and without extensive rework of the delivery processes. This talk will present strategies and techniques for providing visibility into the true risk of the existing vulnerabilities, preventing the introduction of security issues in the software, resolving vulnerabilities in production environments quickly, and capturing the deployment bill of materials (DBOM).
Speakers:
Bob Boule
Robert Boule is a technology enthusiast with PASSION for technology and making things work along with a knack for helping others understand how things work. He comes with around 20 years of solution engineering experience in application security, software continuous delivery, and SaaS platforms. He is known for his dynamic presentations in CI/CD and application security integrated in software delivery lifecycle.
Gopinath Rebala
Gopinath Rebala is the CTO of OpsMx, where he has overall responsibility for the machine learning and data processing architectures for Secure Software Delivery. Gopi also has a strong connection with our customers, leading design and architecture for strategic implementations. Gopi is a frequent speaker and well-known leader in continuous delivery and integrating security into software delivery.
UiPath Test Automation using UiPath Test Suite series, part 3DianaGray10
Welcome to UiPath Test Automation using UiPath Test Suite series part 3. In this session, we will cover desktop automation along with UI automation.
Topics covered:
UI automation Introduction,
UI automation Sample
Desktop automation flow
Pradeep Chinnala, Senior Consultant Automation Developer @WonderBotz and UiPath MVP
Deepak Rai, Automation Practice Lead, Boundaryless Group and UiPath MVP
Search and Society: Reimagining Information Access for Radical FuturesBhaskar Mitra
The field of Information retrieval (IR) is currently undergoing a transformative shift, at least partly due to the emerging applications of generative AI to information access. In this talk, we will deliberate on the sociotechnical implications of generative AI for information access. We will argue that there is both a critical necessity and an exciting opportunity for the IR community to re-center our research agendas on societal needs while dismantling the artificial separation between the work on fairness, accountability, transparency, and ethics in IR and the rest of IR research. Instead of adopting a reactionary strategy of trying to mitigate potential social harms from emerging technologies, the community should aim to proactively set the research agenda for the kinds of systems we should build inspired by diverse explicitly stated sociotechnical imaginaries. The sociotechnical imaginaries that underpin the design and development of information access technologies needs to be explicitly articulated, and we need to develop theories of change in context of these diverse perspectives. Our guiding future imaginaries must be informed by other academic fields, such as democratic theory and critical theory, and should be co-developed with social science scholars, legal scholars, civil rights and social justice activists, and artists, among others.
Accelerate your Kubernetes clusters with Varnish CachingThijs Feryn
A presentation about the usage and availability of Varnish on Kubernetes. This talk explores the capabilities of Varnish caching and shows how to use the Varnish Helm chart to deploy it to Kubernetes.
This presentation was delivered at K8SUG Singapore. See https://feryn.eu/presentations/accelerate-your-kubernetes-clusters-with-varnish-caching-k8sug-singapore-28-2024 for more details.
Slack (or Teams) Automation for Bonterra Impact Management (fka Social Soluti...Jeffrey Haguewood
Sidekick Solutions uses Bonterra Impact Management (fka Social Solutions Apricot) and automation solutions to integrate data for business workflows.
We believe integration and automation are essential to user experience and the promise of efficient work through technology. Automation is the critical ingredient to realizing that full vision. We develop integration products and services for Bonterra Case Management software to support the deployment of automations for a variety of use cases.
This video focuses on the notifications, alerts, and approval requests using Slack for Bonterra Impact Management. The solutions covered in this webinar can also be deployed for Microsoft Teams.
Interested in deploying notification automations for Bonterra Impact Management? Contact us at sales@sidekicksolutionsllc.com to discuss next steps.
Dev Dives: Train smarter, not harder – active learning and UiPath LLMs for do...UiPathCommunity
💥 Speed, accuracy, and scaling – discover the superpowers of GenAI in action with UiPath Document Understanding and Communications Mining™:
See how to accelerate model training and optimize model performance with active learning
Learn about the latest enhancements to out-of-the-box document processing – with little to no training required
Get an exclusive demo of the new family of UiPath LLMs – GenAI models specialized for processing different types of documents and messages
This is a hands-on session specifically designed for automation developers and AI enthusiasts seeking to enhance their knowledge in leveraging the latest intelligent document processing capabilities offered by UiPath.
Speakers:
👨🏫 Andras Palfi, Senior Product Manager, UiPath
👩🏫 Lenka Dulovicova, Product Program Manager, UiPath
Essentials of Automations: Optimizing FME Workflows with ParametersSafe Software
Are you looking to streamline your workflows and boost your projects’ efficiency? Do you find yourself searching for ways to add flexibility and control over your FME workflows? If so, you’re in the right place.
Join us for an insightful dive into the world of FME parameters, a critical element in optimizing workflow efficiency. This webinar marks the beginning of our three-part “Essentials of Automation” series. This first webinar is designed to equip you with the knowledge and skills to utilize parameters effectively: enhancing the flexibility, maintainability, and user control of your FME projects.
Here’s what you’ll gain:
- Essentials of FME Parameters: Understand the pivotal role of parameters, including Reader/Writer, Transformer, User, and FME Flow categories. Discover how they are the key to unlocking automation and optimization within your workflows.
- Practical Applications in FME Form: Delve into key user parameter types including choice, connections, and file URLs. Allow users to control how a workflow runs, making your workflows more reusable. Learn to import values and deliver the best user experience for your workflows while enhancing accuracy.
- Optimization Strategies in FME Flow: Explore the creation and strategic deployment of parameters in FME Flow, including the use of deployment and geometry parameters, to maximize workflow efficiency.
- Pro Tips for Success: Gain insights on parameterizing connections and leveraging new features like Conditional Visibility for clarity and simplicity.
We’ll wrap up with a glimpse into future webinars, followed by a Q&A session to address your specific questions surrounding this topic.
Don’t miss this opportunity to elevate your FME expertise and drive your projects to new heights of efficiency.
Essentials of Automations: Optimizing FME Workflows with Parameters
Lrrcm Analysis Process
1. Reliability-Centered Maintenance Analysis
A Description of the RCM Process and an Explanation of the Reports
A Description of The RCM Analysis Process consists of seven clearly defined steps
the RCM Process that lead an analyst to the conclusions of the best maintenance
strategy for a particular asset or system. These seven steps are
summarized here, and described in more detail below.
• Gather and document basic information about the asset
• Perform a failure modes and effects analysis (FMEA)
• Identify potential risks and consequences of failure
• Determine maintenance actions for mitigating risk
• Generate a cost-benefit analysis and justify recommendations
• Compile the results and generate draft documents for review
• Incorporate review comments and generate a final report
Preliminary Step Prior to performing the analysis, it is necessary to select the
-------------------------------- system to be analyzed. Each organization will have their own
Select System for Analysis approach for making these selections, and usually the factors that
are considered include past history of failure, economic impact as a
result of failure, availability of information, and the availability
and experience of the analysis team with respect to the individual
asset or system.
Because there is such an abundance of equipment, and typically so
few people to perform analysis work, it is vital that this selection
process be conducted carefully.
_____________________________________________________
Software Tools to Support While it is possible to document this process in simple word
the RCM Process documents or spreadsheets, the premier tool for performing this
-------------------------------- analysis is RCM Strategy Plus™. The use of this tool enables the
RCM Strategy Plus™ following benefits:
• consistent sharing of information between all agency
centers, including subcontractors,
• extensive knowledge base of equipment analyses,
• conformance to approved RCM methodologies,
• advanced techniques for assessing risk and potential
consequences of failure,
• integration with CMMS and on-line monitoring and
expert diagnostic tools, and
• automatic generation of reports.
RCM Analysis Process Page 1
2. Reliability-Centered Maintenance Analysis
Graphical View of the RCM Process
Define Boundaries
Gather Information and Describe Operating Context
Generate Basic System and Document Equipment and Nameplate Data
Œ
Step
Equipment Information Describe General History
Describe References
Generate Basic Information
Describe Codes and Regulations
Perform Failure Modes and Identify Functions and performance criteria
•
Step
Effects Analysis (FMEA) Identify Failure Modes
Identify Failure Causes
Generate FMEA Identify Failure Effects
Identify Potential Risks and Define Seriousness and Likelihood of Failure
• For Every Failure Cause
Consequences of Failure Ž
Step
• For All Defined Risk Criteria
Use Risk Matrix
Identify Hidden Failures
Determine Maintenance Actions
Determine Maintenance Tasks (CM,TD,FF)
Step •
for Mitigating Risk
Determine Optimum Frequency for Tasks
Determine Policy Requirements
Decision Support Diagram
Identify Redesign Requirements
Generate Cost-Benefit Analysis
and Justify Recommendation
Step • Perform Cost - Benefit Analysis
Cost - Benefit Analysis
Compile Analysis Results into Prepare Executive Summary
Draft Documents for Review
‘
Step Generate Summary Reports
Generate Detail Reports
Generate Draft Reports
Technical/Management Review
Review Technical Strategy
Issue Final Reports
Review Cost-Benefit Analysis
Define Implementation Strategy
’
Step
Incorporate Review Adjustments
Review Generate Final Reports
Generate Implementation Strategy
Generate Final Reports
RCM Analysis Process Page 2
3. Reliability-Centered Maintenance Analysis
Step Œ This step gathers and starts documenting basic information
Basic Information about the system being ana lyzed. By understanding the
process fluid flow from a Piping and Instrumentation Diagram
(P&ID) or diagrams and electrical schematics, it is possible to
establish boundaries and identify the equipment that is contained
within those boundaries. It is then necessary to describe and
document certain basic information about the system that will be
instrumental in developing the ultimate maintenance strategy for
that system.
The basic information that must be generated for the system
includes the following:
• Equipment Boundaries,
• Operating Context,
• Equipment Nameplate Data,
• General History about the System and Equipment,
• References that will be helpful in performing the analysis,
such as: operator manuals, maintenance manuals,
drawings, diagrams and schematics, codes and regulations,
photographs, and other miscellaneous references.
Step • This step defines and describes all of the possible ways that the
Perform a Failure Modes system can fail, and drills down to specific causes leading to those
and Effects Analysis failures and their associated effects. The process of generating
(FMEA) FMEA’s first defines the functions of the system, which then leads
to identifying the modes by which the system can fail to provide
those functions. The specific mechanisms by which those modes
of failure occur are called failure causes. The final step in the
FMEA analysis is to describe the “effects” of failure, which are the
physical events that take place when the failure happens.
Step Ž This step determines why each failure cause matters. It evaluates
Identify Consequences of the seriousness of the failure with the likelihood that the failure
Failure using a Risk will occur. The result is the rank of potential risk or consequence
Matrix associated with that failure cause.
In order to be comprehensive in the analysis, evaluation criteria
typically considers such factors as personnel safety, public health
and environmental issues, economic factors, foregone revenues
associated with lost opportunity, maintenance cost, and impact to
mission. Each failure cause is ranked into common categories of
risk (i.e. high, medium, low, no). User organizations are able to
define their own categories and use their customized terminology.
RCM Analysis Process Page 3
4. Reliability-Centered Maintenance Analysis
Step • This step uses a decision support diagram to determine the best
Determine Maintenance maintenance actions for mitigating the risk associated with each
Actions for Mitigating and every failure cause. In addition to identifying hidden failures,
Risk using a Decision this step will also determine policy requirements, and when there
Support Diagram are no cost effective and applicable actions that can mitigate risk, it
will identify redesign requirements as the last opportunity for
creating an acceptable situation. When the potential risk of failure
is acceptable and there are no cost effective actions, there will be
many times that a “run-to-failure” philosophy will be the
recommended approach.
The types of actions that are identified by the Decision Support
Diagram include the following:
• Time Directed (Health Restorative)
• Condition Monitoring
• Condition Directed
• Failure Finding
• Training Program
• Administrative Policies or Procedures
• Redesign
• No Scheduled Maintenance (Run-To-Failure)
Determine Task This step determines the best fr equency by which to perform the
Frequency maintenance actions identified in the above process. There are
several methods by which this frequency can be determined. If the
task is associated with a hidden failure, then there are
mathematical equations that will help calculate this frequency. For
all other tasks, the user must understand the nature of the failure as
it pertains to a common degradation curve (often known as the P-F
curve) in order to make the best frequency judgment.
There are advanced reliability calculations that can be performed
associated with failures for which accurate failure and consequence
data is available. These advanced reliability calculations normally
only apply to a very small number of equipment.
Regardless of the method used for determining the frequency of
the recommended action, the analyst should document the
reasoning behind the entire decision support process and how the
frequency was determined. The Failure Analysis Report displays
this information.
RCM Analysis Process Page 4
5. Reliability-Centered Maintenance Analysis
Step • This step provides justification for the resulting recommendations.
Generate a Cost Benefit It compares the cost of performing the maintenance actions with
Analysis the translated cost of risk to arrive at a financial benefit. This cost-
benefit analysis provides an excellent tool supporting the decision
making process for approving the recommendations.
Step ‘ This step generates the package of reports that a review team uses
Compile Results and to review all of the analysis information for technical content,
Generate Draft Reports financial impact, and ability to implement. It also includes an
For Review executive summary which highlights the key information of the
analysis.
Step ’ This step incorporates all of the comments and necessary
Final Report adjustments from the previous step and generates a final, complete
package of reports. Accompanying this final report should be a
description of how the analysis was created and a plan for
implementation.
Explanation of The entire set of reports for this analysis consists of 16
Reports individual reports, compiled into one comprehensive package. The
reports are organized into the following categories:
Overview Reports
• Executive Summary Report
Operating Context and Support Information
• Operating Context Report
• Analysis Boundaries Report
• General History Report
• Codes / Regulations Report
Analysis Reports
Failure Summary
• Failure Modes and Effects (FMEA) Tree Report
• Functions and Failure Modes Report
Failure Details
• Decision Support Diagram Response Summary Report
• Failure Analysis Report
Maintenance Action Information
• Summary of Maintenance Costs vs. Task Costs Report
• Summary of Maintenance Actions by Frequency report
• Summary of Maintenance Actions by Skill Code Report
• Details of Maintenance Actions Report
Appendices
• Drawings, diagrams and Photographs Report
• Risk Matrix Report
• List of Abbreviations Report
RCM Analysis Process Page 5
6. Reliability-Centered Maintenance Analysis
Executive Summary This report provides a high level summary of the project and the
analysis. It describes the team of people involved in the project,
the objective of the analysis, the scope of the analysis, a summary
of the results of the analysis, a summary of the recommendations, a
summary of the benefits associated with executing the
recommendations, and a description of the proposed
implementation plan.
Operating Context This report provides a description of the operating context
Report associated with the asset or system. It may also include a
description of the operating context of the hierarchical elements
above the asset or system being analyzed, such as the building,
area, plant or organization that is associated with this system.
General History This report provides a description of any known failures and
Report degradation issues with the system or asset. It also includes any
pertinent information that should be documented with the analysis
such as age of the equipment, operating behavior of the equipment,
and unique characteristics that should be documented, or anything
else that the analyst feels may be of value that contributes to an
improved understanding or current of past performance.
Codes / Regulations This report provides a description of all known codes and
Report regulations that should be documented which contribute toward
decisions associated with the recommendations. Such codes and
regulations should include federal, state, regional, municipal, and
local as well as any internal organizational policies and procedures.
OSHA and DOT and other related codes and regulations should
also be included in this report.
Failure Modes and This report provides a summary of the functions, failure modes
Effects (FMEA) and failure causes of the analysis. It also displays the risk ranking
Tree Report results of each failure cause.
Functions and Failure This report provides a detailed description of the functions,
Modes Report failure modes and failure causes. It includes a numbered listing of
each item so that they can easily be referenced throughout the
entire package of reports.
Decision Support This report provides a single page tabulation of the responses
Diagram Response that were documented for each failure cause while navigating
Summary Report through the Decision Support Diagram. It also provides a graphical
display of the Decision Support Diagram itself. This report
provides an appreciation for the overall flavor of the types of
maintenance action recommendations that were made for the
analysis.
RCM Analysis Process Page 6
7. Reliability-Centered Maintenance Analysis
Failure Analysis This report provides a description of the maintenance action
Report recommendations that are made for each failure cause, as well as
documenting all of the Decision Support Diagram responses. In
addition, the report includes any comments associated with why or
how the Decision Support Diagram responses were made, as well
as the frequency of the recommended maintenance action and any
justification related to those frequency selections.
Summary of Failure This report provides a description of the risk mitigated and the
Costs vs. Task Costs benefit achieved as a result of the recommended maintenance
Report actions. It shows specifically which category of risk is mitigated,
and it provides a dollar savings associated with that mitigation. It
also shows the cost of performing the maintenance actions in order
to generate an entire savings associated with each and every failure
cause.
Summary of Maintenance This report provides a summary of all the maintenance actions that
Actions by Frequency are recommended. The actions are organized by frequency, and
Report for each action, it shows all the failures causes that are associated
with that action.
Summary of Maintenance This report provides a summary of all the maintenance actions that
Actions by Skill Code are recommended. The actions are organized by the skill code that
Report they are assigned to.
Details of Maintenance This report provides the details of each of the recommended
Actions Report maintenance actions.
Drawings, Diagrams and This report provides a printout of any drawings, diagrams,
Photographs Report photographs, or any other digitally captured file or document
associated with the asset or system.
Risk Matrix Report This report provides a description of the entire configuration of the
risk matrix. It includes all definitions of seriousness, likelihood of
failure, definitions of risk, and details about the risk matrix itself.
List of Abbreviations This report provides a listing and reference of the all the
Report abbreviations that are used in the entire package of reports.
RCM Analysis Process Page 7